


1. Background
Type 1 diabetes mellitus (T1D) is one of the most prevalent endocrine and metabolic diseases of childhood (1). In the vast majority of patients (70 - 90%), β-cell loss is the consequence of T1D-related autoimmunity with the formation of T1D-related autoantibodies (2). More than 90% of patients with newly diagnosed T1D have measurable amounts of antibodies against pancreas islet cells, insulin, tyrosine phosphatase-like protein IA2 (IA2-ab), indole-3-acetic acid, glutamic acid decarboxylase, zinc transporter 8, and tetraspanin-7 transporter (3). The majority of persons who have just one autoantibody do not acquire T1D. However, when youngsters have two or more of these autoantibodies, there is a significant chance of acquiring T1D by the age of 18 (4).
Since diabetes is defined by abnormal glucose metabolism, assessment of the pancreas in diabetic patients has mostly focused on changes in the islet cells of Langerhans (endocrine pancreas). Given that the pancreatic islet cells occupy only 2% to 4% of the fractional area of pancreatic parenchyma, the total volume of the pancreas is the pivotal factor determining the cell mass of the islet cells of the endocrine pancreatic gland (5). In patients with type 2 diabetes mellitus (T2D), residual β-cell mass is inversely correlated with glycated hemoglobin (HbA1c) and hyperglycemia levels at the time of autopsy. Using CT and MRI, smaller sizes and irregular borders of the pancreas are demonstrated in diabetic compared to non-diabetic patients. Increased fat content, fibrosis, and inflammatory changes in the pancreas were also observed in patients with T2D (6). Despite controversial results of different studies, it is claimed that excess fat deposition in the pancreas is associated with insulin resistance; the more pancreatic fat content, the less insulin secretion (6).
On the other hand, considering the autoimmune nature of T1D pathogenesis, investigating the relationship between islet autoimmunity and pancreatic size would be of notable importance for evaluating the potency of measured autoantibody levels in anticipating pancreatic morphologic alterations. The liver, being a collection of insulin-sensitive cells, is particularly susceptible to the harmful impact of oxidative stress resulting from high blood sugar levels (hyperglycemia), potentially resulting in damage to liver tissue. Diabetes mellitus can potentially cause excessive accumulation of fat in the liver, resulting in fatty liver, and sometimes, as a consequence, may lead to non-alcoholic fatty liver disease (NAFLD) (7). The radiologic evaluation of the liver in T1D showed controversial results, with abnormal liver finding rates ranging from 4% to 21%. Although the alterations of the liver and pancreas in T1D are generally outlined, the pattern of involvement in ultrasound is not yet precisely elucidated.
2. Objectives
This study aimed to investigate the size and fat content of the liver and pancreas in children with T1D using ultrasound and to explore their relationship with clinical and laboratory indicators.
3. Patients and Methods
3.1. Case Selection
A total of 86 subjects were recruited for this case-control study conducted at Boo-Ali Hospital, Sari, Mazandaran, Iran. The study included 43 children aged 3 to 18 years with a confirmed diagnosis of T1D who had been followed up at the diabetes clinic from March 2020 until July 2021 as the case group, and 43 non-diabetic children who presented at the hospital with the chief complaint of abdominal pain without a history of metabolic diseases as the control group. The control group had no suspicious manifestations for diabetes, evidenced by: (1) fasting blood sugar (FBS) < 110, postprandial blood sugar < 140, and (2) HbA1c level < 6%.
The age, gender, and Body Mass Index (BMI) of the control group were matched with those of the case group. Participants with other chronic conditions such as cirrhosis, thalassemia, pancreatitis, pancreatic tumors, or cystic fibrosis, as well as those with liver abnormalities unrelated to diabetes, were excluded from the study. The research participants were informed of the study's aims, and only after signing written informed consent were they enrolled in the study. Furthermore, all of Helsinki's ethical requirements were adhered to. The study protocol was approved by the Ethics Committee of Mazandaran University of Medical Sciences with reference code IRMAZUMS.IMAMHOSPITAL.REC.1400.017.
3.2. Diagnostic Criteria
The current diagnostic criteria for diabetes are adapted from the classification and diagnosis guidelines of the American Diabetes Association (ADA) (8). A checklist was used to collect data on age, duration of diabetes, insulin dose, gastrointestinal symptoms, liver disease symptoms, and autoimmune diseases. Symptoms related to liver diseases were asked one by one from patients and their parents. These symptoms included jaundice, dark-colored urine, light-colored stool, digestive difficulties (specifically with fat), excessive weight loss or muscle loss, musty-smelling breath, and evidence of encephalopathy.
Clinic nurses measured height (in centimeters using a height measurement wall sticker) and weight (in kilograms using a digital scale). The results of blood tests, including HbA1c, aminotransferase levels, blood lipid profile, and autoantibodies related to diabetes, were extracted from patients’ files. Laboratory examinations conducted more than one month before the ultrasound study were excluded. Radioimmunoassay (RIA) and enzyme-linked immunosorbent assay (ELISA) were employed to measure anti-glutamic acid decarboxylase 65 levels. Anti-tyrosine phosphatase-like protein (IA-2A), anti-islet cell, and anti-indole-3-acetic acid antibodies were measured by ELISA.
3.3. Ultrasound Study
The ultrasound examination was performed by two expert pediatric radiologists with 8 years and 5 years of experience, respectively, who were blinded to the laboratory results. High-resolution, two-dimensional (2D), B-mode, grayscale, harmonic images obtained by a Mindray Resona I9 ultrasound scanner (Mindray Medical International Limited, Guangdong, China) equipped with a 5 - 7 MHz curved transducer were used for the evaluation of the liver and pancreas. Patients were requested to fast for at least 6 hours to better visualize the pancreas, although liquid consumption was permitted. If the pancreas was not evaluable, the patient was asked to drink 500 mL of water, and the study was reperformed afterward.
The liver was assessed for size, liver margin, parenchymal homogeneity, focal lesions, general parenchymal echogenicity, and periportal structures (echogenicity and diameter), and categorized as normal or abnormal. Pathologic liver ultrasounds were defined as those with aberrant echogenicity or at least two additional abnormal criteria. All liver spans were measured craniocaudally by placing the ultrasound transducer in the midclavicular line. The echogenicity of the liver was evaluated on a four-grade scale: Grade 0: Normal echogenicity; grade I: Slight increase in echogenicity without attenuation of the far fields; grade II: Moderate increase in echogenicity with weak attenuation of the far fields while the diaphragm and hepatic vessels are clearly visible; and grade III: Markedly increased echogenicity with poor visualization of the diaphragm and vessels. Hepatic steatosis or fatty liver was diagnosed if the echogenicity of the liver appeared as grade 1 to 3.
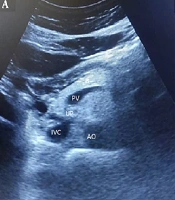
For the pancreas, the anterior-posterior (AP) diameter was measured perpendicular to the long axis of the organ in the head, body, and tail by placing the probe transversely in the epigastrium at the level of the abdominal aorta and inferior vena cava. To improve pancreas visualization, high epigastric sections, trans-gastric sections, and sections using the left liver lobe as an acoustic window were chosen. The left margin of the aorta was used to identify the junction between the body and tail of the pancreas. The superior mesenteric artery and splenic vein served as landmarks for localizing the body of the pancreas, while the splenic vein was the primary landmark for the pancreatic tail (Figure 1). Pancreatic echogenicity was evaluated on a four-grade scale: Grade 0: Similar to renal parenchyma, grade I: Slightly greater than the kidney, grade II: Significant increase in echogenicity but less than retroperitoneal fat, and grade III: Echogenicity similar to or higher than retroperitoneal fat. Pancreatic lipomatosis or fatty pancreas was considered when the pancreas appeared to be grade I to III (9).

A and B, pancreas ultrasound image. Abbreviations: IVC, inferior vena cava; AO, aorta; PV, portal vein; SV, splenic vein; H, head of pancreas; B, body of pancreas; T, tail of pancreas; UP, uncinate process.
3.4. Statistical Analysis
The recorded data were analyzed using SPSS v26 (IBM Corp. Released 2019. IBM SPSS Statistics for Windows, Version 26.0. Armonk, NY: IBM Corp), with a significance level set at less than 0.05. The normal distribution of the data was confirmed by plotting a histogram. Additionally, skewness analysis was employed to examine the asymmetry of the probability distribution, which indicated an almost normal distribution. Quantitative data were recorded as numbers and percentages. A t-test was used to determine the difference between the means of the two groups, and Fisher’s exact test was applied to assess the significance of the association (contingency) between the categorical data. The partial correlation test was used to calculate the degree of association between random variables, with the effect of a set of controlling random variables removed.
4. Results
In the current research, 86 subjects were divided into two groups: Patients with T1D (N = 43) and those without T1D (N = 43) as the case and control groups, respectively. The case group consisted of 20 (46.5%) male subjects, and the control group included 23 (53.5%) male subjects. The mean age (years) and standard deviation of the case and control groups were 11.54 ± 6.12 and 12.61 ± 5.86, respectively (P = 0.12). The mean BMI (kg/m2) and standard deviation of the case and control groups were 21.41 ± 2.62 and 20.83 ± 2.11, respectively (P = 0.23). Laboratory indices, except albumin, including aspartate transferase (AST), alanine transaminase (ALT), and alkaline phosphatase (ALP), showed significant differences between the two groups, as illustrated in Table 1.
| Index | Case | Control | P-value |
|---|---|---|---|
| AST (units/L) | 18.7 ± 3.1 | 23.7 ± 7.1 | < 0.001 |
| ALT (units/L) | 12.6 ± 3.3 | 15.8 ± 5.6 | 0.001 |
| Albumin (g/dL) | 4.4 ± 0.7 | 4.5 ± 1.5 | 0.497 |
| Bilirubin (mg/dL) | 0.28 ± 0.8 | 0.20 ± 0.07 | < 0.001 |
| HbA1c (%) | 4.2 ± 0.1 | 8.4 ± 2.3 | < 0.001 |
| ALP (IU/L) | 520.0 ± 105.4 | 646 ± 134 | < 0.001 |
Comparison of Liver Function Tests and HbA1c in the Case and Control Groups a
Insulin dosage and disease duration values are shown in Table 2. The liver size was 109.51 ± 10.16 mm in the case group and 105.91 ± 17.76 mm in the control group, showing no statistical difference between the two groups. Grade 0 liver was detected in 76.7% (N = 33) of the control group and 34.9% (N = 15) of the case group. The prevalence of fatty liver was notably higher in the case group than in the control group (65.1% vs. 23.3%). The grade of fatty liver was also significantly higher in the case group than in the control group (P < 0.001), as depicted in Table 3. The sole parameter with a significant correlation with the size (mm) of the liver was BMI (P = 0.032). None of the laboratory indices (e.g., AST, ALT) showed a significant correlation with liver size.
| Variables | Mean ± SD | Min-max |
|---|---|---|
| Disease duration(y) | 4.33 ± 2.47 | 1 - 9 |
| Insulin dosage(units) | 0.965 ± 0.393 | 0.3 - 2 |
Disease Duration and Insulin Dosage in Patients with T1D
| Grade of Fatty Liver | Case | Control | P-value |
|---|---|---|---|
| 0 | 15 (34.9) | 33 (76.7) | < 0.001 |
| 1 | 20 (46.5) | 8 (18.6) | |
| 2 | 8 (18.6) | 2 (4.6) |
Comparison of Fatty Liver Grades and Frequencies in the Case and Control Group
A significant difference was observed in the size (mm) of the pancreas body and tail, which was lower in the case group (10.33 ± 2.87 vs. 12.30 ± 2.1, P = 0.004 for the body of the pancreas; 9.47 ± 2.4 vs. 10.86 ± 2.2, P = 0.007 for the tail of the pancreas), as shown in Table 4. The prevalence of fatty pancreas was higher in the case group than in the control group.
| Pancreas size | Case | Control | P-value |
|---|---|---|---|
| Head | 15.4 ± 2.7 | 15.65 ± 2.5 | 0.37 |
| Body | 10.33 ± 2.87 | 12.30 ± 2.1 | 0.004 |
| Tail | 9.47 ± 2.4 | 10.86 ± 2.2 | 0.007 |
Comparison of Pancreas Anteroposterior Diameter in Head, Body, and Tail of Pancreas Measured by Ultrasound in the Case and Control Group
There was no association between the presence of T1D-related autoantibodies and pancreatic size, as illustrated in Table 5. Similarly, no significant correlation was found between the grade of the fatty pancreas and T1D-related autoantibody levels. Additionally, no significant correlation was detected between pancreas size and BMI or age (P = 0.09 for BMI, P = 0.19 for age).
| Autoantibody | Pancreas head size | Pancreas body size | Pancreas tail size | Kendall's Tau-b |
|---|---|---|---|---|
| Anti-glutamic acid decarboxylase 65 | - 0.234 | - 0.148 | - 0.205 | Correlation coefficient |
| 0.051 | 0.220 | 0.09 | P-value | |
| Anti-islet cell | - 0.131 | - 0.157 | - 0.128 | Correlation coefficient |
| 0.250 | 0.171 | 0.266 | P-value | |
| Anti-indole-3-acetic acid | - 0.198 | 0.010 | - 0.165 | Correlation coefficient |
| 0.102 | 0.938 | 0.177 | P-value | |
| Anti-tyrosine phosphatase-like protein (IA-2A) | - 0.098 | 0.111 | - 0.027 | Correlation coefficient |
| 0.409 | 0.352 | 0.822 | P-value |
Correlation Between Type 1 Diabetes Mellitus Autoantibody Levels and Pancreatic Size in Head, Body, and Tail of the Pancreas
Alkaline phosphatase serum level was positively correlated with pancreatic head size (correlation coefficient = 0.264, P = 0.015). Furthermore, serum bilirubin level had a negative correlation with pancreatic body and tail size (correlation coefficient = -0.216, P = 0.047), as seen in Table 6.
| Variables | Pancreas head size | Pancreas body size | Pancreas tail size | Values |
|---|---|---|---|---|
| BMI | 0.211 | 0.181 | 0.162 | Correlation coefficient |
| 0.052 | 0.097 | 0.138 | P-value | |
| FBS | 0.072 | 0.142 | 0.075 | Correlation coefficient |
| 0.511 | 0.195 | 0.497 | P-value | |
| AST | 0.097 | 0.209 | 0.155 | Correlation coefficient |
| 0.375 | 0.054 | 0.157 | P-value | |
| ALT | 0.095 | 0.168 | 0.109 | Correlation coefficient |
| 0.386 | 0.124 | 0.321 | P-value | |
| ALP | 0.264 | 0.138 | 0.114 | Correlation coefficient |
| 0.015 | 0.209 | 0.300 | P-value | |
| Albumin | 0.064 | -0.063 | 0.008 | Correlation coefficient |
| 0.558 | 0.565 | 0.939 | P value | |
| Bilirubin | - 0.087 | - 0.216 | - 0.206 | Correlation coefficient |
| 0.428 | 0.047 | 0.059 | P-value | |
| Hemoglobin A1C | 0.112 | 0.144 | 0.122 | Correlation coefficient |
| 0.306 | 0.187 | 0.268 | P-value |
Correlation Between Liver Function Tests, Body Mass Index (BMI), and Hemoglobin A1C (HbA1c) with Pancreas Size in Head, Body, and Tail of the Pancreas
5. Discussion
In our research, 86 children in two groups with and without T1D were enrolled and underwent liver and pancreas ultrasound examinations to assess alterations in liver and pancreas morphology, as well as their potential relationship with laboratory indices.
The prevalence of liver disease among diabetic patients is estimated to be between 17 and 100 percent, based on previous studies (9). Fatty liver and hepatic glycogenosis are the predominant associated pathologies (10). Most of these data are derived from studies of obese adults with non-insulin-dependent diabetes. Because obesity may be a major cause of liver abnormalities, it is difficult to identify diabetes as a cause of liver disease per se in obese diabetic adults (11, 12). The association between NAFLD and T2D is well elucidated (13). However, recently, there has been a considerable rise in T1D patients with NAFLD, even though studies on this entity are scarce. As such, the prevalence of NAFLD in T1D was subjected to scrutiny. Our results revealed that the prevalence of fatty liver was higher in cases with T1D (65.1% of the T1D group and 23.3% of the control group). According to currently available data, the prevalence of NAFLD in patients with T1D is reported to be approximately equal to the general population (about 20 - 25%) (14). For instance, in a histopathology-based study on adults with diabetes, fatty liver was diagnosed in 17% of patients with T1D (15). Despite this, the incidence of NAFLD in subjects with T1D was three times higher in our study. Although ultrasound was utilized as the diagnostic modality for NAFLD in the present study, other methods such as MRI and biopsy may also be used. Several studies have shown that the rate of NAFLD found by ultrasound is higher than by MRI or biopsy (16). Moreover, previous studies rarely separate children and adults while examining the prevalence of NAFLD in T1D. Pediatric studies of liver disease associated with T1D are mainly limited to case reports of children presenting with symptomatic liver dysfunction during metabolic decompensation and ketosis (17). Hence, the discrepancy in results might be rooted in the fact that all enrolled subjects in our study were children, and all NAFLD diagnoses were established using ultrasound. On the other hand, Targher et al. studied 261 T1D patients, finding NAFLD in 131 patients (50.2%), which aligns with our results (18). Accordingly, the results of different studies are controversial, making it arduous to authenticate whether subjects with T1D are more prone to develop NAFLD. Numerous constraints, especially the diagnostic modality, complicate showing a clear association between these diseases.
Our results showed no statistical difference between the two groups in terms of liver size. Although the prevalence of NAFLD was significantly higher in T1D patients than in the control group, liver span did not indicate a significant difference. In a study by Ahmed et al., the prevalence of hepatomegaly in children with T1D was reported as 26% (19). Al-Hussaini et al. reported hepatomegaly in 9.4% of children examined (17). This prevalence was noticeably lower in a study of 692 children conducted by El-Karaksy et al., which reported about 1.9% (20). This discordance may be attributable to the effective management of blood sugar in our study, as evidenced by HbA1c levels, since hepatomegaly in type 1 diabetes is caused by chronic hyperglycemia. Thus, this suggests dissimilar liver imaging characteristics of NAFLD in the pediatric population with T1D compared to what is expected in general. To the best of our knowledge, no study has conducted a comparative evaluation of NAFLD imaging characteristics based on etiology (e.g., obesity, T1D, T2D). Therefore, future studies focusing on imaging variations in different etiologies of NAFLD can clarify this issue.
The liver enzyme levels in the T1D group were statistically higher than those in the control group, which aligns with the results of other studies (21). Elevated plasma levels of liver enzymes, particularly ALT, indicate hepatocellular damage and are used as a marker for NAFLD (22). It has been reported that the prevalence of elevated ALT in patients with type 1 or type 2 diabetes is about 3 - 4 times higher than in the general population (23). In a study conducted by Leeds et al., 1,874 patients (911 with T1D and 963 with T2D) were enrolled, and the prevalence of elevated ALT in T1D and T2D was 34.5% and 51.4%, respectively (24).
Our results indicate that the size of the pancreatic body and tail in patients with T1D was significantly smaller than in the control group. There is a compelling body of evidence denoting that imaging of the pancreas can demonstrate a reduced pancreas size in T1D (25). The practicality of identifying this reduction in pancreas size should be considered. The absence of insulin action and microstructural abnormalities in the pancreatic gland may be related to atrophic changes (26). Our findings align with earlier research that found a smaller pancreatic AP diameter. However, in our study, pancreatic heads did not show different diameters between the two groups, which was inconsistent with the results of other studies. This might support the hypothesis that pancreatic atrophy begins at the tail and extends proximally as the disease progresses. To confirm this, the duration of the disease should be considered, and the pancreatic head diameter should be assessed concerning the duration of the disease.
Insulinoma-associated antigen-2 autoantibody (IA-2Ab) is found to be the most specific autoantibody, playing an explicit role in beta cell destruction in T1D (27). In a study by Fukui et al., higher titers of IA-2Ab were negatively correlated with pancreas size in patients with T1D (28). They showed that IA-2Ab was the sole autoantibody potentially reflecting pancreas size, although they could not ascertain why only IA-2 Ab titers were associated with reduced pancreas size, while other autoantibodies [e.g., autoantibodies against glutamic acid decarboxylase antibody (GADAb), zinc transporter 8 autoantibody (ZnT8Ab), and insulin] were not. In our study, we did not find the same result, as none of the aforementioned autoantibodies were significantly correlated with pancreas size. This discrepancy might stem from different methods of pancreas size measurement; they used computed tomography (CT) scans, while we used ultrasound. Additionally, they determined the pancreatic volume index (pancreas volume/BMI), which incorporates patients' BMI while studying the association. Comprehensive studies with larger sample sizes and considering other factors (e.g., BMI, antibody measurement method) can better elucidate the potential relationship between insulin autoantibodies and pancreas size.
In our investigation, the fatty pancreas grade was higher in patients with T1D than in the control group. Pancreatic fatty infiltration is similar to visceral fat accumulation and fatty liver, resulting from ectopic fat deposits. An excessive supply of fat, which likely caused these misplaced fat deposits, might be associated with an increase in intracellular fat metabolites and cellular fat infiltration (29). Moreover, this lipid change appears to be related to pancreatic fibrosis and acinar cell damage. Additionally, islet cell inflammation can induce pancreatic fat infiltration and hyperglycemia (30).
Based on our results, ultrasonographic examination of children with T1D can be profitable for the early demonstration of pancreatic morphological alterations, especially given that pancreatic volume changes can affect exocrine gland function during disease progression. Hence, we assume that detecting decreased pancreas size and increased echogenicity can potentially be a valuable radiologic surrogate for pancreatic exocrine dysfunction, which needs further investigation through prospective studies focusing on the exocrine function of the pancreas gland. Thus, understanding pancreas morphological changes may provide new insights into the prognostication and management of T1D.
We faced limitations while conducting the study: This was a single-center study, and selection bias was inevitable. Due to the influential role of insulin in the pathogenesis of diabetes, serum levels of this marker were not studied, so it is not possible to determine how the fat amounts and the volume of the liver and pancreas are related to insulin levels. The gold standard for NAFLD is liver biopsy, which is not usually performed in the pediatric population and was not accessible to us. The amount of visceral fat could also have been considered, which is suggested for incorporation in future studies.
In conclusion, pediatric patients with T1D are more susceptible to NAFLD according to ultrasound findings. Furthermore, pancreatic morphological alterations, including increased echogenicity and a decrease in the size of the pancreas (prominent at the body and tail), can be detected in ultrasound studies of children with T1D. There was no significant correlation found between T1D autoantibodies and pancreatic morphological changes, suggesting that autoantibodies are not a reliable method for anticipating impending pancreatic morphologic changes.
