1. Background
Acute appendicitis, with an overall global incidence of approximately 100 cases per 100,000 adults, is the most common reason for emergency surgery (1, 2). Although the clinical diagnosis of appendicitis is typically straightforward in patients presenting with classic signs and symptoms, various conditions (e.g., gynecologic, renal, and colonic diseases) may complicate the diagnosis, leading to treatment delays or unnecessary procedures (3-5). Over the last decade, computed tomography (CT) has been increasingly used to diagnose appendicitis due to its widespread availability, standardized technique, rapid data acquisition, and potential for differential diagnosis (6). Clinicians and radiologists primarily use the appendix diameter as a key parameter for assessing appendicitis, with a threshold of 6 mm. This value was originally derived from graded compression sonography of the right lower quadrant (RLQ) of the abdomen; however, CT images are acquired without compression (7-9). Evidence suggests that over 20% of patients without appendicitis have an appendix diameter greater than 7 mm, making the 6 mm threshold unreliable in the absence of corroborative CT findings (9, 10). Therefore, a comprehensive, multiparameter imaging evaluation of the appendix is essential for accurate diagnosis. This study aimed to identify key factors for predicting appendicitis from contrast-enhanced CT images obtained through multiplanar reconstruction.
2. Objectives
The main objective of this study was to identify key factors for predicting appendicitis from contrast-enhanced coronal and sagittal CT images obtained through multiplanar reconstruction.
3. Patients and Methods
3.1. Study Cohort
This retrospective cross-sectional study was approved by the institutional review board of our hospital. The board waived the requirement for informed consent due to the retrospective nature of the study and the use of deidentified patient data. Between July 2019 and September 2020, 185 consecutive patients presented to our emergency department (ED) with RLQ pain and underwent contrast-enhanced CT. For patients diagnosed with appendicitis, pathology confirmation after appendectomy was required. Patients who presented with typical imaging features of appendicitis but were treated with antibiotic therapy were excluded. Those who had a negative appendectomy or RLQ pain but were diagnosed with a different condition were included in the alternative diagnosis group. Medical records were monitored for 1 month to confirm the absence of any ED or outpatient department revisits, ensuring there was no misdiagnosis in the alternative diagnosis group. Patients who were discharged against medical advice or had a history of appendectomy were excluded from the study.
3.2. Imaging Modality
Computed tomography imaging was performed using the Aquilion 64 scanner (Toshiba Medical Systems, Otawara, Japan). No enteric contrast medium was administered; however, 100 mL of an intravenous contrast medium (iohexol; 350 mg iodine/mL; Omnipaque 350; GE Healthcare, Princeton, NJ, USA) was administered at a rate of 2 mL/s. Portal venous phase imaging was conducted 70 seconds after the contrast medium injection. The CT parameters were as follows: 120 kVp with automatic tube current modulation. For analysis, all images were reconstructed with a 5 mm thickness at 5 mm intervals, and coronal and sagittal images were obtained through multiplanar reconstruction.
3.3. Data Collection and Analysis
All data were reviewed by two abdominal radiologists (JYC and YCW, with 5 and 25 years of experience, respectively) who were blinded to the diagnosis. Patient identifiers, including numbers and names, were removed and replaced with random numbers serving as virtual identifiers. Only members of the research team had access to patient data and images. A standardized questionnaire was used to assess imaging parameters such as appendix diameter, wall thickness, abnormal appendix enhancement, abnormal appendix content, appendix erection, and periappendiceal fat stranding, without revealing the CT scan diagnosis. The final values for appendix diameter and wall thickness were the averages of the two radiologists’ measurements. For the other parameters, the final values were determined based on consensus between the radiologists (in cases of discrepancies).
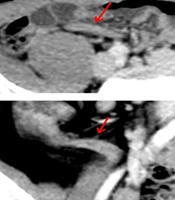
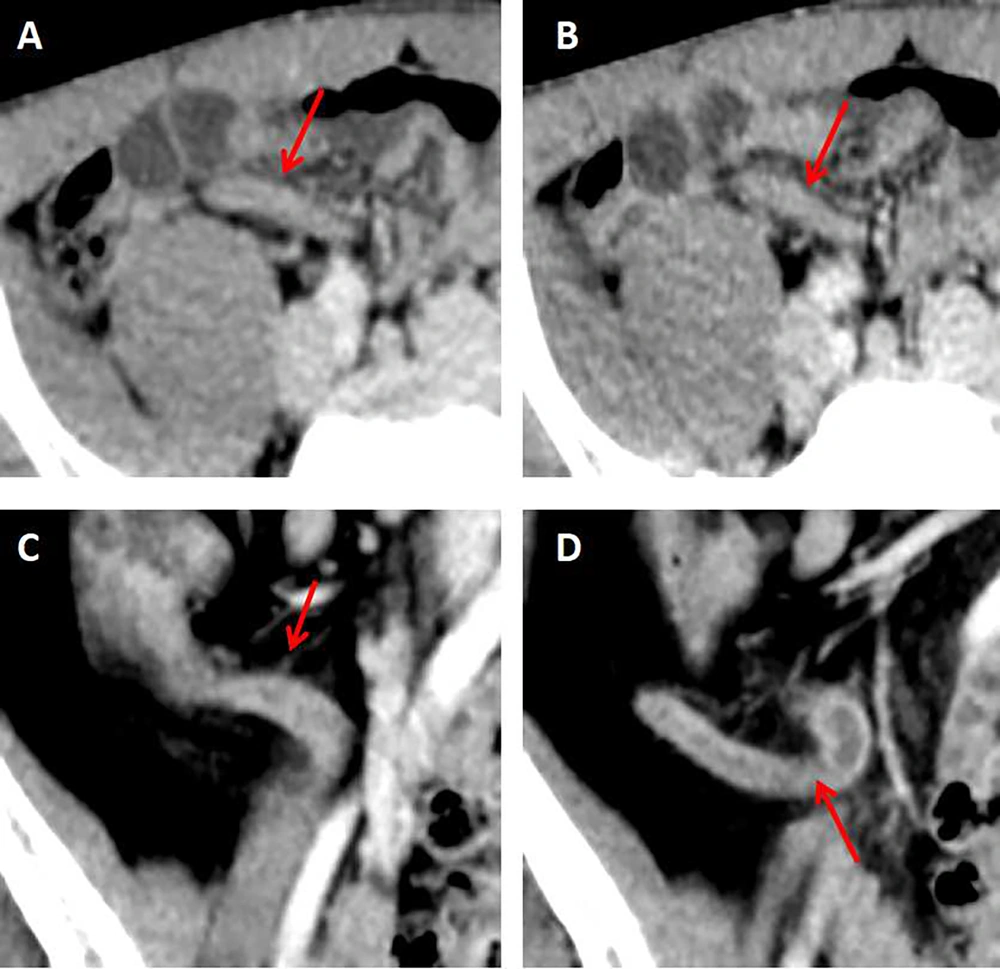
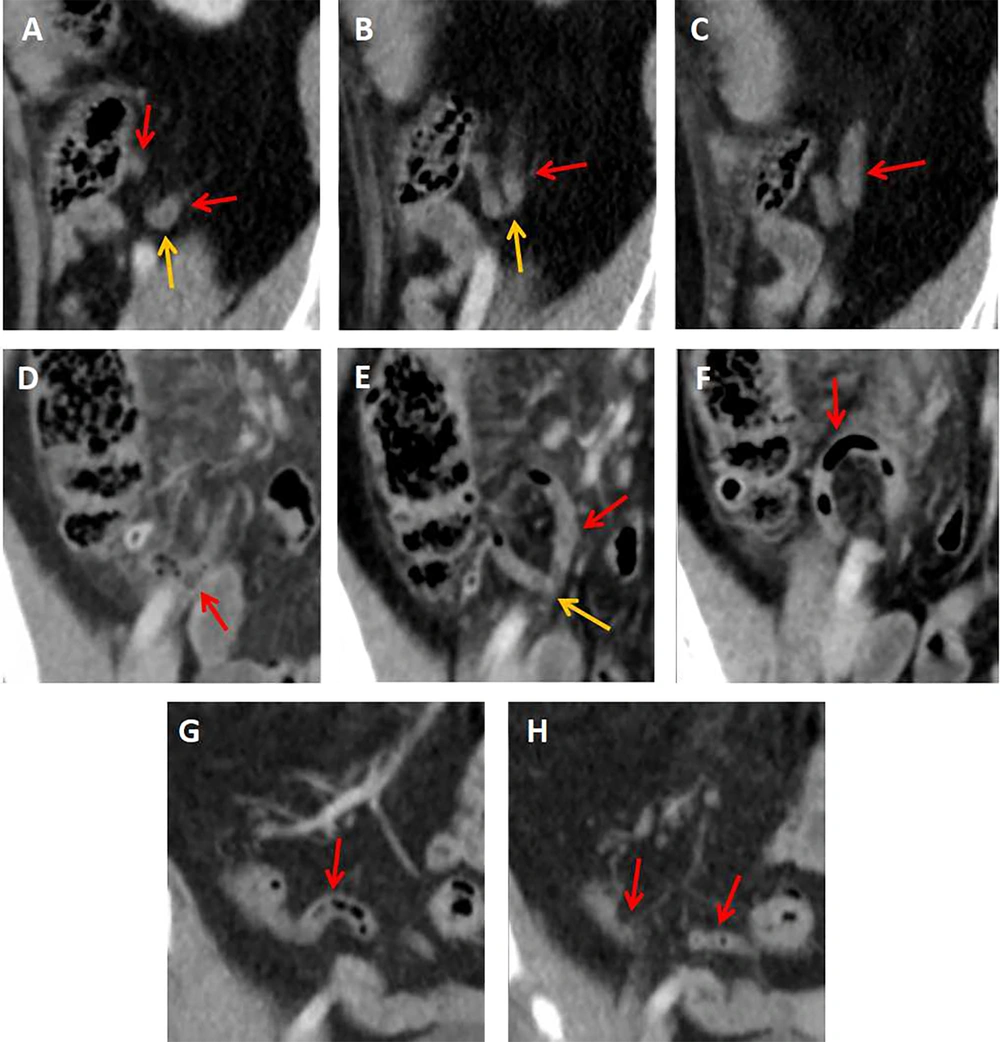
Abnormal appendix enhancement was defined as a difference in enhancement between the appendix and the cecal or ileal wall. Abnormal appendix content was defined as the presence of intraluminal fluid (Figure 1) or appendicoliths, rather than intraluminal air, within the appendix. Appendix erection was defined as the presence of an I-shaped or C-shaped appendix rather than a V-shaped, O-shaped, or S-shaped flaccid appendix on axial, sagittal, and coronal CT images. An I-shaped appendix was characterized by a straight or nearly straight appearance, while a C-shaped appendix was characterized by a curved, bow-like appearance (Figure 1). A V-shaped appendix had an acute angle at its turn, an O-shaped appendix appeared with the tip close to the opening, resembling a "kissing" posture, and an S-shaped appendix had a biconcave appearance (Figure 2).
Image appearance of an erected appendix: A and B, a 21-year-old male patient with appendicitis. Post contrast computed tomography (CT) on axial view showed an erected “I shape” appendix (red arrows). The appendix diameter was 6.6 mm. Note also the appendix had abnormal wall enhancement and filled with fluid; C and D, a 62-year-old male patient with appendicitis. Post contrast CT on coronal view showed an erected “C shape” appendix (red arrows) with abnormal wall enhancement and intraluminal fluid. Appendix diameter was 8 mm.
Image appearance of a flaccid appendix: A, B, and C, a 53-year-old male patient with right lower quadrant (RLQ) pain. Post contrast computed tomography (CT) on sagittal view showed a “V shape” appendix (red arrows) distinguished from a “C shape” appendix by an acute angle turn (yellow arrows in A and B). The appendix diameter was 7.8 mm. The patient was diagnosed with right ureterovesicle junction (UVJ) stone. D, E, and F, an “O shape” appendix (red arrows) with mesentery fat stranding in RLQ of abdomen on post contrast CT coronal view in a patient with RLQ pain. The appendix tip “kissing” the opening of the appendix (yellow arrow in E) with a diameter of 7 mm. The patient was diagnosed with ascending colon diverticulitis instead of appendicitis. G and H, a 42-years-old male patient visited our ED due to RLQ pain with final diagnosis of enteritis. Post contrast CT on coronal view showed a bi-curved “S shape” appendix (red arrows). The appendix diameter was 7.2 mm.
3.4. Statistical Analysis
All data were analyzed using SPSS (IBM Corp. Released 2013. IBM SPSS Statistics for Windows, Version 22.0. Armonk, NY: IBM Corp.). Intraclass correlation coefficients were used to assess interobserver agreement for appendix diameter and wall thickness. Cohen’s kappa coefficient was used to evaluate interobserver agreement regarding abnormal appendix enhancement, abnormal appendix content, appendix erection, and periappendiceal fat stranding. Categorical variables were presented as frequencies and percentages, while continuous variables with a normal distribution were presented as mean and standard deviation (SD) values. Continuous variables with a non-normal distribution were presented as median and interquartile range (IQR) values.
Categorical variables were analyzed using the chi-square or Fisher exact test, and continuous variables were analyzed using the independent-sample t-test or Mann-Whitney U test, as appropriate. A P-value of < 0.05 was considered statistically significant. The optimal thresholds for appendix diameter and wall thickness were determined using the maximum Youden index values, which were derived from the corresponding receiver operating characteristic (ROC) curves. Variables with a P-value < 0.1 in the univariate analysis were included in a backward stepwise multivariate logistic regression model to identify significant independent factors for predicting appendicitis.
4. Results
4.1. Patient Characteristics
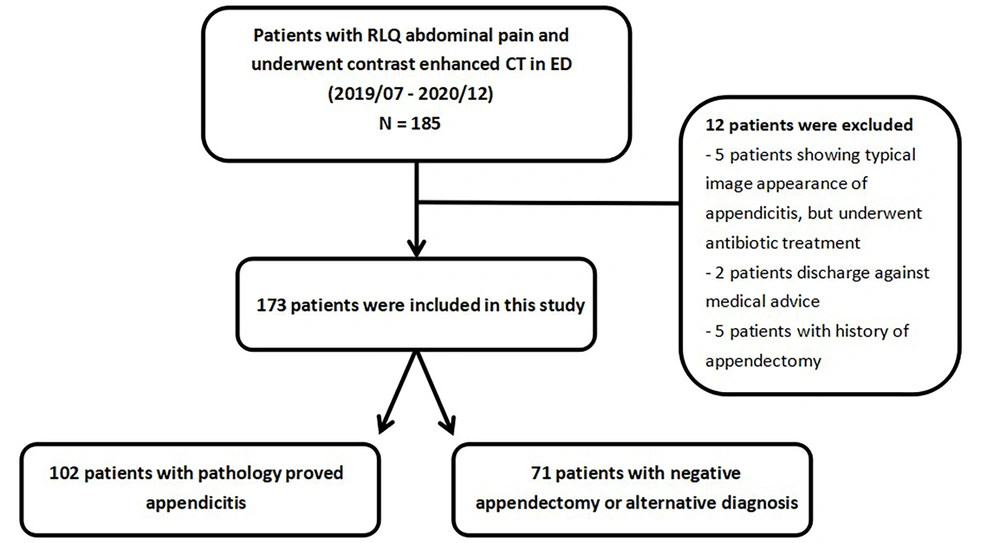
Between July 2019 and September 2020, 185 patients visited our hospital. Of these, 12 patients were excluded for the following reasons: Five patients presented with typical imaging features of appendicitis but received antibiotic treatment, 5 had a history of appendectomy, and 2 were discharged against medical advice. Ultimately, this study included 173 patients [median age: 37 years (IQR: 27 to 54)]. Of these, 102 received a pathologically confirmed diagnosis of appendicitis, and 71 were diagnosed with an alternative condition or had a negative appendectomy (n = 6). None of the patients with alternative diagnoses revisited our hospital’s ED or outpatient department within 1 month of their initial presentation (Figure 3).
The median age of the appendicitis group was 43.4 years, which included 54 male patients (53%). The mean age of the alternative diagnosis group was 38.8 years, which included 33 male patients (46.5%). No significant differences were observed between the two groups in terms of age or sex. However, significant differences were noted in leukocytosis (> 10,000/mL; P = 0.001) and leukocyte left shift (> 75%; P < 0.001), but not in body temperature (P = 0.279) or C-reactive protein level (P = .196).
4.2. Image Characteristics
The interobserver intraclass correlation coefficients for appendix diameter and wall thickness were 0.915 and 0.756, respectively. Cohen’s kappa coefficients for abnormal appendix enhancement, abnormal appendix content, appendix erection, and periappendiceal fat stranding were 0.766, 0.657, 0.833, and 0.835, respectively. The overall incidence of appendicitis among patients presenting to our ED with right RLQ pain was 59% (102/173).
The mean diameter of the appendix was significantly greater in the appendicitis group compared to the alternative diagnosis group (11.9 ± 3.5 mm vs 6.6 ± 1.4 mm, respectively; P < 0.001). Similarly, the median appendix wall thickness was significantly higher in the appendicitis group than in the alternative diagnosis group (3.1 [IQR: 2.3 to 3.8] mm vs 1.7 [IQR: 1.5 to 2.3] mm, respectively; P < 0.001). Univariate analysis identified the following significant (P < 0.001) predictors of appendicitis: Abnormal appendix enhancement, abnormal appendix content, appendix erection, and periappendiceal fat stranding (Table 1).
| Characteristics | Appendicitis (n = 102) | Alternative diagnosis (n = 71) | P-value |
|---|---|---|---|
| Age, median (IQR) | 34 (27 - 49) | 39 (29 - 56) | 0.09 |
| Gender; male | 54/102 (52.9) | 33/71 (46.5) | 0.403 |
| Body temperature (℃) | 36.7 (36.2 - 37.3) | 36 (36.2 - 37.5) | 0.279 |
| Leukocytosis (> 10000/uL) | 72/102 (70) | 33/71 (46) | 0.001 |
| Leukocyte left shift (> 75%) | 80/102 (78) | 32/71 (45) | < 0.001 |
| C-reactive protein level (mg/L) | 19.6 (3.0 - 67.3) | 27.4 (6.1 - 122.8) | 0.196 |
| Surgical time (min) | 142 (77 - 300) | 90 (70 - 120) | 0.03 |
| Appendix diameter (mm) | 11.9 ± 3.5 | 6.6 ± 1.4 | < 0.001 |
| Appendix wall thickness (mm) | 1.7 (1.5 - 2.3) | 3.1(2.3 - 3.8) | < 0.001 |
| Abnormal wall enhancement | 89/102 (87) | 10/71 (11) | < 0.001 |
| Abnormal intraluminal content | 96/102 (93) | 29/71 (33) | < 0.001 |
| Erection of appendix | 89/102 (87) | 13/71 (18) | < 0.001 |
| Peri-appendiceal fat stranding | 92/102 (90) | 25/71 (35) | < 0.001 |
| Appendix diameter ≥ 7.7 mm | 93/102 (91.1) | 10/71 (14) | < 0.001 |
| Appendix wall thickness ≥ 2 mm | 90/102 (88.2) | 30/71 (42.2) | < 0.001 |
Abbreviations: SD, standard deviation; IQR, interquartile range.
a Values are expressed as No. (%), mean ± SD or median (IQR).
The area under the ROC curve values for appendix diameter and wall thickness were 0.940 and 0.855, respectively. The Youden index indicated that an appendix diameter threshold of 7.7 mm achieved sensitivity and specificity values of 91% and 82%, respectively. In contrast, an appendix diameter threshold of 6 mm achieved sensitivity and specificity values of 99% and 36%, respectively. For appendix wall thickness, a threshold of 2 mm yielded sensitivity and specificity values of 86% and 65%, respectively (Table 2).
| Variables | AUC (95 % CI) | Sensitivity (%) | Specificity (%) | Cut off value (mm) |
|---|---|---|---|---|
| Appendix diameter | 0.940 | 99.0 | 36.2 | 6 |
| 91.2 | 85.9 | 7.7 | ||
| Appendix thickness | 0.855 | 86.3 | 64.8 | 2 |
Abbreviations: AUC, area under curve; CI, confidence interval.
4.3. Significant Predictive Factors for Appendicitis
After adjusting for covariates, the multivariate logistic regression identified the following independent predictors of appendicitis (Table 3): Appendix diameter greater than 7.7 mm [odds ratio (OR): 15.3; 95% confidence interval (CI): 4.8 to 47.6; P < 0.001], abnormal appendix enhancement (OR: 12.5; 95% CI: 3.7 to 41.7; P < 0.001), and appendix erection (OR: 6.1; 95% CI: 1.9 to 20.8; P = 0.004).
| Variables | Odds ratio (95% CI) | P-value |
|---|---|---|
| Appendix diameter ≥ 7.5mm | 15.3 (4.8 - 47.6) | < 0.001 |
| Abnormal appendix wall enhancement | 12.5 (3.7 - 41.7) | < 0.001 |
| Erection of appendix | 6.1 (1.9 - 20.8) | 0.004 |
Abbreviation: CI, confidence interval.
5. Discussion
Acute appendicitis is a common cause of abdominal pain, a leading reason for emergency abdominal surgery, and a frequent condition associated with lawsuits against emergency physicians or radiologists (8). Despite extensive discussion over the years and the use of clinical scoring systems, diagnosing acute appendicitis remains challenging. Approximately 60% of patients with uncomplicated appendicitis can be treated successfully with antibiotics (11, 12). However, appendectomy remains the definitive treatment for acute appendicitis as it provides a single-session resolution and allows for pathological confirmation when the diagnosis is uncertain (13). This underscores the importance of ensuring an accurate diagnosis to avoid unnecessary surgery.
With advancements in imaging technology, significant improvements have been made in CT image acquisition time, image resolution, and multiplanar reconstruction, enabling CT imaging to offer crucial insights for patients suspected of having appendicitis (14). Currently, intravenous administration of contrast media is recommended to enhance diagnostic accuracy, except in specific clinical scenarios (15, 16). As a result, imaging studies continue to play a vital role in preventing misdiagnosis (17, 18). Although several imaging parameters are used to diagnose appendicitis, the disease presentation on imaging is not always straightforward (19, 20).
Appendicitis is believed to result from outlet obstruction caused by appendicoliths, lymphoid hyperplasia, or other factors, leading to inflammation of the appendix wall and fluid accumulation within the appendix. As the disease progresses, increased luminal pressure causes small vessel thrombosis, resulting in bacterial proliferation and tissue ischemia (13). These pathological changes are reflected in CT images. Although the appearance of appendicitis on CT may vary among patients, several key imaging parameters can aid in diagnosis, including appendix diameter, wall thickness, and periappendiceal fat stranding (21-23). Other important parameters include the presence of fluid or air within the appendix and abnormal enhancement of the appendix wall (24-26).
Various thresholds have been proposed for appendix diameter and wall thickness (9, 27). The current appendix diameter threshold of 6 mm is based on measurements obtained through graded compression sonography of the RLQ of the abdomen; however, CT images are acquired without compression (7). Although measuring appendix diameter is straightforward, it can be influenced by factors such as body mass index and sex. One study reported that over 20% of patients without appendicitis had an appendix diameter greater than 7 mm (10). Another study indicated that the appendix diameter exceeds 6 mm in more than 42% of healthy individuals (9). These findings are consistent with those of our study, where the mean appendix diameter in the alternative diagnosis group was 6.6 mm, and 35% of patients in this group had an appendix diameter greater than 7 mm. Setting the threshold at 6 mm resulted in a sensitivity of 99%, but a specificity of only 36%. Consequently, the 6-mm threshold may not be suitable for diagnosis, and relying solely on appendix diameter could increase the rate of negative appendectomies. Therefore, multiple imaging parameters should be assessed to avoid unnecessary treatments.
In our study, an appendix diameter threshold of 7.7 mm achieved sensitivity and specificity values of 91% and 86%, respectively. We identified the following significant predictors of appendicitis: Appendix diameter greater than 7.7 mm, abnormal appendix enhancement, and appendix erection. Abnormal appendix enhancement and changes in appendix diameter have been previously discussed in the literature, as these parameters reflect different clinical stages of appendicitis. Early inflammation may manifest as hyperemia, whereas late-stage disease may present as ischemic changes and gradual fluid accumulation.
Our evaluation of appendix shapes using CT images obtained through multiplanar reconstruction revealed that, in addition to abnormal appendix enhancement and diameter, appendix erection was a significant predictor of appendicitis (P < 0.004). By analyzing sonographic data, Rettenbacher et al. identified an association between appendix shape and appendicitis, indicating that appendix shape assessment can aid in ruling out the condition (28). However, previous studies have mostly relied on transverse section examinations of the appendix rather than its complete shape. The approach proposed in the current study is more comprehensive, as the accumulation of fluids within the appendix may cause gradual distension, leading to alterations in both appendix diameter and shape on imaging. Through sequential image analysis and multiplanar reconstruction, we could accurately delineate the exact shape of the appendix. Few studies have investigated the correlation between appendix shape and appendicitis using CT images obtained through multiplanar reconstruction, making our findings particularly valuable.
This study has several limitations. First, the single-center, retrospective cross-sectional design might have introduced selection bias, particularly given the low rate of negative appendectomies at our institution. Second, although abdominal pain, particularly RLQ pain, is the primary complaint in patients with acute appendicitis, we excluded patients with atypical symptoms, potentially missing cases where appendicitis presented with uncommon symptoms. Third, although measurements were conducted by experienced radiologists, the possibility of interobserver variability affecting diagnostic consistency cannot be overlooked. Finally, we excluded patients with a history of appendectomy, meaning conditions such as stump appendicitis were not considered in this study.
Although appendix diameter is often the initial parameter considered in the diagnosis of appendicitis (29), our findings suggest that the traditional threshold of 6 mm may not be adequate for CT imaging-based evaluations. Evidence shows that patients without appendicitis can present with a wide range of appendix diameters (9, 10, 30). Therefore, additional imaging parameters should be considered to avoid unnecessary surgeries and improper treatments.
In conclusion, an appendix diameter greater than 7.7 mm, abnormal appendix enhancement, and appendix erection appear to be significant independent predictors of appendicitis in patients presenting with RLQ pain.


