


1. Background
Thyroid-associated ocular diseases (TAOD) are autoimmune-related conditions that predominantly affect the internal structures of the orbit, leading to abnormal enlargement of ocular muscles and adipose tissues (1). Within the spectrum of TAOD, two notable disorders are thyroid eye disease (TED) and Graves’ ophthalmopathy, which often result in significant morbidity, including diplopia, proptosis, visual impairment, and even blindness. Accurately assessing the severity and progression of TAOD is crucial for disease management and treatment decisions. The TAOD can be categorized into active and inactive stages, with glucocorticoids and immunosuppressants proving effective during the active stage, while orbital radiation therapy and surgical interventions are employed during the inactive stage (2). Consequently, accurately determining disease activity is critical for selecting appropriate treatment strategies. Previous clinical assessments have heavily relied on subjective clinical activity scores (CASs), which have been shown to be highly subjective and less accurate (3).
The differentiation of orbital adipose tissue is a key process in the development and progression of TAOD, as an increase in adipose tissue leads to clinical symptoms such as proptosis (4). Medical imaging, particularly magnetic resonance imaging (MRI), has become an essential tool in diagnosing and treating TAOD. The MRI provides detailed anatomical information and quantitative assessments of orbital adipose tissue and muscle lesions, as well as their impact on proptosis (5, 6). Nevertheless, the progression of TAOD often involves changes in adipose tissue and muscles, posing challenges for qualitative analysis using T1- and T2-weighted imaging (T2WI). Specifically, T1-weighted imaging may not provide sufficient contrast to differentiate between inflamed and normal tissues, while T2WI can be limited by its inability to accurately quantify fat and water content, making it difficult to distinguish between tissue types and assess inflammation and edema.
Recent advancements in MRI techniques, such as the Dixon technique and T2 localization imaging, offer improved differentiation and quantification of fat and water content in different tissue types (7-9). The Dixon technique enhances the visualization and characterization of orbital tissues by differentiating between fat and water content, while T2 localization imaging facilitates the assessment of tissue edema, inflammation, and fibrosis. These techniques have shown promise in assessing the severity and progression of various diseases, including TAOD.
2. Objectives
Despite the potential utility of Dixon and T2 localization techniques, their application in evaluating the severity and progression of TAOD has been limited. The present study aimed to evaluate the technical feasibility and reliability of the Dixon and T2 localization techniques in TAOD by assessing image quality, reproducibility, and the time required for image acquisition and analysis. The clinical utility will be determined by comparing results with conventional clinical evaluations to assess accuracy in identifying active versus inactive disease stages, sensitivity and specificity in detecting changes in adipose tissue and muscle lesions, and correlation with CASs and other conventional metrics.
The study will assess the ability of these techniques to accurately evaluate TAOD severity and progression by analyzing quantitative measures of fat and water content in orbital tissues, changes in T2 relaxation times, and longitudinal changes in imaging parameters over time. These assessments will be conducted in a single-center setting to ensure standardized protocols and consistent data collection. By achieving these objectives, we aim to provide a more robust and objective method for assessing TAOD, thereby improving disease management and treatment decisions.
3. Patients and Methods
3.1. Inclusion and Exclusion Criteria
Inclusion criteria encompassed patients diagnosed with TAOD who had a history of thyroid dysfunction confirmed by abnormal serum levels of thyroid-stimulating hormone (TSH), free thyroxine (FT4), and/or free triiodothyronine (FT3), and showed extraocular muscle (EOM) thickening, defined as an axial muscle diameter greater than 5 mm on MRI in at least two EOMs. Additionally, complete clinical data needed to be available. Exclusion criteria included the presence of ocular proptosis symptoms unrelated to thyroid-related eye diseases as observed through computed tomography (CT) or MRI scans. Patients who had previously received immunosuppressive or radiation therapy were also excluded. Furthermore, individuals with non-thyroid-related eye diseases that could cause exophthalmos, such as myopia, Cushing’s syndrome, orbital pseudotumor, obesity, orbital cellulitis, idiopathic myositis, rhabdomyoma, orbital lymphoma, and meningioma, were excluded.
A formal sample size calculation was performed to ensure adequate statistical power for detecting differences in MRI-derived parameters between active and inactive disease stages. Based on prior studies, we anticipated a moderate effect size (Cohen’s d = 0.5) for key parameters such as EOM water fraction and T2 values. Using G*Power software (version 3.1), we calculated that a minimum sample size of 64 participants (32 per group) would be required to achieve 80% power at a significance level of 5% (α = 0.05).
3.2. Grouping Criteria
A retrospective cohort analysis was performed on the clinical data of 78 patients with TAOD who were admitted to our hospital between January and December 2021. Patients were followed up for a period of 6 months to 1 year to assess disease progression. This study was approved by the Ethics Committee of Affiliated Lishui Hospital of Zhejiang University (approval no. 21-07-EC). Signed written informed consents were obtained from the patients and/or guardians.
The CASs were assessed for all patients using the CAS. The CAS evaluates symptom severity, frequency of symptoms, physical examination findings, and laboratory test results, providing a comprehensive measure of disease activity. Each patient’s score was calculated based on specific criteria, including spontaneous retroorbital pain, pain during eye movement, conjunctival congestion, eyelid edema, conjunctival redness, conjunctival swelling, and eyelid swelling. A score of 1 was assigned to patients meeting at least one criterion, and a CAS ≥ 3 indicated the active stage.
Based on the CAS, these patients were divided into two groups: An active group (n = 30) and an inactive group (n = 48). Furthermore, a disease progression group (n = 20) was defined by a CAS increase of at least 2 points from baseline or the emergence of new signs/symptoms indicating disease worsening, such as increased proptosis, worsened diplopia, or new-onset compressive optic neuropathy. Patients not meeting these criteria were categorized as the non-progressors group (n = 58).
Treatment during the active stage involved the use of glucocorticoids and immunosuppressants, while orbital radiation therapy and surgical interventions were chosen for the inactive stage. This retrospective cohort study analyzed medical records and imaging data from patients with TAOD, including a 6-month to 1-year follow-up to assess disease progression and correlate imaging changes with clinical outcomes. Patients who transitioned from the inactive stage to the active stage were considered to have disease progression.
To ensure the comparability of baseline characteristics between the active and inactive groups, as well as between the progression and non-progression groups, we conducted a comparative analysis of key demographic and clinical variables. Any significant differences identified were controlled for in subsequent analyses to minimize potential confounding effects.
3.3. Methods of Examination
All patients underwent MRI using the Siemens 3.0T Spectra MRI system with a head coil. The MRI was indicated for patients with suspected or confirmed TED to evaluate orbital involvement, especially in cases with clinical signs and symptoms such as proptosis, diplopia, and eyelid retraction, for preoperative assessment before surgery, to monitor response to medical treatments like corticosteroids or immunosuppressive therapy, and to evaluate disease activity and progression over time. Transverse plane scans of the orbits were acquired using both Dixon and conventional T2WI techniques. The transverse scans were positioned parallel to the line connecting the external auditory meatus and the lateral canthus.
The parameters for Dixon imaging were as follows: Repetition time (TR) of 430 ms, echo time (TE) of 11 ms, voxel size of 0.3 mm × 0.3 mm × 3.0 mm, and a flip angle of 160 degrees. For T2WI, the parameters were as follows: Repetition time of 6000 ms, TE of 100 ms, voxel size of 0.3 mm × 0.3 mm × 3.0 mm, and a flip angle of 150 degrees. The scanning range was determined to ensure magnetic field homogeneity.
The maximum cross-sectional areas of the EOMs were measured on axial T2-weighted images, with regions of interest (ROIs) standardized to 5 mm to ensure consistency. The maximum level was defined as the slice with the largest muscle diameter at the mid-portion of the muscle belly. This measurement was taken to assess the degree of muscle enlargement and inflammation, which are indicative of disease activity. The lacrimal gland and orbital fat were manually delineated as ROIs, and signal intensities were recorded. The size of each ROI was standardized to 5 mm to ensure consistency across all measurements and was placed on each EOM using the Dixon data to measure water-fat separation.
To ensure consistency, the following steps were followed: Identify the axial slice with the largest muscle diameter, use the ROI tool in the image analysis software to trace the muscle outline, measure the cross-sectional area within the ROI, and record the measurement for each muscle and patient. For a visual representation (Figure 1). Water signal intensity and fat signal intensity were obtained from the water and fat phase images, respectively. Measurements were repeated three times for each ROI, and the average values were used for analysis. The water fraction was calculated using the formula: Water fraction = water signal intensity/(water signal intensity + fat signal intensity). The average water fraction, average water signal intensity, and average fat signal intensity of the EOMs were measured and calculated. The maximum level of the lacrimal gland was identified, and the entire layer of the lacrimal gland was manually delineated as the ROI. The average signal intensity of the lacrimal gland was recorded.
")
Cross-sectional measurement of extraocular muscles (EOMs)
Using T2 mapping software (ADW4.4 workstation), color-coded T2 maps were generated with a single exponential curve fit. The T2 relaxation time (in milliseconds) and area (in square millimeters) of the four EOMs (superior, inferior, medial, and lateral rectus muscles) in both eyes were measured, as well as the mean fat fraction in the four EOMs in a single orbit. The average T2 value of the EOMs was calculated as the average of the T2 values of the inferior rectus, medial rectus, lateral rectus, superior rectus, and superior oblique muscles in both eyes. The average cross-sectional area of the EOMs was calculated as the average of the cross-sectional areas of the inferior rectus, medial rectus, lateral rectus, superior rectus, and superior oblique muscles in both eyes.
To minimize bias in the MRI image analysis, all measurements were performed by a trained radiologist who was blinded to the clinical data and disease stage of the patients. The radiologist was provided only with anonymized MRI images, and the analysis was conducted independently of any clinical information.
3.4. Statistical Analysis
Statistical analysis of the data was conducted using the statistical package for the social sciences (SPSS) version 25.0 software (IBM Corp. Released 2017. IBM SPSS Statistics for Windows, Version 25.0. Armonk, NY: IBM Corp.). Prior to conducting parametric tests, the normality of continuous variables was assessed using the Shapiro-Wilk test. Categorical variables were expressed as [No. (%)] and assessed using the chi-square test, while continuous variables were reported as mean ± standard deviation (x̄ ± s) and analyzed using the t-test.
Receiver operating characteristic (ROC) curve analysis was conducted to identify optimal threshold values for key MRI-derived parameters — specifically, EOM water fraction, T2 relaxation times, and lacrimal gland signal intensity. The cut-off points were determined by maximizing Youden’s Index to achieve the best balance between sensitivity and specificity. The area under the curve (AUC), along with 95% confidence intervals (CIs), was calculated using the DeLong method, providing a robust statistical assessment of diagnostic performance.
Diagnostic accuracy was evaluated using the CAS ≥ 3 as the reference standard for active disease. The following indices were derived: Sensitivity = TP/(TP + FN), reflecting the test’s ability to correctly identify active cases. Specificity = TN/(TN + FP), indicating its ability to correctly exclude inactive cases. Positive predictive value (PPV) and negative predictive value (NPV) were also calculated to assess the probability of true disease presence or absence based on MRI findings. Correlation analysis used Spearman’s rank correlation. Logistic regression models adjusted for confounders (age, sex, disease duration). All tests were two-tailed with α = 0.05 defining statistical significance. A P-value below 0.05 (P < 0.05) was considered to indicate statistical significance. Logistic regression models were used to adjust for potential confounders, including age, sex, and disease duration.
4. Results
4.1. Comparison of General Characteristics Between the Active and Inactive Groups, and Progression and Non-progression Groups
A total of 78 patients were enrolled in the study. The general characteristics of the active and inactive groups, as well as the progression and non-progression groups, were compared and are presented in Tables 1 and 2. Apart from the Thyroid Function Index and CAS, no significant differences were observed in general characteristics such as gender (40.00% vs. 60.00% vs. 39.58% vs. 60.42%), age (35.80 ± 5.52 years vs. 36.22 ± 5.60 years), and duration of illness (6.12 ± 1.04 months vs. 6.12 ± 1.04 months) between the active and inactive groups (χ2/t = 0.001, 0.361, 0.886, P > 0.05). Similarly, no significant differences were found in gender (40.00% vs. 60.00% vs. 42.00% vs. 58.00%), age (35.80 ± 5.52 years vs. 36.22 ± 5.60 years), and duration of illness (6.04 ± 1.02 months vs. 6.10 ± 1.14 months) between the progression and non-progression groups (χ2/t = 0.024, 0.285, 0.205, P > 0.05), indicating comparability between the groups.
| Groups | No. | Gender (No. %) | Age (y) | Disease duration (mon) | TSH (mIU/L) | FT4 (pmol/L) | FT3 (pmol/L) | CAS (points) | |
|---|---|---|---|---|---|---|---|---|---|
| Man | Woman | ||||||||
| Active group | 30 | 12 (40.00) | 18 (60.00) | 36.42 ± 5.38 | 6.12 ± 1.04 | 12.95 ± 1.85 | 14.82 ± 2.30 | 12.46 ± 1.14 | 2.56 ± 0.40 |
| Inactive group | 48 | 19 (39.58) | 29 (60.42) | 35.98 ± 5.15 | 6.35 ± 1.16 | 10.64 ± 1.76 | 11.70 ± 2.25 | 10.20 ± 1.25 | 1.12 ± 0.22 |
| χ2/t | - | 0.001 | 0.361 | 0.886 | 5.530 | 5.908 | 3.627 | 20.512 | - |
| P-value | - | 0.971 | 0.719 | 0.379 | 0.001 | 0.001 | 0.001 | 0.001 | - |
Abbreviations: TSH, thyroid-stimulating hormone; FT4, free thyroxine; FT3, free triiodothyronine; CAS, clinical activity score.
a Values are expressed as No. (%) or mean ± SD.
| Groups | No. | Gender (No. %) | Age (y) | Disease duration (mon) | TSH (mIU/L) | FT4 (pmol/L) | FT3 (pmol/L) | CAS (points) | |
|---|---|---|---|---|---|---|---|---|---|
| Man | Woman | ||||||||
| Progression group | 20 | 8 (40.00) | 12 (60.00) | 35.80 ± 5.52 | 6.04 ± 1.02 | 13.35 ± 2.16 | 15.75 ± 1.96 | 13.38 ± 1.44 | 2.70 ± 0.25 |
| Non-progression group | 50 | 21 (42.00) | 29 (58.00) | 36.22 ± 5.60 | 6.10 ± 1.14 | 11.64 ± 2.28 | 12.32 ± 2.02 | 11.56 ± 1.40 | 1.56 ± 0.20 |
| χ2/t | - | 0.024 | 0.285 | 0.205 | 2.876 | 6.471 | 4.874 | 20.028 | - |
| P-value | - | 0.878 | 0.777 | 0.838 | 0.005 | 0.001 | 0.001 | 0.001 | - |
Abbreviations: TSH, thyroid-stimulating hormone; FT4, free thyroxine; FT3, free triiodothyronine; CAS, clinical activity score.
a Values are expressed as No. (%) or mean ± SD.
4.2. Comparison of Measurement Parameters Between the Active and Inactive Groups, and Progression and Non-progression Groups Using Dixon and T2 Localization
To evaluate the feasibility of Dixon and T2 localization for assessing disease severity and progression, this study examined the measurement parameters of both active and inactive groups, as illustrated in Figures 2 and 3. Tables 3 and 4 present the results. The active group demonstrated significantly higher average EOM water fraction (0.98 ± 0.25 vs. 0.80 ± 0.16), average EOM water signal intensity (398.96 ± 102.45 vs. 326.70 ± 80.46), average EOM fat signal intensity (96.32 ± 12.15 vs. 78.90 ± 10.48), average lacrimal gland signal intensity (79.52 ± 10.24 vs. 68.60 ± 10.12), average of unilateral four EOM fat fractions (67.20 ± 8.82 vs. 50.45 ± 7.60), average EOM T2 value (79.45 ± 7.42 vs. 75.60 ± 6.80), and average EOM cross-sectional area (50.48 ± 7.22 vs. 39.60 ± 6.40) compared to the inactive group. These differences were statistically significant (t = 3.883, 3.469, 6.715, 4.616, 8.899, 2.349, 6.952, P < 0.05).
 of an active phase patient. A, Axial T1-weighted MRI shows the most distinct visualization of the enlarged extraocular muscles (EOMs) during the active phase; B, Axial T2-weighted MRI highlights the same EOMs; C, Coronal T2-weighted MRI shows the most distinct visualization of the enlarged EOMs during the progression phase; D, Sagittal T2-weighted MRI highlights the same EOMs.")
T1/T2-weighted magnetic resonance imaging (MRI) of an active phase patient. A, Axial T1-weighted MRI shows the most distinct visualization of the enlarged extraocular muscles (EOMs) during the active phase; B, Axial T2-weighted MRI highlights the same EOMs; C, Coronal T2-weighted MRI shows the most distinct visualization of the enlarged EOMs during the progression phase; D, Sagittal T2-weighted MRI highlights the same EOMs.
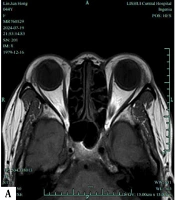
 of an inactive phase patient. A, Axial T1-weighted MRI shows the most distinct visualization of the enlarged extraocular muscles (EOMs) during the inactive phase; B, Axial T2-weighted MRI highlights the same EOMs; C, Coronal T2-weighted MRI shows the most distinct visualization of the enlarged EOMs during the progression phase; D, Sagittal T2-weighted MRI highlights the same EOMs.")
T1/T2-weighted magnetic resonance imaging (MRI) of an inactive phase patient. A, Axial T1-weighted MRI shows the most distinct visualization of the enlarged extraocular muscles (EOMs) during the inactive phase; B, Axial T2-weighted MRI highlights the same EOMs; C, Coronal T2-weighted MRI shows the most distinct visualization of the enlarged EOMs during the progression phase; D, Sagittal T2-weighted MRI highlights the same EOMs.
| Groups | No. | Average EOM water fraction | Average EOM water signal intensity | Average EOM fat signal intensity | Average lacrimal gland signal intensity | Average of unilateral four EOM fat fractions | Average EOM T2 value (ms) | Average EOM cross-sectional area (mm2) |
|---|---|---|---|---|---|---|---|---|
| Active group | 30 | 0.98 ± 0.25 | 398.96 ± 102.45 | 96.32 ± 12.15 | 79.52 ± 10.24 | 67.20 ± 8.82 | 79.45 ± 7.42 | 50.48 ± 7.22 |
| Inactive group | 48 | 0.80 ± 0.16 | 326.70 ± 80.46 | 78.90 ± 10.48 | 68.60 ± 10.12 | 50.45 ± 7.60 | 75.60 ± 6.80 | 39.60 ± 6.40 |
| t | - | 3.883 | 3.469 | 6.715 | 4.615 | 8.899 | 2.349 | 6.952 |
| P-value | - | 0.001 | 0.001 | 0.001 | 0.001 | 0.001 | 0.021 | 0.001 |
Abbreviation: EOM, extraocular muscle.
a Values are expressed as mean ± SD.
| Groups | No. | Average EOM water fraction | Average EOM water signal intensity | Average EOM fat signal intensity | Average lacrimal gland signal intensity | Average of unilateral four eom fat fractions | Average EOM T2 value (ms) | Average EOM cross-sectional area (mm2) |
|---|---|---|---|---|---|---|---|---|
| Progression group | 20 | 0.96 ± 0.18 | 409.55 ± 115.72 | 104.20 ± 13.88 | 89.62 ± 11.32 | 69.96 ± 9.15 | 81.75 ± 8.32 | 54.65 ± 7.88 |
| Non-progression group | 50 | 0.82 ± 0.15 | 330.86 ± 105.96 | 80.26 ± 9.96 | 79.38 ± 10.25 | 51.80 ± 7.90 | 76.90 ± 7.14 | 42.50 ± 6.98 |
| t | - | 3.711 | 2.734 | 8.858 | 4.123 | 9.290 | 2.738 | 7.116 |
| P-value | - | 0.001 | 0.008 | 0.001 | 0.001 | 0.001 | 0.008 | 0.001 |
Abbreviation: EOM, extraocular muscle.
a Values are expressed as mean ± SD.
Likewise, as illustrated in Figure 4, the progression group exhibited significantly higher average EOM water fraction (0.96 ± 0.18 vs. 0.82 ± 0.15), average EOM water signal intensity (409.55 ± 115.72 vs. 330.86 ± 105.96), average EOM fat signal intensity (104.20 ± 13.88 vs. 80.26 ± 9.96), average lacrimal gland signal intensity (89.62 ± 11.32 vs. 79.38 ± 10.25), average of unilateral four EOM fat fractions (69.96 ± 9.15 vs. 51.80 ± 7.90), average EOM T2 value (81.75 ± 8.32 vs. 76.90 ± 7.14), and average EOM cross-sectional area (54.65 ± 7.88 vs. 42.50 ± 6.98) compared to the non-progression group. These differences were statistically significant (t = 3.711, 2.734, 8.858, 4.123, 9.290, 2.738, 7.116, P < 0.05).
 of a progression phase. A, Axial T1-weighted MRI shows the most distinct visualization of the enlarged extraocular muscles (EOMs) during the progression phase; B, Axial T2-weighted MRI highlights the same EOMs")
Axial T1/T2-weighted magnetic resonance imaging (MRI) of a progression phase. A, Axial T1-weighted MRI shows the most distinct visualization of the enlarged extraocular muscles (EOMs) during the progression phase; B, Axial T2-weighted MRI highlights the same EOMs
4.3. Comparison of Involvement Between the Active and Inactive Groups, and the Progression and Non-progression Groups by Dixon and T2 Localization
To further assess the utility of Dixon and T2 localization in evaluating disease severity and progression, this study analyzed the involvement observed in the Dixon and T2 localization of both groups. The results are presented in Tables 5 and 6. In the active group, there was a higher proportion of involvement in orbital fat tissue (90.00% vs. 41.67%), EOMs (86.67% vs. 37.50%), and lacrimal gland (83.33% vs. 33.33%) compared to the inactive group. These differences were statistically significant (χ2 = 18.009, 18.150, 22.284, P < 0.05). Similarly, in the progression group, there was a higher proportion of involvement in orbital fat tissue (95.00% vs. 52.00%), EOMs (90.00% vs. 46.00%), and lacrimal gland (90.00% vs. 40.00%) compared to the non-progression group. These differences were statistically significant (χ2 = 11.505, 11.398, 14.391, P < 0.05).
| Groups | No. | Involvement in orbital fat tissue | Involvement in EOMs | Involvement in lacrimal gland |
|---|---|---|---|---|
| Active group | 30 | 27 (90.00) | 26 (86.67) | 25 (83.33) |
| Inactive group | 48 | 20 (41.67) | 18 (37.50) | 16 (33.33) |
| χ2 | - | 18.009 | 18.150 | 22.284 |
| P-value | - | 0.001 | 0.001 | 0.001 |
Abbreviation: EOM, extraocular muscle.
a Values are expressed as No. (%).
| Groups | No. | Involvement in orbital fat tissue | Involvement in EOMs | Involvement in lacrimal gland |
|---|---|---|---|---|
| Progression group | 20 | 19 (95.00) | 18 (90.00) | 18 (90.00) |
| Non-progression Group | 50 | 26 (52.00) | 23 (46.00) | 20 (40.00) |
| χ2 | - | 11.505 | 11.398 | 14.391 |
| P-value | - | 0.001 | 0.001 | 0.001 |
Abbreviation: EOM, extraocular muscle.
a Values are expressed as No. (%).
4.4. Correlation Analysis Between Thyroid-Related Eye Disease Severity and Dixon and T2 Localization Measurement Indices
To further examine the relationship between the severity of thyroid-related eye diseases and the Dixon and T2 localization measurement indices, this study conducted a correlation analysis between the CAS and the Dixon and T2 localization measurement indices. The results are summarized in Table 7. The analysis revealed a positive correlation between the CAS and the following measurement indices: Average EOM water fraction, average EOM water signal intensity, average EOM fat signal intensity, average lacrimal gland signal intensity, mean of unilateral orbital fat fraction for the four EOMs, average EOM T2 value, and average EOM cross-sectional area (r = 0.456, 0.510, 0.502, 0.624, 0.598, 0.565, 0.612, P < 0.05).
| Indices | CAS | |
|---|---|---|
| r | P-value | |
| Average EOM water fraction | 0.456 | 0.024 |
| Average EOM water signal intensity | 0.510 | 0.013 |
| Average EOM fat signal intensity | 0.502 | 0.015 |
| Average lacrimal gland signal intensity | 0.624 | 0.001 |
| Mean of unilateral orbital fat fraction for the four EOMs | 0.598 | 0.004 |
| Average EOM t2 value | 0.565 | 0.009 |
| Average EOM cross-sectional area | 0.612 | 0.001 |
Abbreviations: CAS, clinical activity score; EOM, extraocular muscle.
To evaluate the diagnostic performance of the MRI-based Dixon and T2 techniques, we calculated sensitivity, specificity, PPV, and NPV using the CAS as the reference standard. A CAS score ≥ 3 was used to define the active disease stage, while a CAS score < 3 indicated the inactive stage. The results are summarized in Table 8.
| Parameters | Cut-off | AUC (95%CI) | Sensitivity (%) | Specificity (%) | PPV (%) | NPV (%) |
|---|---|---|---|---|---|---|
| Average EOM water fraction | 0.92 | 0.82 (0.75 - 0.88) | 85.7 (76.5 - 93.2) | 82.4 (70.4 - 86.3) | 80.0 (64.0 - 82.2) | 87.5 (81.2 - 94.5) |
| Average EOM t2 value | 67.2 | 0.78 (0.71 - 0.85) | 78.6 (69.6 - 88.3) | 76.5 (63.4 - 80.2) | 73.3 (57.8 - 77.3) | 81.3 (74.6 - 90.3) |
| Average lacrimal gland signal intensity | 1.38 | 0.75 (0.67 - 0.82) | 89.3 (67.1 - 90.2) | 88.2 (71.3 - 92.1) | 86.2 (61.7 - 88.2) | 90.9 (73.4 - 92.3) |
Abbreviations: AUC, area under curve; PPV, positive predictive value; NPV, negative predictive value; EOM, extraocular muscle.
5. Discussion
Thyroid-related eye disease is a prevalent orbital condition that primarily affects adults. Despite its common occurrence, the exact mechanism of its development remains uncertain (10). Clinical manifestations of the disease include proptosis (eye bulging), eyelid retraction or lagophthalmos, foreign body sensation, impaired eye movement, diplopia (double vision), strabismus, photophobia, and tearing, significantly impacting patients’ quality of life (11). Based on disease severity, patients can be classified into active and inactive stages. Non-active patients show poor response to drug treatment, while active patients benefit from corticosteroid therapy, which shortens the active stage and improves clinical symptoms (12). Traditionally, the staging of thyroid-associated ophthalmopathy relies on the subjective ophthalmic CAS, lacking precise quantitative indicators for orbital involvement (13, 14). However, Rui et al. (15) have demonstrated the higher sensitivity, specificity, and accuracy of MRI compared to the CAS in determining the active stage. This highlights MRI as an important imaging tool for evaluating thyroid-associated ophthalmopathy. Nevertheless, limited clinical research exists on the use of MRI to assess the severity and progression of the disease.
Dixon and T2 measurements offer a quantitative assessment of fat and water content in the orbit, thereby aiding the evaluation of patients with thyroid-associated ophthalmopathy (16, 17). Additionally, Wen et al. (18) found a correlation between worsening thyroid-associated ophthalmopathy and increased orbital fat tissue, supporting the findings of our study. Furthermore, Liu et al. (19) utilized Dixon water-fat separation technology to provide quantitative data on water and fat composition in the EOMs of TED patients, though they did not analyze quantitative indicators related to the lacrimal gland, which we have done in our study.
Our results demonstrate that in the active stage group compared to the non-active stage group (P < 0.05), various parameters including average water fraction, average water signal intensity, average fat signal intensity of EOMs, average signal intensity of the lacrimal gland, mean fat fraction of the four EOMs on one side of the orbit, average T2 value of EOMs, average cross-sectional area of EOMs, proportion of orbital fat tissue involvement, proportion of EOM involvement, and proportion of lacrimal gland involvement exhibited higher values. Similarly, in the progressive stage group compared to the non-progressive stage group (P < 0.05), the same parameters were higher. These findings suggest that combining Dixon and T2 localization techniques can aid in clinically assessing the severity and progression of thyroid-associated ophthalmopathy.
The analysis reveals that during the exacerbation and progression of thyroid-associated ophthalmopathy, there is pronounced obstruction of drainage due to the infiltration of inflammatory cells, accumulation of glycosaminoglycans and hyaluronic acid, and periorbital muscle edema. Consequently, there is a significant accumulation of water and tissue swelling, resulting in more distinct changes in water content within the orbit detected through Dixon and T2 localization (20, 21). Additionally, as the condition worsens or progresses, there is a later stage of inflammatory infiltrates, accompanied by an increase in mature fat cells within the EOMs, leading to noticeable changes in fat composition data (22, 23).
Moreover, there is a positive correlation (P < 0.05) between the CAS and parameters such as average water fraction, average water signal intensity, average fat signal intensity of EOMs, average signal intensity of the lacrimal gland, mean fat fraction of the four EOMs on one side of the orbit, average T2 value of EOMs, and average cross-sectional area of EOMs. This further confirms the feasibility of utilizing Dixon and T2 localization techniques in evaluating the severity and progression of TED.
The inclusion of diagnostic accuracy metrics, such as sensitivity, specificity, PPV, and NPV, further supports the clinical utility of the MRI-based Dixon and T2 techniques. The high sensitivity and specificity observed for key parameters, particularly the average lacrimal gland signal intensity (sensitivity: 89.3%, specificity: 88.2%), suggest that these techniques can reliably differentiate between active and inactive disease stages. Compared to other methods, Dixon and T2 localization techniques offer advantages by providing quantitative data on fat and water content, which enhances understanding of disease progression. Unlike traditional MRI, which focuses on anatomy, these techniques offer objective and reproducible measurements, reducing inter-observer variability. However, clinical scoring systems like NOSPECS are cost-effective and widely available, though they may lack the precision needed for early detection and monitoring of subtle changes.
In summary, Dixon and T2 localization techniques have demonstrated high feasibility in assessing the severity and progression of thyroid-associated ophthalmopathy. Quantitative parameters such as fat and water content within the orbit, and the involvement of orbital fat tissue, EOMs, and the lacrimal gland, can serve as reference indicators for evaluating disease severity and progression. Nonetheless, there are limitations in our study, including a small sample size, lack of long-term follow-up studies, and absence of analysis on predictive accuracy, sensitivity, specificity, and other relevant indicators. These metrics are fundamental for assessing the clinical utility of imaging techniques, as they directly impact the reliability and effectiveness of diagnoses and prognoses.
The practical implications of these findings are significant for clinical settings. For instance, the ability to quantitatively assess orbital changes can aid in the early diagnosis and tailored treatment plans for patients with thyroid-associated ophthalmopathy. Additionally, these techniques could be integrated into routine clinical practice to monitor disease progression and response to therapy more effectively.
Future research should focus on conducting longitudinal studies to track disease progression and long-term treatment efficacy; analyzing the predictive accuracy, sensitivity, and specificity of Dixon and T2 localization techniques; and integrating these techniques into routine clinical practice to better monitor disease and treatment response. Addressing these areas will enhance the clinical utility of these techniques and improve patient outcomes.
