


1. Background
In the field of modern pediatric intensive care medicine, mechanical ventilation is widely used in the Pediatric Intensive Care Unit (PICU) as a key means to save the lives of critically ill children. However, accurately determining the timing of weaning during the use of mechanical ventilation has always been a major challenge for clinicians (1). Improper timing of weaning not only increases the risk of ventilator-associated lung injury, ventilator-associated diaphragm dysfunction (VIDD), and other complications in children, but also prolongs hospital stay, increases the family's economic burden, and can even endanger the life of the child (2, 3).
Currently, many methods are used to predict the success of weaning in children, but they all have varying degrees of defects. Taking the shallow Rapid Respiratory Index (RSBI) as an example, it is a commonly used composite parameter to predict the outcome of weaning, calculated as the ratio of respiratory rate (RR) to tidal volume (Vt). Theoretically, a higher RSBI value indicates weaker inspiratory muscle capacity. However, RSBI evaluates all inspiratory muscles. When the diaphragm, the main respiratory muscle, is impaired, auxiliary respiratory muscles such as abdominal muscles and intercostal muscles can maintain the tidal volume in the normal range through compensatory increases for a certain period, thus masking the impact of diaphragm dysfunction on tidal volume (4). This compensatory mechanism causes the specificity of RSBI to fluctuate greatly in predicting the success of weaning, leading to an unstable threshold and limited clinical application. In addition to RSBI, other single predictors also struggle to fully reflect the complex pathophysiological factors behind weaning failure. This leaves clinicians without a sufficiently reliable basis for weaning decisions, often relying on experience and a variety of indicators for comprehensive judgment, increasing the uncertainty of the weaning decision.
The diaphragm, as a critical component of the human respiratory pump, contributes to approximately 70% of lung ventilation volume during normal respiratory activities (5). In this context, this study focused on the application of ultrasound to assess diaphragm function in the weaning of mechanically ventilated children. With its advantages of simple operation, non-invasiveness, and bedside performance, ultrasound has gained increasing attention in the field of diaphragm function evaluation in recent years. Diaphragmatic displacement (DE), end-inspiratory diaphragmatic thickness (Tei), end-expiratory diaphragmatic thickness (Tee), diaphragmatic thickening fraction (DTF), and other parameters were measured by ultrasound, and the diaphragmatic displacement-shallow rapid breathing index (DE-RSBI) and diaphragmatic thickening fractional shallow rapid breathing index (DTF-RSBI) were innovatively constructed (6). These are expected to more accurately assess diaphragm function and overcome the limitations of traditional indicators.
This study aims to fill the current knowledge gap in predicting the accuracy of weaning results in children with mechanical ventilation and provide strong support for clinicians to make scientific and accurate weaning decisions, which has important practical significance and clinical value for improving the prognosis of children and reducing the incidence of complications.
2. Objectives
This study aims to assess the prognostic value of diaphragmatic ultrasound parameters in predicting successful weaning outcomes in pediatric patients undergoing MV, compared to healthy controls.
3. Patients and Methods
3.1. Research Design Type
This study was a retrospective case-control study.
3.2. Sample Size Calculation
The main index of this study was DE. Based on a literature review, the expected DE difference between the successful and failed withdrawal groups was 2 mm, with a standard deviation of 1.5 mm, resulting in an effect size (Cohen's d) of 1.33. G*Power software was used to calculate the sample size, setting the significance level (α) at 0.05 and the statistical power (1-β) at 0.8. Using a two-independent sample t-test, it was calculated that approximately 15 samples were required in each group. Considering potential loss to follow-up and missing data, the sample size for each group was finally determined to be at least 20 cases. Consequently, the total sample size included was 60 cases, according to the actual situation.
3.3. Sampling Method
In this study, 60 children admitted to our hospital's PICU for concurrent mechanical ventilation from January 2023 to December 2023 were selected using the random number table method as the observation group, referred to as the mechanical ventilation (MV) group. The specific steps were as follows: First, all eligible children were assigned a unique number. Then, 60 non-repetitive random numbers were generated using a computer random number generator. Finally, the corresponding children were selected for inclusion in the study according to these random numbers.
3.4. Clinical Data
The MV group included 36 boys and 24 girls, with ages ranging from 1.0 to 6.4 years (mean ± SD, 2.45 ± 1.25 years) and a BMI of 17.56 ± 2.35 kg/m2. For comparison, 40 healthy children who visited our hospital for routine health examinations during the same period were selected as the control group, consisting of 25 boys and 15 girls, with ages ranging from 2.0 to 8.2 years (mean ± SD, 3.45 ± 1.87 years) and a BMI of 18.11 ± 2.56 kg/m2. No significant statistical differences were observed in age, gender, or BMI between the two groups. Inclusion criteria were as follows: (1) age ≤ 14 years; (2) having received MV for > 24 hours; and (3) meeting the criteria for extubation and undergoing a spontaneous breathing trial (SBT). Exclusion criteria were as follows: (1) age ≥ 14 years; (2) MV duration < 24 hours; (3) congenital anomalies such as thoracic deformities affecting respiratory mechanics; (4) diaphragmatic paralysis; and (5) damage to the respiratory center.
3.5. Study Methods
3.5.1. Spontaneous Breathing Trial (SBT)
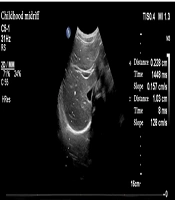
Pediatric intensive care unit physicians assessed the patients daily. An SBT was conducted when the following criteria were met (7): (1) improvement in the child’s underlying disease; (2) stable oxygenation status, with an oxygenation index (PaO2/FiO2) ≥ 200 mmHg; (3) positive end-expiratory pressure (PEEP) ≤ 5 cmH2O; (4) intact airway reflexes; RSBI ≤ 105 breaths/(min·L); and (5) stability of hemodynamics even after cessation of sedatives and vasopressors. Following the cessation of MV, a pressure support ventilation mode was used, with observation continuing for at least 30 minutes. If the patient could not tolerate the SBT, the previous MV support settings were reinstated. Grouping: Based on the weaning outcomes, patients in the MV group were categorized into either the successful weaning group or the failed weaning group. Success was defined as maintaining spontaneous breathing for more than 48 hours after ventilator support was discontinued, while failure was defined as the need to resume MV or death within 48 hours of extubation. Ultrasonography: Diaphragmatic ultrasound was performed in all children by the same chief physician in the Color ultrasound department. A PHILIPS CX50 ultrasound diagnostic device was utilized, equipped with a C5 - 1 low-frequency convex array probe and an L12 - 3 high-frequency linear array probe, with frequencies of 1 - 5 MHz and 3 - 12 MHz, respectively. Ultrasonography was performed 30 minutes after passing the SBT. The DEwas measured by positioning the 1 - 5 MHz low-frequency convex array probe at the right mid-clavicular line and below the right costal margin, where the diaphragm appeared as a high-echo line overlying the liver. Initially, B-mode was used to identify the point of maximum diaphragmatic displacement, followed by M-mode sampling perpendicular to this point. The diaphragm’s movement during respiration produced a sinusoidal displacement curve, with the distance between the highest and lowest points representing the DE. The average DE value was calculated over three calm respiratory cycles (Figure 1).
 was placed under the right clavicular midline and costal margin, with the liver as the acoustic window; measurement method: The B-mode was used to determine where the diaphragm displacement was the largest, and the M-mode was switched. The sampling line was perpendicular to the diaphragm, and the displacement curve of the diaphragm with breathing was recorded; figure meaning: The highest point of the curve represents the position of the diaphragm at the end of inspiration, the lowest point represents the position of the diaphragm at the end of expiratory breath, and the distance between the two is the diaphragm excursion.")
Measurement of diaphragm excursion; probe position: The low frequency convex array probe (1 - 5 MHz) was placed under the right clavicular midline and costal margin, with the liver as the acoustic window; measurement method: The B-mode was used to determine where the diaphragm displacement was the largest, and the M-mode was switched. The sampling line was perpendicular to the diaphragm, and the displacement curve of the diaphragm with breathing was recorded; figure meaning: The highest point of the curve represents the position of the diaphragm at the end of inspiration, the lowest point represents the position of the diaphragm at the end of expiratory breath, and the distance between the two is the diaphragm excursion.
Diaphragm thickness (DT) was measured by placing the 3 - 12 MHz high-frequency linear array probe between the right mid-axillary line and the 8th to 10th ribs, using the liver as an acoustic window to obtain a high-low-high triple-layer echo structure. The two high-echo lines represented the parietal pleura and the peritoneal line, respectively, with the low-echo line between them representing the diaphragm. The diaphragm’s thickness increased during inhalation and decreased during exhalation. The M-mode was then used to sample the diaphragm’s thickness perpendicular to it, obtaining a curve of diaphragmatic thickness variation. The thickness at the Tee represented the diaphragm’s minimum thickness during the respiratory cycle, while the Tei represented its maximum thickness. The DTF was calculated as the percentage change in diaphragmatic thickness between inhalation and exhalation, DTF = (Tei - Tee) / Tee × 100%. The average value was calculated over three average respiratory cycles (Figure 2). The DE-RSBI was calculated as RR/DE; the DTF-RSBI was calculated as RR/DTF.
 was placed in the area between the right midaxillary line and the 8 - 10 ribs, with the liver as the sound window; measurement methods: The B-type mode was used to obtain the high-low-three-layer echo structure of the diaphragm, and the M-type mode was switched. The sampling line was perpendicular to the diaphragm, and the curve of the thickness of the diaphragm with breathing was recorded; figure meaning: The two high echo lines represent the parietal pleural line and the peritoneal line respectively, and the low echo area in the middle is the diaphragm. The end expiratory thickness (Tee) was the minimum diaphragm thickness, and the end inspiratory thickness (Tei) was the maximum diaphragm thickness.")
Measurement of diaphragm thickness; probe position: The high-frequency linear array probe (3 - 12 MHz) was placed in the area between the right midaxillary line and the 8 - 10 ribs, with the liver as the sound window; measurement methods: The B-type mode was used to obtain the high-low-three-layer echo structure of the diaphragm, and the M-type mode was switched. The sampling line was perpendicular to the diaphragm, and the curve of the thickness of the diaphragm with breathing was recorded; figure meaning: The two high echo lines represent the parietal pleural line and the peritoneal line respectively, and the low echo area in the middle is the diaphragm. The end expiratory thickness (Tee) was the minimum diaphragm thickness, and the end inspiratory thickness (Tei) was the maximum diaphragm thickness.
3.6. Statistical Analysis
SPSS 25.0 software was used for statistical analysis (IBM Corp. Released 2017. IBM SPSS Statistics for Windows, Version 25.0. Armonk, NY: IBM Corp.). All quantitative data were tested for normality and homogeneity of variance. Continuous variables with a normal distribution were expressed as Mean ± SD, and a two-independent samples t-test was used for comparison between groups. Continuous variables with non-normal distributions were expressed as Median and interquartile ranges (Median, IQR), and the Mann-Whitney U test was used for comparison between groups. Qualitative data were expressed as frequency and rate, and the χ² test was used for comparison between groups. For continuous variables (e.g., diaphragm displacement, diaphragm thickening score), Cohen's d was used to measure the effect size. For categorical variables, the Odds Ratio (OR) was used to measure the strength of the association between the predictors and the withdrawal results. Using the final withdrawal results of PICU children as the gold standard, the receiver operating characteristic curve (ROC) was plotted, the area under the curve (AUC) and 95% confidence interval (CI) were obtained, and the sensitivity and specificity of each parameter were determined. A P-value of < 0.05 indicated that the difference was statistically significant.
4. Results
4.1. Comparison of Diaphragmatic Parameters Between the Control Group and the Mechanical Ventilation Group
There were no significant differences in age, sex, and BMI between the MV group and the control group (P > 0.05). The DE, Tei, Tee, and DTF in the MV group were significantly lower than those in the control group (P < 0.05) (Table 1).
| Ultrasound Parameters | Normal Control Group (n = 40) | MV Group (n = 60) | t/χ2 | P-Value |
|---|---|---|---|---|
| Age | 3.45 ± 1.87 | 2.45 ± 1.25 | -1.56 | > 0.05 |
| Gender (male/female) | 25/15 | 35/25 | 0.56 | > 0.05 |
| BMI (kg/m2) | 18.11 ± 2.56 | 17.56 ± 2.35 | -1.02 | > 0.05 |
| DE (mm) | 12.12 ± 1.82 | 10.24 ± 2.98 | 5.342 | < 0.05 |
| Tei (mm) | 2.32 ± 0.15 | 1.67 ± 2.23 | 8.856 | < 0.05 |
| Tee (mm) | 1.71 ± 0.14 | 1.29 ± 0.16 | 6.342 | < 0.05 |
| DTF (%) | 33.21 ± 2.34 | 26.57 ± 6.89 | 4.537 | < 0.05 |
| DE-RSB [breaths/(min.mm)] | 1.78 (1.34, 2.26) | 2.89 (2.34, 3.65) | 5.648 | < 0.05 |
| DTF-RSBI (breaths/min) | 64.34 (61.23, 72.24) | 89.13 (76.86, 113.56) | 5.753 | < 0.05 |
Abbreviations: MV, mechanical ventilation; BMI, Body Mass Index; DE, diaphragm excursion; Tei, diaphragmatic end-inspiratory thickness; Tee, diaphragmatic end-expiratory thickness; DTF, diaphragm thickening fraction; DE-RSBI, diaphragm excursion-rapid shallow breathing index; DTF-RSBI, diaphragm thickening fraction-rapid shallow breathing index.
a Values expressed as mean ± SD, median (25th percentile, 75th percentile) or number.
4.2. Comparison of General Data Between the Successful and Failed Weaning Groups
No statistically significant differences were observed in general data and reasons for MV between the successful and failed weaning groups (all P > 0.05). The duration of MV and total hospital stay were significantly longer in the failed weaning group compared to the successful weaning group (P < 0.05) (Table 2).
| General Data | Successful Weaning Group (n = 39) | Failed Weaning Group (n = 21) | χ2/t/F | P-Value |
|---|---|---|---|---|
| Age | 1.58 (0.75, 5.92) | 2.33 (0.41, 6.58) | 0.145 | > 0.05 |
| BMI (kg/m2) | 17.23 ± 2.34 | 17.89 ± 3.23 | 0.145 | > 0.05 |
| Gender | ||||
| Male | 23 | 12 | 0.019 | > 0.05 |
| Female | 16 | 9 | ||
| Machine ventilation reason | > 0.05 | |||
| Severe pneumonia | 4 (10.25) | 3 (14.29) | ||
| Acute laryngitis | 3 (7.69) | 2 (9.52) | ||
| Acute asthma attack | 3 (7.69) | 2 (9.52) | ||
| Airway foreign body obstruction | 3 (7.69) | 1 (4.76) | ||
| Central nervous system disease | 6 (15.38) | 1 (4.76) | ||
| Accidental injury | 7 (17.94) | 4 (19.05) | ||
| Postoperative thoracic and cardiac surgery | 5 (12.82) | 4 (19.05) | ||
| Cardiopulmonary resuscitation | 5 (12.82) | 2 (9.52) | ||
| Other | 3 (7.69) | 2 (9.52) | ||
| MV duration (d) | 5 (3, 7) | 12 (5, 14) | 4.234 | < 0.05 |
| Total hospital stay (d) | 11 (4, 14) | 23 (14, 29) | 5.234 | < 0.05 |
Abbreviations: BMI, Body Mass Index; MV, mechanical ventilation.
a Values expressed as mean ± SD, median (25th percentile, 75th percentile) or No. (%).
4.3. Comparison of Diaphragmatic Ultrasound Parameters Between Successful and Failed Weaning Groups
The DE and DTF in the successful weaning group were significantly higher than those in the failed group, while the DE-RSBI and DTF-RSBI were significantly lower than those in the failed group (P < 0.05). The Cohen's d for the difference in DE between the successful and failed withdrawal groups was 1.81, and the Cohen's d for the difference in DTF was 1.34, both indicating large effects (Table 3).
| Ultrasound Parameters | Successful Weaning Group (n = 39) | Failed Weaning Group (n = 21) | t | P-Value | Cohen's d |
|---|---|---|---|---|---|
| DE (mm) | 9.23 ± 1.93 | 5.74 ± 1.34 | 5.342 | < 0.05 | 1.81 |
| Tei (mm) | 1.79 ± 0.16 | 1.73 ± 0.19 | 0.936 | > 0.05 | - |
| Tee (mm) | 1.45 ± 0.14 | 1.39 ± 0.15 | 0.631 | > 0.05 | - |
| DTF (%) | 29.34 ± 5.74 | 21.45 ± 6.04 | 3.153 | < 0.05 | 1.34 |
| DE-RSBI [breaths/(min.mm)] | 2.86 ± 0.35 | 4.78 ± 1.35 | 4.259 | < 0.05 | - |
| DTF-RSBI (breaths/min) | 92.34 ± 31.34 | 132.34 ± 60.23 | 3.682 | < 0.05 | - |
Abbreviations: DE, diaphragm excursion; Tei, diaphragmatic end-inspiratory thickness; Tee, diaphragmatic end-expiratory thickness; DTF, diaphragm thickening fraction; DE-RSBI, diaphragm excursion-rapid shallow breathing index; DTF-RSBI, diaphragm thickening fraction-rapid shallow breathing index.
a Values are expressed as mean ± SD.
4.4. Predictive Efficacy of Diaphragmatic Parameters
Diaphragm excursion and DE-RSBI had the highest predictive power (AUC > 0.8), while DTF and DTF-RSBI had the second highest predictive power (AUC > 0.7) (Table 4 and Figure 3).
| Ultrasound Parameters | Cut-Off Point | AUC | Upper- Lower Limit; 95% CI | Sensitivity (%) | Specificity (%) |
|---|---|---|---|---|---|
| DE (mm) | 10.2 | 0.882 | 0.780 - 0.975 | 81.23 | 88.12 |
| Tei (mm) | 1.9 | 0.443 | 0.268 - 0.613 | 42.26 | 61.26 |
| Tee (mm) | 1.4 | 0.487 | 0.313 - 0.659 | 44.19 | 65.62 |
| DTF (%) | 28.5 | 0.723 | 0.559 - 0.861 | 68.23 | 76.78 |
| DE-RSBI breaths/(min.mm) | 2.4 | 0.810 | 0.663 - 0.952 | 67.78 | 85.26 |
| DTF-RSBI (breaths/min) | 78.3 | 0.752 | 0.562 - 0.884 | 68.16 | 80.04 |
Abbreviations: AUC, area under the curve; CI, confidence interval; DE, diaphragm excursion; Tei, diaphragmatic end-inspiratory thickness; Tee, diaphragmatic end-expiratory thickness; DTF, diaphragm thickening fraction; DE-RSBI, diaphragm excursion-rapid shallow breathing index; DTF-RSBI, diaphragm thickening fraction-rapid shallow breathing index.
; curve meaning: ROC curves of DE, DTF, diaphragmatic excursion to rapid shallow breathing index (DE-RSBI), and diaphragmatic thickening fraction to rapid shallow breathing index (DTF-RSBI) are shown in the figure to predict withdrawal results; Area under the curve (AUC) : The AUC of DE is 0.882, the AUC of DTF is 0.723, the AUC of DE-RSBI is 0.810 and the AUC of DTF-RSBI is 0.725; truncation value: The best truncation value for DE is 8.5 mm, and the best truncation value for DTF is 25%.")
Predictive Efficacy of diaphragm ultrasound parameters on withdrawal Results (ROC curve); curve meaning: ROC curves of DE, DTF, diaphragmatic excursion to rapid shallow breathing index (DE-RSBI), and diaphragmatic thickening fraction to rapid shallow breathing index (DTF-RSBI) are shown in the figure to predict withdrawal results; Area under the curve (AUC) : The AUC of DE is 0.882, the AUC of DTF is 0.723, the AUC of DE-RSBI is 0.810 and the AUC of DTF-RSBI is 0.725; truncation value: The best truncation value for DE is 8.5 mm, and the best truncation value for DTF is 25%.
5. Discussion
Mechanical ventilation is a critical life-support intervention for many critically ill children. The VIDD is a common complication in patients with MV, and its pathogenesis involves a variety of pathophysiological changes, especially in pediatric patients. MV activates the ubiquitin-proteasome pathway through oxidative stress and promotes myosin heavy chain (MyHC) degradation, which is the core molecular mechanism of VIDD (8). The diaphragm, as a continuously active muscle, is disused for passive ventilation during MV, resulting in rapid atrophy of muscle fibers (especially type II fast muscle fibers). Animal models have shown that just 12-24 hours of MV can lead to a 20 - 30% reduction in diaphragmatic cross-sectional area (2). The proportion of type I slow muscle fibers in children's diaphragm is low (about 50% in adults and about 30% in children), while type II fibers are more likely to atrophy, and children's auxiliary respiratory muscles (such as intercostal muscles) are underdeveloped, making diaphragm dysfunction more likely to lead to weaning failure (9). Data indicate (10) that approximately one-third of children undergoing prolonged invasive respiratory support in PICUs develop VIDD. This leads to diaphragmatic atrophy and reduced muscle function, often resulting in weaning failure. Thus, timely and successful withdrawal from mechanical ventilation to minimize the occurrence of VIDD is of paramount importance for patient outcomes. The 2017 guidelines from the American Thoracic Society (11) recommend that patients on MV for more than 24 hours should undergo a spontaneous breathing trial (SBT) to assess their readiness for weaning. Nonetheless, even after passing the SBT, about 13% - 26% of patients may require reintubation (12). To enhance the probability of successful weaning, it is advisable to combine other indicators with the SBT for guidance. In recent years, numerous studies have reported on the predictive value of ultrasound-measured diaphragmatic parameters for weaning outcomes in mechanically ventilated patients (13), predominantly in adults, with fewer studies focusing on children. This study aimed at pediatric patients, quantitatively assessing diaphragmatic function in mechanically ventilated children in PICUs using ultrasound and further analyzing the predictive value of diaphragmatic ultrasound parameters on weaning outcomes, thereby providing a reference for PICU physicians in making informed decisions about the timing of weaning.
DE represents the volume of gas inhaled into the lungs with each breath and serves as an indicator of the body’s ability to inhale sufficient volumes of air. The DTF reflects the contractile function of the diaphragm with respiration, akin to the principles of cardiac contraction and relaxation. Atrophied diaphragms have reduced contractile strength, leading to decreased DE. The study found that DE, Tei, Tee, and DTF were all lower in the MV group compared to the control group, while DE-RSBI and DTF-RSBI were higher. These findings indicate diaphragmatic atrophy and reduced contractility in the MV group. Literature suggests that muscles used frequently are more prone to inactivity-related fiber atrophy compared to less frequently used muscles (14). Since the diaphragm operates 24 hours a day, it is more susceptible to atrophy and rapid loss of contractility when not contracting autonomously during mechanical ventilation. Diaphragmatic biopsies in MV patients have shown reduced cross-sectional area and contractile strength of diaphragmatic fibers (15). The comparison of diaphragmatic parameters between the control and MV groups in this study aligns with these observations, further demonstrating that diaphragmatic ultrasound can provide a quantitative assessment of diaphragmatic function in MV patients.
This study found that the duration of MV and the total length of hospital stay were significantly longer in the failed weaning group than in the successful group, suggesting that an extended period of MV might exacerbate diaphragmatic atrophy, increase the difficulty of weaning, and create a vicious cycle. The total duration of hospitalization reflects the severity of the patients’ conditions to a certain extent. When comparing diaphragmatic ultrasound parameters between the successful and failed weaning groups (Table 3), the DE and DTF were higher in the successful group, indicating that DE and DTF can serve as indicators of diaphragmatic contractility, with higher values indicating better diaphragmatic function and suggesting that normal diaphragmatic function is a prerequisite for successful weaning. This aligns with the conclusions of previous studies (16). In the present study, the DE-RSBI and DTF-RSBI were higher in the failed weaning group, as these patients exhibited a faster respiratory rate and weaker diaphragmatic contractility, making it difficult for spontaneous breathing to meet the body’s demands after MV removal, thus leading to weaning failure.
The limitation of the traditional shallow RSBI, which is commonly used as a predictor of withdrawal, is that it reflects the overall respiratory muscle function rather than the specific diaphragm function. RSBI is calculated based on the ratio of respiratory rate to tidal volume (RR/VT), and the production of tidal volume depends on the synergistic action of all inspiratory muscle groups, including the diaphragm. When diaphragm function is impaired, auxiliary respiratory muscles (such as intercostal muscles, trapezius muscles, etc.) may maintain tidal volume through compensatory enhanced contractions, thus masking diaphragmatic dysfunction. This compensatory mechanism results in reduced sensitivity and specificity of RSBI in assessing diaphragm-specific dysfunction. In contrast, DE-RSBI and DTF-RSBI achieve a specific assessment of diaphragm function by replacing tidal volume in RSBI with ultrasound parameters that directly reflect diaphragm function (diaphragm displacement DE or diaphragm thickening fraction DTF). The DE-RSBI (RR/DE) is directly related to respiratory rate and diaphragm movement amplitude, eliminating the influence of auxiliary respiratory muscle compensation. The DTF-RSBI (RR/DTF) reflects the efficiency of diaphragmatic contraction through the change rate of diaphragmatic thickness, and directly evaluates diaphragmatic performance. Many studies have confirmed that the AUC is significantly higher than that of traditional RSBI (17).
The results of this study showed that DE and DE-RSBI had the highest predictive power (AUC > 0.8), while DTF and DTF-RSBI had the second highest predictive power (AUC > 0.7). These findings are similar to those of previous studies in children or adults (18, 19) regarding the predictive efficacy of ultrasound parameters for weaning outcomes, but with different cutoff values, possibly due to differences in the age groups of children included in this study compared to previous research. Therefore, future studies should expand the sample size and conduct age-specific predictions. Compared to adults, children have a faster RR and lower DE and DTF, hence the cutoff values for DE-RSBI and DTF-RSBI are higher in children.
There are still some shortcomings in this study. First, 60 patients with MV were included in this study, which met the previous sample size estimate, but the statistical power of subgroup analysis (such as different age groups or etiological groups) may be insufficient. The second is the inherent bias of retrospective design. Finally, this study only evaluated the diaphragm function during weaning, and did not track the recovery of diaphragm after weaning. Based on these limitations, we intend to conduct a multicenter prospective cohort study that includes children of different ages, etiologies, and complications to develop a more generalized prediction model. We look forward to measuring diaphragm parameters multiple times during MV and plotting trajectories of functional changes to identify high-risk time windows for VIDD.
In conclusion, diaphragm ultrasound can quantitatively evaluate diaphragm thickness and contractile function in children with MV, which is of great value in predicting the outcome of weaning. DE and DE-RSBI are superior to DTF and DTF-RSBI in predicting the outcome of withdrawal, and can provide reference for clinical withdrawal decision.
