


1. Background
Coronary artery disease (CAD) is one of the leading causes of death globally, primarily linked to atherosclerosis. Atherosclerosis can result in plaque formation and endothelial dysfunction through vascular inflammation, leading to severe outcomes (1, 2). The CAD accounts for 38% of cardiovascular deaths in women and 44% in men (3). Given its significant burden, early detection is essential for the implementation of timely preventive and therapeutic interventions. Dyslipidemia is a key risk factor for atherosclerosis, with abnormal lipid profiles — characterized by elevated total cholesterol (TC), triglycerides (TG), low-density lipoprotein cholesterol (LDL-C), and a high LDL-C/high-density lipoprotein cholesterol (HDL-C) ratio — strongly associated with an increased risk of CAD (4). While traditional lipid markers remain widely used, non-traditional lipid indices such as TC/HDL-C (Castelli Risk Index-I), LDL-C/HDL-C (Castelli Risk Index-II), non-HDL-C/HDL-C (Atherogenic Coefficient, AC), and the plasma atherogenic index (PAI, the logarithm of the TG/HDL-C ratio) have demonstrated superior predictive value for CAD severity (5-8).
Beyond lipid metabolism, inflammation plays a pivotal role in atherosclerosis. Monocytes, as key mediators of vascular inflammation, interact with endothelial cells and platelets to trigger prothrombotic and inflammatory pathways (9). The monocyte/HDL-C ratio (MHR) has recently emerged as a novel composite marker integrating lipid metabolism and inflammation, with studies suggesting its prognostic value in cardiovascular diseases (9-12). Despite its potential, existing literature lacks a comprehensive evaluation of MHR and lipid indices in the context of CAD severity and the necessity for invasive coronary angiography (ICA), particularly with respect to gender differences. Since females generally exhibit higher HDL-C levels than males, gender-specific variations may confound the predictive utility of these indices.
Given the need for accurate risk stratification, imaging modalities play a crucial role in assessing CAD severity. Among these, coronary computed tomography angiography (CCTA) has emerged as a valuable non-invasive tool for evaluating coronary arteries, offering an alternative to traditional invasive approaches. Large multicenter studies have demonstrated CCTA’s high diagnostic accuracy for CAD, with sensitivity rates of 85% to 99% and specificity ranging from 64% to 92% (13). The CAD Reporting and Data System (CAD-RADS) is a standardized scoring system for coronary artery stenosis detected by CCTA, which includes recommendations for further testing and patient management (14). The 2021 Expert Consensus from the society of cardiovascular computed tomography (SCCT) recommends using CAD-RADS for standardized reporting of CCTA findings (15). The 2022 update (CAD-RADS 2.0) introduced refinements, including new plaque burden categories and revised clinical management strategies (16). These advancements highlight the growing role of CCTA in CAD diagnosis and risk stratification.
While ICA remains the gold standard for diagnosing CAD, it is invasive, costly, and requires specialized facilities. Traditionally, ICA has been the gold standard for diagnosing CAD in studies exploring the link between lipid indices and CAD (5-8, 17-19). However, this approach primarily focuses on luminal stenosis and does not fully capture the extent of atherosclerotic burden. Emerging evidence suggests that CCTA may offer a more comprehensive evaluation, as it enables plaque characterization beyond luminal narrowing (20). This underscores the need to reassess the role of lipid indices and inflammatory markers like MHR in predicting CAD severity within a CCTA-based stratification framework.
2. Objectives
This study aims to bridge this gap by evaluating the predictive value of MHR and other lipid indices in assessing CAD severity and the necessity for invasive angiography in male and female patients classified according to CAD-RADS scores. By integrating inflammatory and lipid markers with CCTA-based stratification, this study seeks to provide a more nuanced understanding of cardiovascular risk assessment and guide clinical decision-making in diverse patient populations.
3. Patients and Methods
This retrospective study was conducted at a third-stage Training and Research Hospital, a tertiary referral center specializing in cardiovascular imaging, which serves a diverse population from both urban and rural areas. All procedures performed in this study involving human participants were in accordance with the ethical standards of the Institutional Research Committee and the 1964 Helsinki Declaration and its later amendments or comparable ethical standards. This study was approved by the local ethics committee (Decision number: 2024/25). No artificial intelligence or assisted technologies (such as large language models, chatbots, or image generators) were used in the production of the work submitted in this article.
3.1. Study Design
Data were collected at a single time point from the hospital's electronic medical records of 643 consecutive patients over the age of 18 who underwent CCTA between January 1 and August 1, 2024. All patients who underwent CCTA at our center during the specified time period were considered for inclusion, and no arbitrary sampling method was applied. Exclusions were based strictly on predefined criteria to ensure methodological rigor and data integrity. The exclusion criteria for the study were as follows:
- Patients without complete data for the parameters used to calculate atherogenic indices
- Those with a history of coronary artery stent placement or coronary bypass surgery
- Patients whose coronary arteries could not be clearly evaluated and therefore could not be classified according to the CAD-RADS system
- Those with known CAD, severe valve disease, or aortic aneurysm
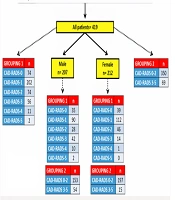
After applying these criteria, the final study population consisted of 419 patients (207 males and 212 females) (Figure 1). The patients were categorized into two grouping systems based on their CAD-RADS scores (Table 1):

Flowchart of enrolled patients in the study
| Variables | Males | Females | Total |
|---|---|---|---|
| Grouping 1 | |||
| CAD-RADS-0 group | 35 | 39 | 74 |
| CAD-RADS-1 group | 90 | 112 | 202 |
| CAD-RADS-2 group | 28 | 46 | 74 |
| CAD-RADS-3 group | 42 | 14 | 56 |
| CAD-RADS-4 group | 10 | 1 | 11 |
| CAD-RADS-5 group | 2 | 0 | 2 |
| Grouping 2 | |||
| CAD-RADS 0 - 2 | 153 | 197 | 350 |
| CAD-RADS 3 - 5 | 54 | 15 | 69 |
Abbreviation: CAD-RADS, coronary artery disease-reporting and data system.
3.1.1. Grouping 1
Patients were divided into six groups based on their CAD-RADS scores:
- The CAD-RADS-0 group (n = 74)
- The CAD-RADS-1 group (n = 202)
- The CAD-RADS-2 group (n = 74)
- The CAD-RADS-3 group (n = 56)
- The CAD-RADS-4 group (n = 11)
- The CAD-RADS-5 group (n = 2)
3.1.2. Grouping 2
Patients were divided into two groups:
- The CAD-RADS 0 - 2 (n = 350): Patients not recommended for invasive angiography
- The CAD-RADS 3 - 5 (n = 69): Patients recommended for invasive angiography
Additionally, because lipid profiles, particularly HDL cholesterol levels, vary between men and women, the patients were first grouped by gender. They were then further classified according to the same CAD-RADS grouping systems described above (Figure 1).
3.2. Coronary Computed Tomography Angiography
Coronary computed tomography angiography imaging was conducted using a 320-slice Toshiba Aquillion ONE ViSION edition (Toshiba Medical Systems, Otowara, Japan) tomography system. The device settings included a tube current of 280 mA, a voltage of 100 kV, and a gantry rotation time of 0.275 seconds. To enhance image quality, a cardioselective oral beta-blocker was administered to patients with heart rates exceeding 60 beats per minute (bpm). Axial images were acquired through volumetric scanning at a 0.75 mm slice thickness and 0.3 mm slice increment in the 75%, 1.07s segment (best phase) with prospective gating. Imaging data were evaluated using Vitrea software (Toshiba Medical Systems, Otowara, Japan). Stenosis rates were assessed following the CAD-RADS criteria.
3.3. Coronary Artery Disease-Reporting and Data System
The CAD-RADS is a standardized scoring system used to assess coronary artery stenosis based on CCTA images (21). In 2022, it was updated to version 2.0, which introduced the following categories (16):
- 0: No visible stenosis
- 1: 1 - 24% minimal stenosis
- 2: 25 - 49% mild stenosis
- 3: 50 - 69% moderate stenosis
- 4A: 70 - 99% severe stenosis
- 4B: Left main artery stenosis > 50% or three-vessel stenosis of 70 - 99%
- 5: 100% total occlusion
The CAD-RADS 2.0 also provides recommendations for further cardiac evaluation and management. Patients with a CAD-RADS score of 3 or higher are of particular clinical significance, as they may require additional testing or treatment (16).
3.4. Laboratory Parameters
Laboratory results for complete blood count and lipid panel tests (total cholesterol, HDL cholesterol, LDL cholesterol, and triglycerides) were retrieved from the hospital's information system to calculate the monocyte/HDL cholesterol ratio and atherogenic indices. Complete blood counts were performed using a Sysmex XN-1000 automatic blood cell counter (Sysmex, Kobe, Japan), with monocyte values reported in 109/L. The lipid panel tests were conducted using original kits on a Roche Cobas C702 (Roche Diagnostics, GmbH, Mannheim, Germany) automatic biochemistry analyzer, with results expressed in mg/dL. These devices are routinely used in our hospital's biochemistry laboratory for patient care, and internal and external quality control processes are managed and audited to ensure the reliability of test results. The indices and ratios evaluated in this study are detailed in Table 2.
| Parameters | Formulas |
|---|---|
| MHR | (Monocyte / HDL cholesterol) X 100 |
| PAI | Log (Triglyceride / HDL cholesterol) |
| AC | (Total cholesterol - HDL cholesterol) / HDL cholesterol |
| CRI-I | Total cholesterol / HDL cholesterol |
| CRI-II | LDL cholesterol / HDL cholesterol |
Abbreviations: AC, atherogenic coefficient; CRI, Castelli's risk index; HDL, high-density lipoprotein; LDL, low-density lipoprotein; MHR, monocyte to high-density lipoprotein cholesterol ratio; PAI, plasma atherogenic index.
3.5. Sample Size
The sample size was determined using G*Power version 3.1.9.7 software, following the methodology of Okan and Topaloglu (22). The parameters were set as follows: the probability of type I error (α) was 5%, the effect size was 0.337, the critical F was 3.062, and the non-centrality parameter λ was 16.06. Consequently, a total sample size of 141 volunteers was needed to achieve a statistical power (1 – β) of 95%.
3.6. Statistical Analysis
Statistical analysis was conducted using SPSS version 15.0 (SPSS Inc.; Chicago, IL, USA). The Shapiro-Wilk test was used to assess the normality of the data. Continuous variables with a normal distribution were presented as mean ± standard deviation (SD), and those without a normal distribution were presented as median (minimum-maximum). Categorical variables (e.g., gender) were presented as frequencies. Comparisons between two independent groups for continuous variables with a normal distribution were performed using the independent samples t-test, and the Mann-Whitney U test was used for variables without a normal distribution. For comparisons of more than two independent groups with non-normally distributed data, the Kruskal-Wallis test was utilized. The one-way ANOVA test was employed for comparing normally distributed data across more than two independent groups. To account for multiple comparisons, post hoc adjustments were performed. The Dunn-Bonferroni test was used after the Kruskal-Wallis test, and the Bonferroni correction was applied following the one-way ANOVA test. For statistically significant differences in laboratory parameters, effect sizes and 95% confidence intervals were reported. Effect sizes for the Mann-Whitney U test were calculated using r = Z / √N. The Hodges-Lehmann median difference and its 95% confidence interval were reported for non-parametric comparisons. Categorical data were analyzed using the chi-square test. Statistical significance was set at P ≤ 0.05.
4. Results
The study population consisted of 419 patients, with 207 males and 212 females. The flowchart of the study is illustrated in Figure 1. The patients ranged in age from 27 to 80 years. When patients were classified into six groups based on their CAD-RADS scores, a significant gender and age difference was observed across the groups (P < 0.001). The CAD-RADS-0 group was significantly younger than the CAD-RADS 1, 2, 3, and 4 groups (P = 0.003, < 0.001, < 0.001, and < 0.001, respectively), and the CAD-RADS-1 group was significantly younger than the CAD-RADS-4 group (P = 0.001). When the study population was divided by gender, significant age differences between CAD-RADS groups were observed in both males and females. In males, those in the CAD-RADS-0 group were significantly younger than those in the CAD-RADS 1, 2, 3, and 4 groups (P = 0.037, 0.033, < 0.001, < 0.001, and 0.012, respectively), and males in the CAD-RADS-4 group were significantly older than those in the CAD-RADS-1 and 2 groups (P < 0.001, 0.003). In females, those in the CAD-RADS-0 group were significantly younger than those in the CAD-RADS 2 and 3 groups (P < 0.001 and 0.020), and females in the CAD-RADS-1 group were significantly younger than those in the CAD-RADS-2 group (P = 0.023) (Table 3). Significant differences were not observed in the indices and ratios parameters, including gender-based further analyses, among the six groups (Table 3 and Figure 2).
| Parameters | CAD - RADS - 0 | CAD - RADS - 1 | CAD - RADS - 2 | CAD - RADS - 3 | CAD - RADS - 4 | CAD - RADS - 5 | P - Value |
|---|---|---|---|---|---|---|---|
| All patients | |||||||
| No. | 74 | 202 | 74 | 56 | 11 | 2 | |
| Age (y) | 48.00 (32.00 - 77.00) | 52.50 (27.00 - 80.00) | 57.50 (34.00 - 74.00) | 55.00 (34.00 - 79.00) | 64.00 (51.00 - 73.00) | 67.00 (64.00 - 70.00) | < 0.001 b |
| Gender (M/F) | 35/39 | 90/112 | 28/46 | 42/14 | 10/1 | 2/0 | < 0.001 b |
| MHR | 1.19 (0.46 - 2.63) | 1.15 (0.30 - 2.75) | 1.19 (0.23 - 3.60) | 1.43 (0.26 - 3.13) | 1.35 (0.58 - 3.16) | 0.71 (0.60 - 0.81) | 0.094 |
| PAI | 0.50 ± 0.29 | 0.52 ± 0.30 | 0.52 ± 0.29 | 0.60 ± 0.29 | 0.51 ± 0.33 | 0.37 ± 0.18 | 0.413 |
| AC | 3.13 (0.96 - 7.18) | 3.16 (1.14 - 8.09) | 3.19 (1.09 - 7.29) | 3.64 (0.69 - 6.68) | 3.33 (1.72 - 7.68) | 3.78 (2.55 - 5.02) | 0.306 |
| CRI – I | 4.13 (1.96 - 8.18) | 4.17 (2.14 - 9.09) | 4.19 (2.09 - 8.29) | 4.64 (1.69 - 7.68) | 4.33 (2.72 - 8.68) | 4.78 (3.55 - 6.02) | 0.306 |
| CRI – II | 2.74 (0.83 - 4.67) | 2.70 (0.97 - 6.68) | 2.80 (1.00 - 6.97) | 3.13 (0.61 - 5.66) | 2.98 (1.73 - 5.41) | 3.51 (2.53 - 4.50) | 0.194 |
| Male | |||||||
| No. | 35 | 90 | 28 | 42 | 10 | 2 | |
| Age (y) | 44.29 ± 7.31 | 49.89 ± 10.00 | 51.50 ± 10.36 | 54.90 ± 8.49 | 64.40 ± 6.13 | 67.00 ± 4.24 | < 0.001 b |
| MHR | 1.45 ± 0.49 | 1.52 ± 0.49 | 1.68 ± 0.66 | 1.54 ± 0.58 | 1.60 ± 0.84 | 0.71 ± 0.15 | 0.201 |
| PAI | 0.52 (0.18 - 1.14) | 0.64 ( - 0.06 - 1.37) | 0.67 (0.29 - 1.19) | 0.68 (0.06 - 1.34) | 0.53 (0.06 - 1.11) | 0.37 (0.24 - 0.50) | 0.399 |
| AC | 3.93 (1.38 - 7.18) | 3.85 (1.33 - 8.09) | 3.64 (2.30 - 7.29) | 3.82 (0.69 - 6.68) | 3.64 (1.72 - 7.68) | 3.78 (2.55 - 5.02) | 0.971 |
| CRI – I | 4.93 (2.38 - 8.18) | 4.85 (2.33 - 9.09) | 4.64 (3.30 - 8.29) | 4.82 (1.69 - 7.68) | 4.64 (2.72 - 8.68) | 4.78 (3.55 - 6.02) | 0.971 |
| CRI – II | 3.41 (0.90 - 4.67) | 3.14 (1.08 - 6.68) | 3.08 (1.89 - 5.24) | 3.23 (0.61 - 5.66) | 3.05 (1.73 - 5.41) | 3.51 (2.53 - 4.50) | 0.990 |
| Female | |||||||
| No. | 39 | 112 | 46 | 14 | 1 | 0 | |
| Age (y) | 50.00 (35.00 - 77.00) | 54.00 (32.00 - 80.00) | 60.50 (40.00 - 74.00) | 62.50 (36.00 - 68.00) | 66.00 | - | < 0.001 b |
| MHR | 0.92 (0.46 - 2.99) | 0.93 (0.30 - 2.49) | 0.99 (0.23 - 3.25) | 1.05 (0.67 - 2.13) | 0.75 | - | 0.666 |
| PAI | 0.41 ( - 0.17 - 1.04) | 0.42 ( - 0.31 - 1.12) | 0.46 ( - 0.24 - 0.98) | 0.43 (0.14 - 0.81) | 0.28 | - | 0.921 |
| AC | 2.80 (0.96 - 5.00) | 2.65 (1.14 - 6.73) | 2.77 (1.09 - 7.21) | 2.85 (1.56 - 5.64) | 2.91 | - | 0.832 |
| CRI – I | 3.80 (1.96 - 6.00) | 3.65 (2.14 - 7.73) | 3.77 (2.09 - 8.21) | 3.85 (2.56 - 6.64) | 3.91 | - | 0.832 |
| CRI – II | 2.52 (0.83 - 3.82) | 2.36 (0.97 - 5.90) | 2.44 (1.00 - 6.97) | 2.40 (1.33 - 5.11) | 2.82 | - | 0.845 |
Abbreviations: CAD, coronary artery disease; AC, atherogenic coefficient; CRI, Castelli's risk index; F, female; M, male; MHR, monocyte to high-density lipoprotein cholesterol ratio; PAI, plasma atherogenic index.
a Values are expressed as median (minimum - maximum) or mean ± SD.
b P < 0.05 was considered statistically significant. The sub-groups with only 1 or 2 patients were excluded from the analysis due to insufficient sample size for statistical testing.
")
Graphical representation of laboratory values across study groups (grouping 1)
When patients were grouped into CAD-RADS 0 - 2 and CAD-RADS 3 - 5, a significant gender difference was observed between the two groups (P < 0.001). The CAD-RADS 0 - 2 group was significantly younger than the CAD-RADS 3 - 5 group (P < 0.001). Upon further gender-based division into CAD-RADS 0 - 2 and CAD-RADS 3 - 5 groups, both males (P < 0.001) and females (P = 0.050) in the CAD-RADS 0-2 group were significantly younger than those in the CAD-RADS 3 - 5 group (Table 4). The CAD-RADS 0 - 2 group had significantly lower MHR, AC, CRI-I, and CRI-II values compared to the CAD-RADS 3 - 5 group (P = 0.029, 0.017, 0.017, and 0.008, respectively). The effect sizes (r) for MHR, AC, CRI-I, and CRI-II were 0.106, 0.115, 0.115, and 0.130, respectively, suggesting small to medium effect sizes according to Cohen’s classification. The Hodges-Lehmann median difference (95% CI) for MHR was -0.160 (-0.308 to -0.017), for AC was -0.437 (-0.787 to -0.084), for CRI-I was -0.437 (-0.787 to -0.084), and for CRI-II was -0.376 (-0.655 to -0.101). Upon further gender-based division, no significant differences were detected in the indices and ratios parameters between the groups (Table 4 and Figure 3).
| Parameters | CAD-RADS 0 - 2 | CAD-RADS 3 - 5 | P-Value |
|---|---|---|---|
| All patients | |||
| No. | 350 | 69 | |
| Age (y) | 51.00 (27.00 - 80.00) | 57.00 (34.00 - 79.00) | < 0.001 b |
| Gender (m/f) | 153/197 | 54/15 | < 0.001 b |
| MHR | 1.15 (0.23 - 3.60) | 1.38 (0.26 - 3.16) | 0.029 b |
| PAI | 0.52 ± 0.30 | 0.58 ± 0.29 | 0.099 |
| AC | 3.17 (0.39 - 8.09) | 3.63 (0.69 - 7.68) | 0.017 b |
| CRI-I | 4.17 (1.96 - 9.09) | 4.63 (1.69 - 8.68) | 0.017 b |
| CRI-II | 2.73 (0.83 - 6.97) | 3.12 (0.61 - 5.66) | 0.008 b |
| Male | |||
| No. | 153 | 54 | |
| Age (y) | 48.00 (27.00 - 74.00) | 56.00 (34.00 - 79.00) | < 0.001 b |
| MHR | 1.50 (0.48 - 3.60) | 1.51 (0.26 - 3.16) | 0.785 |
| PAI | 0.64 ± 0.28 | 0.62 ± 0.30 | 0.654 |
| AC | 3.85 (1.33 - 8.09) | 3.82 (0.69 - 7.68) | 0.959 |
| CRI-I | 4.85 (2.33 - 9.09) | 4.82 (1.69 - 8.68) | 0.959 |
| CRI-II | 3.24 ± 0.94 | 3.29 ± 1.06 | 0.770 |
| Female | |||
| No. | 197 | 15 | |
| Age (y) | 54.00 (32.00 - 80.00) | 63.00 (36.00 - 68.00) | 0.050 b |
| MHR | 0.93 (0.23 - 3.25) | 1.04 (0.67 - 2.13) | 0.440 |
| PAI | 0.42 ± 0.27 | 0.44 ± 0.22 | 0.800 |
| AC | 2.75 (0.96 - 7.21) | 2.91 (1.56 - 5.64) | 0.232 |
| CRI-I | 3.75 (1.96 - 8.21) | 3.91 (2.56 - 6.64) | 0.232 |
| CRI-II | 2.37 (0.83 - 6.97) | 2.42 (1.33 - 5.11) | 0.259 |
Abbreviations: CAD-RADS, coronary artery disease-reporting and data system; AC, atherogenic coefficient; CRI, Castelli's risk index; F, female; M, male; MHR, monocyte to high-density lipoprotein cholesterol ratio; PAI, plasma atherogenic index.
a Values are expressed as median (minimum - maximum) or mean ± SD.
b P < 0.05 was considered statistically significant.
")
Graphical representation of laboratory values across study groups (grouping 2)
5. Discussion
Coronary computed tomography angiography has become a widely used non-invasive imaging modality for evaluating coronary atherosclerosis. Current European Society of Cardiology (ESC) guidelines recommend CCTA as a primary diagnostic tool for CAD (23). In this study, 643 patients who underwent CCTA between January 1 and August 1, 2024, were retrospectively analyzed. After applying exclusion criteria, 419 patients were included in the study. Patients were grouped based on their CAD-RADS scores using two different classification methods. In the first approach, they were divided into six groups to evaluate the relationship between CAD-RADS scores and parameters such as the MHR and other atherogenic indices. In the second approach, they were classified into two groups (CAD-RADS 0 - 2 and 3 - 5) to assess the predictive value of MHR and other atherogenic indices for the need for invasive angiography. Additionally, gender-based subgroup analyses were conducted, taking into account the known differences in HDL cholesterol levels.
Significant gender and age differences were observed between CAD-RADS score groups, with male and older patients having higher CAD-RADS scores. The relationship between advanced age, male gender, and increased risk of cardiac death or major cardiovascular events is well known. In our study, the association between higher CAD-RADS scores and male gender is consistent with previous studies. Popa et al. and Kadiyoran and Yilmaz reported that advanced age and male gender independently correlate with higher CAD-RADS scores (24, 25).
Inflammation plays a key role in atherosclerosis, with monocytes contributing to plaque progression by transforming into macrophages (3, 9). Gratchev et al. demonstrated that circulating monocytes are precursors to tissue macrophages and that these cells can become foam cells, which are markers for new atherosclerotic plaque development (26). Similarly, Nozawa et al. revealed the critical role of monocytes in coronary plaque progression, particularly in acute myocardial infarction (27). Cholesterol is also central to the atherosclerotic process. LDL contributes to plaque formation, while HDL has anti-atherosclerotic properties by preventing LDL oxidation and inhibiting monocyte activity (28, 29). The MHR has been proposed as a marker of inflammation and atherosclerosis balance, with previous studies linking it to CAD severity (30-32). Moreover, MHR has been linked to other reliable atherosclerosis markers such as carotid intima-media thickness, flow-mediated dilation, slow coronary flow, and left ankle-brachial pulse wave velocity (33-36).
However, our results challenge the reliability of MHR as a predictive marker for CAD-RADS scoring, particularly when gender is considered. While no significant differences in MHR were found among the six CAD-RADS groups (P = 0.094), a significant difference emerged when patients were dichotomized into two groups (P = 0.029). The impact of gender on these results should not be ignored, as there were differences in gender distribution between groups. When gender-based analyses were conducted, MHR did not show significant differences within either male or female subgroups. These findings suggest that while MHR may initially appear predictive of the need for invasive angiography, their association with CAD-RADS scores is likely confounded by gender differences in HDL cholesterol reference levels. Our findings highlight the importance of controlling for gender differences in lipid levels when interpreting MHR-related results.
Kadiyoran and Yilmaz examined the relationship between MHR and CAD-RADS scores in CCTA patients and observed a significant association (25). However, in this study, men were significantly more prevalent in higher CAD-RADS score groups, which actually makes interpreting MHR as an independent predictor inappropriate. In another study, patients were classified based on plaque types (no plaque, vulnerable plaque, stable plaque), and it was found that MHR was significantly higher in the vulnerable plaque group compared to the no plaque group (22). The lack of a significant gender difference between groups in this study supports the reliability of the results. Similarly, in a study where patients were classified according to coronary calcium scores (CCS), MHR was significantly higher in patients with moderate and high CCS (37). However, in this study, significant gender differences between the groups were reported, and the results should be interpreted considering the gender factor.
Considering the role of endothelial dysfunction and lipid profiles in the progression of atherosclerosis, accurate and non-invasive clinical assessment methods have long been investigated. Traditionally, markers such as total cholesterol, triglycerides, LDL-C, and HDL-C have been used to predict the development of atherosclerotic plaques in clinical and research settings (38). However, these traditional markers may not fully reflect the severity of atherosclerosis (38). This has led to the development of non-traditional lipid indices, such as CRI-I, CRI-II, AC, and PAI. Introduced in 1983, the Castelli indices were designed to assess cholesterol clearance efficiency via HDL-C (39). The atherogenic coefficient further refines these measurements by considering the balance between atherogenic and anti-atherogenic lipids. PAI combines triglycerides and HDL-C into a single marker, providing a practical cardiovascular risk assessment method that can be calculated using routine lipid panel data (40).
Non-traditional lipid indices have been proposed as superior predictors of atherosclerosis compared to traditional lipid markers. In our study, findings for atherogenic indices such as the Atherogenic Coefficient (AC), Castelli Risk Index-I (CRI-I), and Castelli Risk Index-II (CRI-II) exhibited a pattern similar to that of MHR. Therefore, our interpretation of MHR is also applicable to these parameters: While these results suggest that non-traditional lipid indices may initially predict the need for invasive angiography, their association with CAD-RADS scores is likely confounded by gender differences in HDL cholesterol reference levels. Previous studies have reported significant associations between these indices and the severity of CAD, whereas our results do not appear to be consistent with these studies. Our findings suggest that these indices should be interpreted with caution in studies with unequal gender distributions. Li et al. reported significantly higher CRI-I, CRI-II, and PAI values in the CAD group compared to the non-CAD group, but these higher values were likely due to lower HDL cholesterol levels in males, as 80% of the CAD group were male (7). Similarly, in a study comparing control and atherosclerosis groups, we believe the higher PAI, CRI-I, and CRI-II values in the atherosclerosis group were influenced by the higher proportion of male participants (41). Mahdavi-Roshan et al. found higher PAI, CRI-I, and CRI-II values in the CAD group compared to controls, with no gender differences, which strengthens the reliability of their results (42).
One of the strengths of this study is its systematic approach to analyzing CAD-RADS scores in relation to MHR and atherogenic indices, incorporating both overall analysis and gender-based subgroup analyses. The six-group classification based on CAD-RADS scores allowed for a detailed assessment of trends across increasing CAD severity, while the two-group classification focused on evaluating the necessity of ICA, ensuring a comprehensive evaluation of these markers. However, several limitations should be acknowledged. First, the sample size calculation was not specifically powered for gender-based further analysis. This may have reduced the statistical power and affected the significance levels due to the smaller sample sizes within each gender subgroup. While we observed significant associations in the two-group analysis of the variables, the lack of significance in gender-based further analyses may potentially be attributed to the smaller sample sizes within each gender subgroup. However, rather than omitting gender-specific analyses entirely, we believe presenting these findings transparently allows for a more comprehensive interpretation of the data. Additionally, the explanation of this finding in light of general medical knowledge about known gender-based reference value differences in lipid levels, particularly HDL-C, suggests that the study provides meaningful contributions to the literature. Future studies should consider a priori sample size calculations that account for gender-based further analysis to enhance the power of such analyses and validate these observations.
A further limitation of this study is the small sample size in specific CAD-RADS categories, particularly in CAD-RADS-4 and CAD-RADS-5, which could impact the statistical power of subgroup analyses. Although we included all patients who underwent CCTA within the specified time period, the limited number of participants in these categories may reduce the ability to detect statistically significant differences. Nevertheless, we believe the findings, especially those highlighting gender-specific differences in lipid profiles, provide valuable insights. Future studies with larger sample sizes, particularly targeting these specific subgroups, are needed to provide more reliable and generalized insights into these categories.
Additionally, the retrospective design and missing or inconsistent data in patient records limited our ability to include important confounding variables such as comorbidities, medication use, lifestyle factors, and socioeconomic status. However, the key findings of our study highlight meaningful relationships based on the available data and offer valuable contributions to the literature. Future studies should prospectively collect these factors and control for them using multivariate analyses. Finally, as a single-center, retrospective observational study, it may be subject to selection bias. In particular, variations in clinical practices and patient populations across different centers may restrict the generalizability of our findings. Therefore, larger-scale, multi-center, and prospective studies are needed to strengthen these findings.
In conclusion, this study highlights the importance of considering gender differences when evaluating the relationship between MHR, atherogenic indices, CAD severity, and ICA necessity. While initial analyses suggested that these markers might predict the need for invasive angiography, gender-based subgroup analyses revealed no significant relationships, indicating that gender differences in HDL cholesterol levels may influence these findings. Future studies should incorporate gender-balanced populations and prospective methodologies to further validate these observations.
