


1. Background
Multiple sclerosis (MS) is an inflammatory, demyelinating, and neurodegenerative disease characterized by the progressive accumulation of damage to the central nervous system (CNS) (1). Virchow-Robin spaces (VRS) are extracellular matrix- or fluid-filled areas located between the basal lamina of astrocytic foot processes and the endothelium of CNS arteries, capillaries, and veins (2, 3). These spaces have been identified as markers of brain inflammation (4).
The VRS are subarachnoid spaces that extend from the perivascular regions of arteries and veins into the brain parenchyma. While small VRS are observed in all age groups, their frequency and apparent size increase with age. They can become quite large, predominantly affect one hemisphere, and assume bizarre configurations (5). Understanding the signal intensity and location of VRS helps differentiate them from various pathological conditions, including lacunar infarcts, cystic periventricular leukomalacia, MS, cryptococcosis, mucopolysaccharidosis, and cystic neoplasms (2, 3). The presence of VRS suggests neuronal degeneration and neuroinflammation (6).
Traditional views held that enlarged VRS (eVRS) were incidental MRI findings without pathological significance or were associated with brain aging. However, several observations have challenged this notion, suggesting their potential role as MRI markers of cerebral neuropathology (7). Although eVRS are frequently observed with advancing age (8), a significant increase in their number and volume has been reported in vascular or neurodegenerative diseases (9). Moreover, given that one of the most common locations for eVRS is the basal ganglia and pontomesencephalic junction in the midbrain, an association with extrapyramidal disorders has also been suggested (10). In MS, eVRS have been associated with white matter or gray matter (GM) pathology (11).
While evidence suggests that VRS burden is more associated with cardiovascular risk factors (e.g., hypertension, higher BMI), it remains unclear how (and if) they contribute to disease pathogenesis. Furthermore, there is very limited evidence for an association between eVRS and clinical measures of disease severity, either cross-sectionally or longitudinally, in most neurological and neurodegenerative diseases where VRS have been observed (3, 12).
Several studies conducted on MS patients have demonstrated that the volume and number of VRS increase concurrently with disease severity. However, a meta-analysis failed to confirm this association regarding the increased number and volume of VRS in MS patients compared to controls (13, 14). Nevertheless, more recent studies utilizing higher-resolution imaging have shown that in MS, VRS volume correlates with disease severity, duration, lesion load, cortical atrophy, and dissemination criteria. Improvements in MRI resolution and VRS detection methods have enhanced diagnostic capabilities. However, the clinical significance of increased VRS number and volume in these patients remains unclear. It is hypothesized that the mere presence of VRS is not clinically significant, but rather, eVRS is indicative of disease; however, evidence for this is limited (3).
Recent studies have suggested several biological mechanisms by which VRS could be linked to MS progression. One hypothesis is that VRS may serve as conduits for inflammatory cells and mediators, facilitating the spread of inflammation within the CNS. In MS, the immune system attacks the myelin sheath, leading to demyelination and neurodegeneration. VRS may play a role in this process by providing a pathway for immune cells to infiltrate the brain parenchyma (15, 16).
Our study aims to address these gaps by comparing the characteristics of VRS in MS patients with a control group using advanced imaging techniques and a larger sample size. This approach allows us to provide new insights into the clinical significance of VRS in MS, which has not been fully explored in previous studies.
2. Objectives
Given the existing findings and hypotheses regarding the potential association between the characteristics of VRS and brain cell damage, as well as the presence of myelin sheath alterations in the central nervous system of patients with MS, this study aimed to compare the characteristics of VRS in patients with MS and a control group.
3. Patients and Methods
This case-control study was conducted following proposal approval, ethics code acquisition, and obtaining the necessary permits. The study population included patients with MS as the case group and individuals without MS as the control group. Samples were selected using a consecutive sampling method among MS patients and non-MS individuals referred for brain MRI, according to the predetermined sample size. After obtaining informed consent, participants provided their age, gender, and disease duration (for the case group), which was recorded in a questionnaire.
Standard MRI was performed using a SIEMENS MAGNETOM Avanto 1.5-Tesla scanner with T1-weighted and T2-weighted sequences for both groups (23). Sagittal and axial T1-weighted images, axial and sagittal T2-weighted images (TE 3382/90 ms), and axial and sagittal FLAIR images (TR/TE 11000/140 ms) were acquired. A 256 × 256 matrix and a 24 × 24 cm field of view were used. Lesion size was measured using high-resolution MRI, specifically T1-weighted, T2-weighted, and FLAIR sequences.
The VRS were identified and measured on axial T2-weighted images, where they appear as hyperintense or isointense structures relative to cerebrospinal fluid. The largest diameter of each VRS was recorded using semi-automated image analysis software, with manual verification by two board-certified radiologists. Measurements were performed in the axial plane to ensure consistency and optimal visualization. Image analysis was performed using specialized software, allowing for precise quantification of lesion size.
Participants were included if they had a confirmed diagnosis of MS and provided informed consent. Exclusion criteria included the presence of any comorbid conditions in addition to MS, acute or chronic illnesses in the control group, and the detection of white matter lesions (WMLs) on imaging in the control group. The sample size was calculated to be 91 participants per group (182 in total) using the formula for comparing means between two populations. This calculation was based on an alpha level of 0.01, a beta level of 0.20 (power of 0.84), and the mean and standard deviation values for the number of VRS in MS patients and healthy controls reported in the study by Etemadifar et al. (17).
Wide VRS are defined as fluid-filled spaces surrounding blood vessels in the brain that are significantly enlarged, typically exceeding 2 mm in diameter. These spaces can be indicative of underlying neurological conditions, including MS. The MS patients were categorized into clinical subgroups based on their disease course: Relapsing-remitting multiple sclerosis (RRMS), secondary-progressive multiple sclerosis (SPMS), primary-progressive multiple sclerosis (PPMS), and progressive-relapsing multiple sclerosis (PRMS). This classification was used to ensure a comprehensive analysis of the characteristics of VRS across different MS subtypes.
The WMLs were assessed using axial FLAIR and T2-weighted sequences. Lesions were defined as hyperintense areas ≥ 3 mm in diameter. The number and total volume of WMLs were recorded for each participant using semi-automated segmentation software. Correlations between WMLs and VRS characteristics were analyzed using Spearman’s rank correlation and logistic regression. MRI findings regarding the number, shape, and size of VRS were recorded in a checklist. Logistic regression was employed to adjust for potential confounding effects of age and gender. After data collection was completed for both groups, the data were analyzed using SPSS version 20. To compare the case and control groups, the chi-square test was used for categorical variables, the Student's t-test for continuous variables with a normal distribution, and the Mann-Whitney U test for continuous variables with a non-normal distribution. Logistic regression was employed to assess the relationship between the independent variables and the case/control groups. To ensure the robustness of the logistic regression models, several diagnostic checks were performed. Multicollinearity was assessed using the variance inflation factor (VIF), with all predictors showing VIF values below 2, indicating no significant multicollinearity. Outlier influence was evaluated using Cook’s distance, and no influential observations (Cook’s D > 1) were identified. Model fit was assessed using the Hosmer-Lemeshow goodness-of-fit test, which showed a non-significant result (P > 0.05), indicating an adequate model fit. The area under the curve (AUC) of ROC was calculated to evaluate the model's discriminatory ability. Statistical significance was set at P < 0.05.
4. Results
This study aimed to compare the characteristics of VRS in patients diagnosed with MS with those in a healthy control group. A total of 182 participants were included: Ninty-one patients with MS and 91 age- and gender-matched controls. The mean age of the MS group was 38.6 ± 7.9 years, compared to 35.5 ± 6.4 years in the control group (P = 0.004). Regarding gender, 20 (22%) patients in the MS group were male, compared to 34 (37.4%) in the control group (P = 0.023). These differences were adjusted for in the multivariate analyses. More details can be found in Table 1. The most common reasons for MRI referral in both groups were isolated headache (28.1%), headache and dizziness (20.2%), headache and seizure (19.1%), and limb numbness (10.1%).
Abbreviations: MS, multiple sclerosis; RRMS, relapsing-remitting multiple sclerosis; PPMS, primary-progressive multiple sclerosis; EDSS, Expanded Disability Status Scale.
a Values are expressed as No. (%) or mean ± standard deviation (SD).
b Chi-square test.
c Student's t-test.
In the case group, the mean number of VRS was significantly higher compared to the control group (2.82 vs. 0.67, respectively). This difference was also observed for the mean number of round (1.47 vs. 0.27), oval (0.96 vs. 0.31), and curvilinear (0.48 vs. 0.09) VRS. The mean number of WMLs in the MS group was 14.2 ± 6.8, compared to 1.9 ± 2.3 in the control group (P < 0.001). A moderate positive correlation was observed between the number of WMLs and the number of VRS (r = 0.41, P < 0.001) (Table 2). Mann-Whitney U tests revealed significant differences between the case and control groups for all types of VRS (P < 0.001).
| Variables | Control Group | Case Group | P-Value b |
|---|---|---|---|
| Number of VRS | 0.67 ± 1.97 | 2.83 ± 3.22 | < 0.001 |
| Round shape VRS | 0.27 ± 0.88 | 1.47 ± 1.76 | < 0.001 |
| Oval shape VRS | 0.31 ± 1.07 | 0.96 ± 1.66 | < 0.001 |
| Curvilinear VRS | 0.09 ± 0.38 | 0.48 ± 0.82 | < 0.001 |
| WMLs | 1.9 ± 2.3 | 14.2 ± 6.8 | < 0.001 |
Abbreviations: VRS, Virchow-Robin spaces; WMLs, white matter lesions.
a Values are expressed as mean ± standard deviation (SD).
b Mann-Whitney U test.
The mean and standard deviation of the VRS size in the case and control groups were 2.10 ± 0.62 mm and 1.94 ± 0.24 mm, respectively (P = 0.266). In patients with MS, the mean and standard deviation of disease duration were 9.65 ± 11.72 years, and the mean Expanded Disability Status Scale (EDSS) was 3.36 ± 2.93. No significant correlation was found between age, disease duration, and EDSS scores with the number of VRS in patients with MS (Table 3).
| Variables | Number of VRS | Round | Oval | Curvilinear | Size | Age | Disease Duration | EDSS |
|---|---|---|---|---|---|---|---|---|
| Number of VRS | 1 | - | - | - | - | - | - | - |
| Round | 0.839, P < 0.001 | 1 | - | - | - | - | - | - |
| Oval | 0.748, P < 0.001 | 0.380, P < 0.001 | 1 | - | - | - | - | - |
| Curvilinear | 0.684, P < 0.001 | 0.423, P < 0.001 | 0.482, P < 0.001 | 1 | - | - | - | - |
| Size | 0.141, P = 0.719 | 0.054, P = 0.636 | -0.025, P = 0.851 | 0.025, P = 0.08 | 1 | - | - | - |
| Age | 0.167, P = 0.024 | 0.156, P = 0.035 | 0.123, P = 0.097 | 0.081, P = 0.542 | 0.197, P = 0.082 | 1 | - | - |
| Disease duration | 0.148, P = 0.655 | 0.080, P = 0.459 | 0.015, P = 0.891 | 0.001, P = 0.985 | -0.032, P = 0.809 | 0.128, P = 0.233 | 1 | - |
| EDSS | 0.162, P = 0.126 | 0.133, P = 0.209 | 0.141, P = 0.183 | 0.190, P = 0.172 | 0.105, P = 0.415 | 0.340, P = 0.001 | 0.094, P = 0.374 | 1 |
Abbreviations: VRS, Virchow-Robin spaces; EDSS, Expanded Disability Status Scale.
A comparative analysis of VRS in male and female MS patients revealed no statistically significant differences in terms of quantity or dimensions (Table 4). The analysis of variables associated with MS revealed several significant findings. Females had a higher likelihood of MS compared to males, with a crude odds ratio (ORa) of 2.11 [P = 0.024, 95% confidence interval (CI): 1.10 - 4.06] and an adjusted odds ratio (ORb) of 3.01 (P = 0.007, 95% CI: 1.35 - 6.71). Age was also a significant factor, with each additional year increasing the odds by 1.06 (ORa, P = 0.005, 95% CI: 1.01 - 1.10) and 1.05 (ORb, P = 0.026, 95% CI: 1.001 - 1.10).
| Variables | Male | Female | P-Value b |
|---|---|---|---|
| Number of VRS | 2.00 ± 3.31 | 1.64 ± 2.67 | 0.735 |
| Round shape VRS | 1.00 ± 1.66 | 0.82 ± 1.45 | 0.718 |
| Oval shape VRS | 0.76 ± 1.65 | 0.58 ± 1.29 | 0.790 |
| Curvilinear VRS | 0.61 ± 0.24 | 0.30 ± 0.69 | 0.613 |
| VRS Size | 2.0 ± 0.42 | 2.09 ± 0.62 | 0.779 |
Abbreviation: VRS, Virchow-Robin spaces.
a Values are expressed as mean ± standard deviation (SD).
b Mann-Whitney U test.
The number of VRS was strongly associated with MS in crude analysis (ORa = 1.50, P = 0.001, 95% CI: 1.25 - 1.80), but not in adjusted analysis (ORb = 0.58, P = 0.217, 95% CI: 0.25 - 1.36). Specific shapes of VRS, such as round (ORa = 2.12, P = 0.001, 95% CI: 1.54 - 2.94; ORb = 3.26, P = 0.020, 95% CI: 1.20 - 8.82), oval (ORa = 1.53, P = 0.005, 95% CI: 1.14 - 2.05; ORb = 1.82, P = 0.151, 95% CI: 0.80 - 4.14), and curvilinear (ORa = 3.45, P = 0.001, 95% CI: 1.72 - 6.92; ORb = 3.05, P = 0.043, 95% CI: 1.03 - 8.99), also showed significant associations. However, the size of VRS did not show a significant association with MS (ORa = 2.70, P = 0.296, 95% CI: 0.41 - 17.44). These findings highlight the importance of considering both demographic and anatomical factors in understanding the risk of MS (Table 5).
| Variables | Crude | Adjusted | ||||
|---|---|---|---|---|---|---|
| OR | P-Value | 95% CI | OR | P-Value | 95% CI | |
| Sex (female vs male) | 2.11 | 0.024 | 1.10 - 4.06 | 3.01 | 0.007 | 1.35 - 6.71 |
| Age (y) | 1.06 | 0.005 | 1.01 - 1.10 | 1.05 | 0.026 | 1.001 - 1.10 |
| Number of VRS | 1.50 | 0.001 | 1.25 - 1.80 | 0.58 | 0.217 | 0.25 - 1.36 |
| Round shape VRS | 2.12 | 0.001 | 1.54 - 2.94 | 3.26 | 0.020 | 1.20 - 8.82 |
| Oval shape VRS | 1.53 | 0.005 | 1.14 - 2.05 | 1.82 | 0.151 | 0.80 - 4.14 |
| Curvilinear VRS | 3.45 | 0.001 | 1.72 - 6.92 | 3.05 | 0.043 | 1.03 - 8.99 |
| VRS Size | 2.70 | 0.296 | 0.41 - 17.44 | - | - | - |
Abbreviations: OR, odds ratio; CI, confidence interval; VRS, Virchow-Robin spaces.
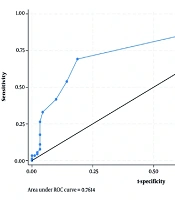
The ROC curve analysis for the number of VRS yielded an AUC of 0.76 (95% CI: 0.69 - 0.82), indicating a good level of diagnostic performance. At the optimal cutoff point (≥ 1 VRS, based on Youden’s Index), the sensitivity was 69.23%, specificity was 81.32%, and the overall classification accuracy was 75.27%, supporting the potential clinical utility of the VRS count (Figure 1).
 in multiple sclerosis (MS) diagnosis")
ROC curve analysis: Virchow-Robin spaces (VRS) in multiple sclerosis (MS) diagnosis
All VRS characteristics, including the number of VRS, round-shaped VRS, oval-shaped VRS, and curvilinear VRS, were not statistically significant when comparing patients with RRMS to those with Primary Progressive MS.
5. Discussion
In the present study, a significant difference was found between the case group (patients with MS) and the control group (individuals without MS) in terms of the number of VRS. The number of VRS was higher in the case group compared to the control group. Our findings align with the results of studies conducted by Al-Saeed et al. in Kuwait and Etemadifar et al. in Isfahan (17, 18).
Al-Saeed et al. (18) reported a significantly higher number of VRS in the supraventricular region of newly diagnosed MS patients compared to controls. However, no significant differences were found in VRS frequency between the two groups in the midbrain, lenticulostriate vessels, or supraventricular WMLs. Etemadifar et al. observed a significantly higher mean number of VRS (21.4 vs. 16.8) in newly diagnosed MS patients compared to healthy controls. Our study, which included both newly diagnosed and previously diagnosed MS patients, found a lower mean number of VRS compared to Etemadifar et al.'s findings. This discrepancy may be attributed to the effects of MS treatment and warrants further investigation (17).
A significant difference was found between the case and control groups in the number of VRS with round, oval, and curvilinear shapes. The case group exhibited a higher frequency of round, oval, and curvilinear VRS compared to the control group. Etemadifar et al. (17) also reported a higher mean number of round and oval VRS in MS patients compared to controls. Conversely, curvilinear VRS were less frequent in the MS group. In a study by Al-Saeed et al. (18), no significant differences were found in the prevalence of VRS in the midbrain, lenticulostriate vessels, and superior WMLs between MS patients and controls. However, dilated VRS were significantly more numerous in the supratentorial region of MS patients. These findings suggest that in patients with MS, not only is the total number of VRS increased, but also the various shapes of VRS are elevated, albeit to varying degrees.
In the present study, the size of VRS in patients with MS was observed to be larger compared to the control group. However, no statistically significant difference was found in the size of these spaces between the case and control groups. A review study by Vivash (3) did not report an increase in the size of dilated VRS in MS patients based on the results of published studies. Conversely, Favaretto et al. (19) found a significantly larger volume of VRS in patients compared to controls when investigating the association between eVRS and cognitive status in MS. Indeed, an increase in the volume of VRS likely corresponds to an increase in their size. The enlargement or dilation of VRS is most probably due to inflammation.
Our study builds upon previous research by Etemadifar et al. and Al-Saeed et al., confirming their findings while also providing new insights through the inclusion of a diverse population, advanced imaging techniques, comprehensive analysis, and examination of clinical subgroups. These enhancements contribute to a more nuanced understanding of VRS in MS (17, 18).
In our study, a significant positive correlation was observed between patient age and both the total number of VRS and the number of round VRS. A notable correlation was also found between age and oval VRS. Small VRS were present in all age groups. As age increased, VRS became more frequent and appeared larger. These findings align with previous research indicating that eVRS are commonly associated with advancing age (2, 8). Furthermore, in our analysis, after controlling for the confounding effect of age, the association between VRS and age remained statistically significant.
Our findings demonstrate that while WMLs remain a robust biomarker for MS diagnosis, VRS — particularly round-shaped VRS — also show significant diagnostic value. The moderate correlation between WMLs and VRS suggests that these markers may reflect overlapping but distinct pathological processes. Unlike WMLs, which represent areas of demyelination, VRS may indicate perivascular inflammation and glymphatic dysfunction. This distinction highlights the potential of VRS as a complementary imaging biomarker in MS.
In the present study, the mean number of VRS was found to be significantly higher in men compared to women, as revealed by logistic regression. Consistent with our findings, Etemadifar et al. (17) reported differences in VRS characteristics between male and female MS patients, with men exhibiting a higher mean number of VRS. Similarly, Favaretto et al. (19) demonstrated a significantly greater number and volume of VRS in male patients compared to female patients.
In the present study, no significant correlation was found between EDSS severity and the number or size of VRS in MS patients. Consistent with our findings, a systematic review by Vivash (3) demonstrated a limited correlation between disease severity and VRS. This suggests that dilated VRS may be a non-specific marker of disease, whether neurological, cardiovascular, or a combination of both. Numerous factors influence the presence of dilated VRS, and more comprehensive studies are needed to control for these factors, not only in MS but also in other neurological and neurodegenerative diseases, to better understand the role of VRS in disease pathogenesis and presentation (3). In a study by Ineichen et al. (2) in the United States, at the tissue level, VRS was not strongly associated with pathological features of MS.
In conclusion, in brain MRI, the number of VRS has been shown to be a useful marker for MS, potentially holding prognostic value. Therefore, it is recommended that patients referred for brain MRI be evaluated for the number and size of VRS. However, it is important to approach these findings with caution and acknowledge the study's limitations. Our study's single-center design limits the generalizability of the findings. Additionally, the retrospective nature of data collection may introduce selection bias. The use of 1.5-T MRI, which may be less sensitive than higher-resolution imaging modalities such as 3-T MRI, could also impact the accuracy of VRS detection. Rather than overstating the implications, future research should focus on conducting prospective studies with larger, better-matched samples to validate these findings and utilizing high-resolution MRI for more accurate detection and assessment of VRS. Systematic reviews and meta-analyses are also suggested to investigate and compare the number and size of VRS in MS patients and healthy individuals.
