


1. Background
Bleeding esophago-gastric junction varices (EGV) represent a critical complication of advanced chronic liver disease, primarily driven by portal hypertension and cirrhosis. The decision to perform upper gastrointestinal endoscopy (UGE) often relies on laboratory markers or radiological findings (1). The early identification of high-risk groups (HRG) carries profound clinical implications. Without timely intervention, these varices pose a 30% annual risk of life-threatening hemorrhage, with mortality rates exceeding 20% within six weeks of the first bleeding episode (2). Current guidelines recommend endoscopic screening, but access to these services remains limited in many regions. Studies indicate that in some countries, over 80% of cirrhotic patients do not receive any endoscopy during their course of care (3). This gap underscores the urgent need for noninvasive tools like computed tomography (CT)-based extracellular volume (ECV) mapping, which can seamlessly integrate into existing hepatocellular carcinoma (HCC) surveillance protocols. By stratifying HRG during routine imaging, clinicians may prioritize endoscopic resources for high-risk patients while avoiding unnecessary procedures in low-risk groups — a critical step toward optimizing outcomes in resource-limited settings.
Both ultrasound and magnetic resonance elastography (USE/MRE) have been validated as tools for predicting life-threatening esophageal variceal bleeding (4-7). Recent studies suggest measuring splenic ECV may improve clinically significant portal hypertension detection (8). Although USE/MRE was initially introduced to quantify liver stiffness as a marker of fibrosis, spleen stiffness has shown superior predictive value for high-risk EGV compared to liver stiffness (9-11). In parallel, ECV fraction derived from contrast-enhanced computed tomography (CT-ECV) has emerged as a valuable parameter in assessing liver fibrosis severity (12-15). While USE/MRE measures increased tissue stiffness due to fibrotic viscoelasticity, CT-derived ECV reflects extracellular matrix expansion associated with collagen deposition, indicating distinct pathophysiological mechanisms (9, 10, 12-15).
Recent advances have enabled the generation of ECV maps by subtracting unenhanced from equilibrium-phase images using nonlinear, nonrigid anatomical correction algorithms, with promising accuracy for noninvasive liver fibrosis staging. Given the routine use of CT imaging in HCC surveillance among patients with cirrhosis, extracting additional data, such as ECV metrics, could enhance clinical decision-making without requiring additional resources (12). However, the prognostic value of splenic ECV in identifying high-risk EGV remains unexplored in the Iranian population.
2. Objectives
This study aims to determine whether splenic ECV derived from CT-based ECV maps can noninvasively predict high-risk EGV and to compare its diagnostic performance with other established clinical and radiologic indicators.
3. Patients and Methods
3.1. Study Design, Patients and Data Collection
This case-control study included patients diagnosed with cirrhosis who were referred to the gastroenterology clinics of a tertiary referral hospital in Tehran between 2019 and 2024. Inclusion criteria comprised patients undergoing UGE or endoscopic treatment for esophageal variceal bleeding within four months of a four-phase contrast-enhanced abdominal CT scan. Patients were excluded if they had received abdominal interventions such as transarterial embolization or percutaneous radiofrequency ablation for HCC or had undergone any abdominal surgery between CT and UGE. Additional exclusion criteria included prior endoscopic treatment for esophageal varices or splenectomy before CT imaging. A total of 62 patients met all inclusion criteria and none of the exclusion criteria (Figure 1).

Patient’s enrollment
Based on endoscopic findings, patients were classified into HRG and non-high-risk (NHRG) groups, serving as case and control respectively. Subsequently, CT-derived variables from the four-phase imaging, performed within four months before endoscopy, were analyzed and compared between groups. Three organ-specific ECV measurements — liver ECV, spleen ECV, and pancreas ECV — were extracted from CT images archived in the hospital’s INFINITT PACS system. Radiologists with expertise in abdominal and pelvic imaging conducted interpretation and measurements. Additional clinical data, including the underlying etiology of liver disease, Child-Pugh and MELD scores, and endoscopy reports, were obtained from the institutional electronic database.
A single experienced gastroenterologist performed all endoscopic evaluations. Esophageal varices were graded according to the Japanese Research Society for Portal Hypertension criteria. High-risk varices were defined as grade 2 (beaded varices), grade 3 (tumorous or tortuous varices), or any varices requiring urgent interventional endoscopy (e.g., band ligation or sclerotherapy) due to imminent risk of hemorrhage (16). The study compared CT-based parameters and clinical characteristics between the HRG and NHRG groups.
Ethical approval was obtained from the AJA University of Medical Sciences Ethics Committee (approval ID: IR.AJAUMS.REC.1402.190), and informed consent was secured from all participants.
3.2. Liver, Spleen, and Pancreas Computed Tomography Protocol and Administration of Contrast
Liver CT scans were performed for HCC surveillance in cirrhotic patients using a 16-slice MX Philips scanner. Each patient received 100 mL of iodinated contrast material [IOHE XOL (OPAQUESOL 350), Shahid Ghazi Pharmaceutical Co.; 350 mg iodine/mL] via intravenous injection using an automatic dual-phase injector (Dual Shot Alpha 7, Nemoto) at a flow rate of 2.5 mL/s. Image acquisition was performed at four predefined phases: Unenhanced (0 seconds), late arterial (25 - 28 seconds), portal venous (70 seconds), and equilibrium (130 - 150 seconds). Scanning ranged from the hepatic dome to the inferior margin of the ischial bones and was completed during a single breath-hold. Acquisition parameters included 16 detector rows, a pitch of 1.00, and a tube voltage of 120 - 130 kVp. Transverse images were reconstructed using raw data at 1.25 mm or 2.5 mm slice thickness, with a field of view (FOV) between 450 and 500 mm.
3.3. Measurements
Two radiologists independently reviewed the liver CT images. The first was a subspecialist in abdominopelvic imaging with ten years of experience (F.S.), and the second was a general radiologist with four years of experience (M.M.M.T.). Both were blinded to the patients' endoscopic findings and clinical esophageal variceal status. All endoscopic examinations were performed by a gastroenterologist with twelve years of experience. The objectives of endoscopy were: (1) To detect endoscopically visible esophageal varices and identify high-risk cases defined as grade 2 or 3 according to the classification of the Japanese Research Society for Portal Hypertension, and (2) to determine the need for immediate interventional therapy, including band ligation or sclerotherapy, based on hemorrhage risk.
Radiologists calculated the ECV using the method described by Tani et al. (17) without using automated ECV mapping software. Instead, the following manual formula was applied:
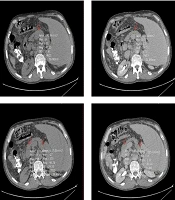
To determine mean Hounsfield units (HU) in both equilibrium and non-contrast phases, circular regions of interest (ROIs) were drawn as large as possible at specific anatomical landmarks. These included the right hepatic lobe at the level of the porta hepatis (Figure 2), the pancreas (head, body, and tail; averaged HU from the three segments was used to represent the whole organ) (Figure 3), and the spleen at its widest cross-sectional area, excluding vessels and focal lesions (Figure 2). An additional ROI with a 15-mm diameter was placed in the abdominal aorta at the level of the renal artery origin (Figure 4).
 was placed as large as possible on axial computed tomography (CT) images in both noncontrast (left) and equilibrium (right) phases. The upper panels show ROI placement in the right hepatic lobe at the level of the porta hepatis, while the lower panels demonstrate ROI positioning within the spleen at its maximum cross-sectional area, excluding visible vessels and focal lesions.")
A circular region of interest (ROI, indicated by red arrows) was placed as large as possible on axial computed tomography (CT) images in both noncontrast (left) and equilibrium (right) phases. The upper panels show ROI placement in the right hepatic lobe at the level of the porta hepatis, while the lower panels demonstrate ROI positioning within the spleen at its maximum cross-sectional area, excluding visible vessels and focal lesions.
 was positioned as large as possible on Axial computed tomography (CT)-scan images (left: Non-contrast phases, right: Equilibrium phases) at three segments of the pancreas: Head and tail (two lower images) and body (two upper images); the average HU value from these parts was used to represent the entire organ.")
A circular region of interest (ROI, indicated by red arrow) was positioned as large as possible on Axial computed tomography (CT)-scan images (left: Non-contrast phases, right: Equilibrium phases) at three segments of the pancreas: Head and tail (two lower images) and body (two upper images); the average HU value from these parts was used to represent the entire organ.
 was placed at the center of the abdominal aorta at the level of the renal artery origin on axial computed tomography (CT) images. The left panel corresponds to the noncontrast phase, and the right panel depicts the equilibrium phase.")
A circular region of interest (ROI, 15 mm in diameter; indicated by red arrow) was placed at the center of the abdominal aorta at the level of the renal artery origin on axial computed tomography (CT) images. The left panel corresponds to the noncontrast phase, and the right panel depicts the equilibrium phase.
Other CT parameters analyzed included: (3) The maximum diameters of the portal vein (PVD), superior mesenteric vein (SMV), and splenic vein during the equilibrium phase; (4) identification of intrahepatic portosystemic shunting during the portal phase; (5) evaluation of splenorenal collateral vessels during the equilibrium phase; (6) splenic volume estimation based on measurements in the x, y, and z axes, using the formula x × y × z × 0.52; (7) detection of prominent vascular structures along the mucosal aspect of the esophago-gastric junction as direct variceal visualization on CT (DV-CT).
3.4. Statistical Analysis
This case-control study enrolled 62 cirrhotic patients treated at a tertiary referral hospital in Tehran between 2019 and 2024. The required minimum sample size was estimated at 48 patients (24 per group), based on the study by Tani et al. (17) and calculated using the formula for two independent means with a 95% confidence level and 80% power:
The parameters used for this estimation included a mean difference in splenic ECV of 5.3 (39.5 vs. 34.2), standard deviations of 2.0 and 5.5 in the high-risk and non–high-risk groups, respectively, a pooled standard deviation of 5.27, and an effect size of 0.9.
Continuous variables included age, spleen volume, MELD score, spleen ECV, liver ECV, pancreas ECV, PVD, splenic vein diameter (SVD), and superior mesenteric vein diameter (SMVD). Categorical variables included sex, esophageal variceal status (HRG vs. NHRG), and Child-Pugh classification. Binary variables included hepatitis B or C status, presence of splenorenal collaterals (SRC), intrahepatic portosystemic shunts (IPS), and direct CT visualization of esophageal varices (DV-CT).
The distribution of continuous variables was assessed using the Kolmogorov-Smirnov test. Normally distributed variables are expressed as mean ± standard deviation, and categorical variables as absolute and relative frequencies. Interobserver agreement between radiologists was evaluated using Cohen’s kappa coefficient for categorical data and the intraclass correlation coefficient (ICC) for continuous measurements. The independent t-test was used for normally distributed continuous variables for univariate analysis, and the Mann-Whitney U test for non-normal distributions. The chi-square or Fisher’s exact test assessed associations between categorical variables. Effect sizes were expressed as odds ratios (ORs) for categorical data and as Cohen’s d with 95% confidence intervals for continuous variables.
Multivariate analysis was conducted using stepwise logistic regression. Variables with P-values less than 0.05 in univariate analysis were included in the model. Model performance and fit were evaluated using the Akaike Information Criterion (AIC), Bayesian Information Criterion (BIC), and coefficient of determination (R2), all reported with 95% confidence intervals. The predictive utility of spleen ECV for identifying high-risk esophageal varices was assessed by receiver operating characteristic (ROC) curve analysis. The optimal cut-off point was determined using Youden’s index. Diagnostic accuracy was reported in terms of area under the curve (AUC), sensitivity, specificity, positive predictive value (PPV), negative predictive value (NPV), and their corresponding 95% confidence intervals.
All statistical analyses were performed using SPSS software, version 27 (IBM Corp., Armonk, NY), and a P-value less than 0.05 was considered statistically significant.
4. Results
A total of 62 patients met the inclusion criteria, comprising 39 men and 23 women, with a mean age of 50.2 ± 11.5 years. Among them, 35 patients were classified as having HRG and 27 as NHRG based on endoscopic findings (Table 1). Two experienced radiologists independently interpreted radiological data, demonstrating excellent interobserver agreement, with a Cohen’s kappa coefficient of 0.88 and an intraclass correlation coefficient (ICC) of 0.94.
| Variables | HRG (n = 35) | NHRG (n = 27) | OR (95% CI) | Cohen's d (95% CI) | Invariable | Multivariable |
|---|---|---|---|---|---|---|
| P-value | ||||||
| Age | 50.7 ± 11.1 | 49.6 ± 12.2 | - | 0.09 (-0.41 to 0.59) | NS | - |
| Gender (M/F) | 23/12 | 16/11 | 1.3 (0.5 - 3.7) | - | NS | - |
| CPS: A/B/C | 0/12/23 | 5/11/11 | 1.9 (1.4 - 3.8) | 0.015 | 0.012 | |
| MELDS | 21.6 ± 4.9 | 20.5 ± 6.4 | - | 0.19 (-0.31 to 0.69) | NS | - |
| Liver ECV | 42.3 ± 5.1 | 34.9 ± 3.3 | - | -0.18 (-0.69 to 0.32) | NS | - |
| Spleen ECV | 44.4 ± 5.1 | 34.9 ± 3.3 | - | 2.14 (1.51 to 2.76) | 0.001 | 0.001 |
| Pancreas ECV | 40.1 ± 12.6 | 43.1 ± 11.9 | - | -0.24 (-0.74 to 0.27) | NS | - |
| Spleen Volume | 38.3 ± 8.3 | 22.7 ± 4.7 | - | 0.77 (0.24 to 1.29) | 0.001 | NS |
| PVD | 13.7 ± 4.4 | 13.3 ± 2.8 | - | 0.13 (-0.38 to 0.63) | NS | - |
| SVD | 10.9 ± 5.2 | 10.2 ± 4.7 | - | 0.29 (-0.22 to 0.79) | NS | - |
| SMVD | 13 ± 2.7 | 12.3 ± 2.2 | - | 0.14 (-0.37 to 0.64) | NS | - |
| SRC (P/N) | 25/10 | 16/11 | 1.7 (0.6 - 4.9) | - | NS | - |
| IPS (P/N) | 3/32 | 2/25 | 1.2 (0.2 - 7.6) | - | NS | - |
| DV-CT (P/N) | 35/0 | 14/13 | 0.3 (0.2 - 0.5) | - | 0.001 | 0.003 |
Abbreviations: HRG, high-risk variceal group; NHRG, non-high-risk variceal group; NS, not significant; M/F, male/female; HCV/HBV, hepatitis C virus/hepatitis B virus; CPS, Child-Pugh score; MELDS, model for End-Stage liver diseases score; ECV, extracellular volume fraction; PVD, portal vein diameter (mm); SVD, splenic vein diameter (mm); SMVD, superior mesenteric vein diameter (mm); SRC, splenorenal collaterals; IPS,intrahepatic portosystemic shunt; DV-CT, direct visualization of esophago-gastric varices on portal phase CT; P/N, positive/negative; OR, odds ratio.
Univariate analysis identified several significant factors differentiating HRG from NHRG. Spleen volume was significantly greater in the HRG group (1009.4 ± 680.3 cm3) compared to the NHRG group (592.2 ± 272.0 cm3; P = 0.002), with an associated Cohen’s d of 0.77 (95% CI: 0.24 - 1.29). Spleen ECV values were markedly higher in the HRG group (44.4 ± 5.1) than in the NHRG group (34.9 ± 3.3; P < 0.001), with a large effect size (Cohen’s d: 2.14; 95% CI: 1.51 - 2.76). Distribution across Child-Pugh classes (A/B/C) differed significantly between the two groups (0/12/23 in HRG vs. 5/11/11 in NHRG; P = 0.015), with an OR of 1.9 (95% CI: 1.4 - 3.8). Furthermore, direct visualization of varices on CT (DV-CT) was strongly associated with high-risk status, being present in all HRG patients (35/0) and absent in over half of the NHRG group (13/14; P = 0.001), with an OR of 0.3 (95% CI: 0.2 - 0.5).
In the multivariate analysis using stepwise logistic regression, spleen ECV, DV-CT findings, and Child-Pugh class remained significant predictors of high-risk esophageal varices. The respective P-values for these variables were 0.001, 0.003, and 0.012 (Table 2).
| Step | Parameter | Action | Chi-square LR | P-value | R2 | AIC | BIC | 95%CI |
|---|---|---|---|---|---|---|---|---|
| 1 | Spleen ECV | Entered | 22.5 | 0.001 | 0.537 | 50.7 | 59.3 | -0.06 , -0.02 |
| 2 | DV-CT | Entered | 5.9 | 0.003 | 0.586 | 33.8 | 42.2 | 0.13, 0.61 |
| 3 | CPS | Entered | 5.5 | 0.012 | 0.626 | 32.2 | 38.5 | -0.29, -0.03 |
Abbreviations: LR, likelihood ratio; AIC, akaike information criterion; BIC, bayesian information criterion; CI, confidence interval; ECV, extracellular volume.
Receiver operating characteristic curve analysis was performed to determine the diagnostic performance of spleen ECV. The optimal cut-off value for spleen ECV was identified at 38.5, yielding a sensitivity of 91.4% (95% CI: 76.9 - 98.2), specificity of 88.9% (95% CI: 70.8 - 97.7), positive predictive value of 92.4% (95% CI: 78.5 - 96.9), and negative predictive value of 95.6% (95% CI: 72.9 - 95.9). The overall diagnostic accuracy was 90.3% (95% CI: 80.2 - 96.4), and the sample's observed prevalence of high-risk varices was 56.5% (95% CI: 43.3 - 69.1). The area under the ROC curve (AUC) was 0.948 (95% CI: 0.896 - 1.000) (Table 3, Figure 5).
| Statistics | Value | 95% confidence interval (lower-upper) |
|---|---|---|
| AUC | 0.984 | 0.896 - 1 |
| Sensitivity (%) | 91.4 | 76.9 - 98.2 |
| Specificity (%) | 88.9 | 70.8 - 97.7 |
| PPV (%) | 92.4 | 78.5 - 96.9 |
| NPV (%) | 95.6 | 72.9 - 95.9 |
| Accuracy (%) | 90.3 | 80.2 - 96.4 |
| Prevalence (%) | 56.5 | 43.3 - 69.1 |
Abbreviations: AUC, area under curve; PPV, positive predictive value; NPV, negative predictive value.
 curve of spleen extracellular volume (ECV); the optimal cut-off value for splenic ECV (also referred to as fractional ECV or ECV) was identified as 38.5, yielding a sensitivity of 91.4% and a specificity of 88.9%. The positive predictive value was 92.4%, and the negative predictive value was 95.6%. The area under the receiver operating characteristic curve (AUC) was 0.948 (95% CI: 0.896 - 1.000). A direct association was observed between higher splenic ECV values and increased risk of esophageal varices.")
Regions of interest (ROIs) curve of spleen extracellular volume (ECV); the optimal cut-off value for splenic ECV (also referred to as fractional ECV or ECV) was identified as 38.5, yielding a sensitivity of 91.4% and a specificity of 88.9%. The positive predictive value was 92.4%, and the negative predictive value was 95.6%. The area under the receiver operating characteristic curve (AUC) was 0.948 (95% CI: 0.896 - 1.000). A direct association was observed between higher splenic ECV values and increased risk of esophageal varices.
5. Discussion
Among the variables examined in this study of 62 cirrhotic patients, only splenic ECV (24 out of 35 patients in the HRGscored above the cutoff value), direct variceal visualization on computed tomography (DV-CT) (35 out of 35 patients in HRG were positive), and Child-Pugh classification (23 out of 35 patients in HRG scored C) independently predicted high-risk EGVs. Receiver operating characteristic curve analysis confirmed the diagnostic utility of splenic ECV, with a cut-off value of 38.5, demonstrating strong discriminatory performance.
The clinical significance of our findings extends beyond technical validation. Identifying HRG through splenic ECV offers a paradigm shift in managing portal hypertension:
- Resource allocation: In regions where endoscopy is scarce, CT-based risk stratification could redirect limited resources to patients with splenic ECV ≥ 38.5, potentially reducing bleeding-related deaths (18).
- Timely intervention: Early detection of HRG enables prophylactic measures (e.g., non-selective β-blockers or band ligation), shown to reduce bleeding risk significantly (19, 20).
- Patient-centered care: For frail patients contraindicated for endoscopy, splenic ECV provides a safer alternative to monitor disease progression.
Splenic ECV emerged as a reliable predictor of high-risk EGV, in contrast to hepatic and pancreatic ECV, which showed no significant association. These findings align with the study by Tani et al. (17), who demonstrated that routine diagnostic CT scans can yield accurate risk stratification through quantitative splenic ECV assessment. The superior predictive value of splenic ECV is likely attributable to its anatomical proximity to gastroesophageal circulation and direct exposure to portal hemodynamic changes. Prior studies have also emphasized that splenic ECV may better reflect venous congestion than hepatic or pancreatic ECV (5-7, 17).
In contrast to several reports, spleen volume did not differ significantly between groups in this cohort. Studies by Tani et al., Sarangapani et al., and Yu et al. identified spleen volume as a significant marker of high-risk EGVs. The discrepancy may result from advanced cirrhotic changes, such as repeated infarctions, that reduce splenic size despite ongoing portal hypertension (17, 21-23).
Direct variceal visualization on computed tomography proved to be a meaningful predictor of high-risk EGVs. This finding aligns with Perri et al. (24), who advocated using abdominal CT to screen large, high-risk varices due to its diagnostic accuracy and cost-effectiveness. Additional support comes from Wan et al. (25) and Yu et al. (26), who highlighted the potential of CT to provide a comprehensive assessment beyond the capabilities of endoscopy, including concurrent evaluation of extraesophageal pathology.
The Child-Pugh classification, which includes total bilirubin, serum albumin, INR, ascites, and hepatic encephalopathy, also significantly distinguished between high-risk and non-high-risk EGVs. Despite the subjectivity of the two components, this score effectively reflects hepatic functional reserve. Although Inkouchi et al. (27), Cherian et al. (28), and Tafarel et al. (29) did not find a significant association, the current findings are consistent with those of Gomaa et al. (30), who reported the Child-Pugh score as a useful risk stratification tool for variceal bleeding.
Unlike the Child-Pugh classification, the MELD score did not correlate with high-risk variceal status. Derived from INR, bilirubin, and creatinine, MELD is commonly used to assess liver disease severity but may lack sensitivity in predicting portal hypertensive complications. Similar results have been reported by Tafarel et al. (29) and Mottaez and Ahadi (31). In contrast, Gomaa et al. (30) found MELD to be a significant predictor of variceal bleeding, suggesting possible differences in patient selection or outcome definitions.
Portal vein diameter was not significantly associated with variceal severity in this study. This is in line with the findings of Zardi et al. (32) but contradicts those of Sarangapani et al. (21), Rani et al. (33), who found increased PVD to be associated with large varices. This inconsistency may reflect variations in imaging techniques, cirrhosis severity, or hemodynamic thresholds (21, 33, 34).
Splenic vein diameter also failed to distinguish between high-risk and non–high-risk EGVs in this cohort. Previous studies by Cherian et al. (28) and Jha et al. (35) reported significant associations, possibly influenced by differing imaging protocols or patient characteristics. This study's absence of predictive value suggests that SVD, similar to PVD, may be insufficient as a standalone marker of variceal risk (28, 35).
5.1. Limitations
This study presents several limitations that should be acknowledged. First, all patients received a uniform dose of 100 mL of contrast medium irrespective of body weight, which may have influenced contrast enhancement dynamics and, consequently, Hounsfield unit measurements. Additionally, variations in the timing of the equilibrium phase and minor inter-scanner differences—particularly between CT machines from different manufacturers—may have introduced variability in quantitative assessments.
Another limitation concerns the qualitative assessment of direct variceal visualization on CT (DV-CT), which was limited to a binary evaluation of presence or absence without further classification or grading of the visualized varices. Although the sample size was determined based on effect size calculations derived from previous studies, it may still be considered modest and thus subject to statistical power limitations.
Due to the retrospective design, the study could not incorporate comparative analysis with magnetic resonance elastography (MRE) or ultrasound elastography (USE), which represents promising modalities for future prospective evaluation. Finally, our study focused on validating splenic ECV in a distinct geographic population, which, while strengthening external validity, may limit its perceived novelty. However, this approach underscores the importance of replicating biomarkers across diverse populations to ensure robustness before widespread adoption.
5.2. Strengths
This study was conducted at a leading referral center in Tehran that routinely manages patients with cirrhosis from across Iran, thereby providing a representative cross-section of the national cirrhotic population. The study's design emphasized the identification of a reliable, noninvasive predictor of high-risk esophageal varices that could be derived from routine imaging data without incurring additional cost, time, or procedural risk beyond standard surveillance protocols for chronic liver disease.
5.3. Conclusions
This investigation demonstrated that splenic ECV, Child-Pugh class, and direct variceal visualization on CT (DV-CT) are significant independent predictors of high-risk esophageal varices in patients with cirrhosis. In contrast, variables such as spleen volume, PVD, SVD, SMVD, SRC, and MELD score did not provide sufficient discriminatory value. These findings support the integration of spleen ECV measurement into routine abdominal CT interpretation as a noninvasive tool for variceal risk stratification in clinical practice.
