


1. Background
Hepatocellular carcinoma (HCC) is the sixth most common malignancy and the fourth leading cause of cancer-related death globally (1, 2). Hepatectomy remains the preferred treatment for early-stage HCC, yet up to 70% of patients may experience recurrence (3). Depending on the size, distribution, and patient tolerance, recurrent tumors in the liver can be managed with surgical resection, radiofrequency ablation, or conservative treatment approaches (4, 5).
Microvascular invasion (MVI) is a crucial pathological feature of HCC, closely associated with tumor aggressiveness (6). For patients eligible for secondary surgery, if the initial tumor was not accompanied by MVI, the presence of MVI in the recurrent tumor may necessitate changes in the surgical approach. Some studies recommend anatomical resection for patients with MVI to prevent tumor spread through the portal vein and thereby reduce recurrence rates (7, 8). Notably, MVI is often found near the tumor's periphery, prompting some studies to suggest expanding the surgical margin for HCC cases with MVI (8, 9). Consequently, accurately predicting the MVI status of recurrent tumors prior to reoperation is of utmost importance.
This study enrolled patients who underwent reoperation due to intrahepatic recurrence of HCC. Preoperative contrast-enhanced magnetic resonance imaging (CE-MRI), clinical characteristics, and the variations in clinical characteristics were utilized to predict the presence of MVI in the recurrent tumor, in order to timely identify MVI in the recurrent tumor and improve patients' prognosis.
2. Objectives
To improve the efficacy of MVI diagnosis in recurrent HCC, this study aims to incorporate the variations of clinical features into preoperative characteristics of CE-MRI.
3. Patients and Methods
3.1. Study Population
This single-center, historical cohort study was approved by the Ethical Committee of the Eastern Hepatobiliary Surgery Hospital (project No: EHBHKY2022-H-P002). Informed consent was waived, as the study did not involve any identifiable personal information. The study was conducted in strict adherence to the principles of the Declaration of Helsinki and followed the Strengthening the Reporting of Observational Studies in Epidemiology (STROBE) guidelines for observational research reporting. A retrospective analysis was conducted on 72 patients who underwent primary HCC surgery at our hospital between January 2016 and December 2023, and later underwent repeat surgery for recurrent HCC (timeframe: March 2017 to December 2024). All patients had definitive pathological results after the two operations. The MVI status was assessed by pathologists and obtained from the patient's case records.
The inclusion criteria were as follows: Patients with primary HCC in the context of hepatitis B, who were classified as stage A according to the Barcelona Clinic Liver Cancer (BCLC) staging system and as Child-Pugh class A, and who underwent re-operation due to intrahepatic recurrence after initial surgical resection, with the tumor being MVI-negative in the initial surgery. Additionally, these patients needed to meet the following conditions: (1) No other treatment, such as neoadjuvant chemotherapy or conversion therapy, was received before the first operation; (2) After the first surgery, the patients received the same postoperative adjuvant therapy, namely transarterial chemoembolization (TACE) after 2 months, and oral anti-hepatitis B virus infection drugs during the follow-up period. They did not receive targeted drugs, immune checkpoint inhibitor therapy, or other special treatments.
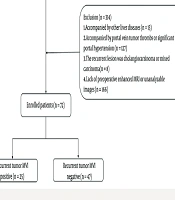
The exclusion criteria for patients were as follows: (1) Thirteen patients were excluded from the study due to concurrent liver diseases, including schistosomiasis (n = 8), Wilson's disease (n = 1), and drug-induced liver injury (n = 4); (2) 127 individuals were excluded for presenting with portal vein tumor thrombus (n = 42) or clinical evidence of significant portal hypertension (e.g., splenomegaly, gastroesophageal varices, or related complications; n = 85); (3) Eight cases were excluded after postoperative pathological examination confirmed recurrent lesions as cholangiocarcinoma (n = 2) or mixed hepatocellular-cholangiocellular carcinoma (n = 6); (4) 166 participants were excluded due to unavailability of preoperative CE-MRI scans, or technically inadequate imaging quality that prevented proper analysis. The specific process of including patients is shown in Figure 1.

The process of including patients
3.2. Contrast-Enhanced Magnetic Resonance Imaging Features Evaluation
MRI scanning was performed using a GE Optima MR360 with a field strength of 1.5T and an 8-channel abdominal surface coil. Patients were asked to fast for 4 hours before the scan and were trained to breathe before the scan. A high-pressure injector was used to inject 0.1 mmol/kg of gadolinium meglumine (GD-DTPA) (manufactured by Jiangsu Hengrui Medicine Co., Ltd.) into the median cubital vein at a flow rate of 2.0 mL/s. After the injection of contrast medium, the enhanced scan time was 20 - 30 seconds for the arterial phase, 50 - 70 seconds for the portal venous phase, and 90 - 120 seconds for the delayed phase.
The precontrast scanning parameters were set as follows: (1) Transverse T1-weighted imaging (T1WI): Repetition Time/Echo Time (TR/TE) = 190/(4.3, 2.1) ms, slice thickness = 6 mm, interval = 2 mm, matrix = 256 × 160, Field of View (FOV) = 44 × 40 cm. (2) Transverse T2-weighted imaging (T2WI): TR/TE = 3000/74 ms, thickness = 8 mm, interval = 2 mm, matrix = 128 × 160, FOV = 44 × 40 cm. Enhancement: 3D Liver Acquisition with Volume Acceleration (LAVA) technology was used for transverse scanning, with TR/TE = 3.6/1.7 ms, thickness/spacing = 5/-2.5 mm, matrix: 256 × 192, FOV = 44 × 40 cm (10).
The following image features based on CE-MRI were evaluated:
1. Size: Defined as the maximum diameter of the tumor, measured at the outer edge of the HCC lesion during the portal phase.
2. Ill-defined pseudocapsule: Defined as tumors without a distinct pseudocapsule or with an irregular pseudocapsule edge. It may appear spiculated, nodular, or partially elevated.
3. Rim arterial enhancement: Defined as ring-shaped enhancement of the tumor margin during the arterial phase.
4. Arterial peritumoral enhancement: Defined as wedge-shaped or patchy enhancement of the normal liver background surrounding the tumor during the arterial phase.
5. Non-smooth margin: Defined as an irregular tumor edge.
6. Multifocality: Defined as HCC with two or more tumors in the liver that are not directly connected by cancerous tissue. Cases with inconsistent imaging features of multifocal lesions were excluded. When analyzing imaging characteristics, only the largest tumor was considered.
The evaluation of CE-MRI features was performed by a radiologist with 5 years of expertise in abdominal MRI interpretation, followed by an independent review by a senior radiologist with over two decades of specialization in hepatic MRI diagnosis. Both reviewers were blinded to the patients' MVI status prior to the image evaluation process. Any discrepancies were resolved through consultation.
3.3. Collection of Clinical Factors
The following preoperative clinical factors were collected from the medical records for both surgeries: Age, gender, alanine aminotransferase (ALT), aspartate aminotransferase (AST), carcinoembryonic antigen (CEA), carbohydrate antigen 19-9 (CA19-9), and alpha-fetoprotein (AFP). Additionally, peripheral white blood cell counts before the two surgeries, including neutrophils, lymphocytes, monocytes, eosinophils, and basophils, were also collected. The variations in clinical features were defined as the difference between the preoperative clinical characteristic values before the second surgery and those before the first surgery.
3.4. Definition of Recurrence Time
All patients underwent follow-up via enhanced MRI (or CT) and clinical laboratory tests one month after the initial surgery, followed by subsequent follow-ups every three months. The recurrence time of HCC was defined as the interval from the initial hepatectomy to the confirmation of recurrence during follow-up (11). Patients with missing follow-up data or those who were lost to follow-up were excluded from the study cohort.
3.5. Statistical Analysis
All statistical analyses were performed using SPSS (IBM Corp. Released 2020. IBM SPSS Statistics for Windows, Version 27.0. Armonk, NY: IBM Corp) and R software (version 4.4.1). For continuous variables, Student's t-test or Mann-Whitney U test was selected according to the distribution. The comparison of categorical variables was performed using the χ2 test or Fisher's exact test. Univariate and multivariate logistic regression analyses were used to identify independent predictors of positive MVI after secondary surgery. Power analysis was employed to evaluate the statistical power of clinical variations, with parameters set as follows: A significance level (α) of 0.05, a two-tailed t-test as the hypothesis testing method, and a sample size of 72. Model 1 was built using the enhanced MRI characteristics and clinical characteristics before the second surgery, while model 2 added variations in clinical features to model 1. The performance of the receiver operating characteristic (ROC) curves was used to evaluate the model, and the area under the curve (AUC) was compared using the DeLong test. The better-performing model was then visualized using a nomogram and evaluated using a calibration curve and decision curve analysis (DCA). The time to recurrence was compared between recurrent tumoral MVI-negative and recurrent tumoral MVI-positive patients using the Log-rank test and visualized using the Kaplan-Meier (K-M) curve. Two-sided P-values of less than 0.05 were considered to indicate statistical significance.
4. Results
Among the 72 patients, 25 recurrent tumors were MVI-positive, including 2 females and 23 males. The age distribution at the first diagnosis of HCC for these patients ranged from 44 to 68 years, and the recurrence time was between 90 and 730 days. Forty-seven recurrent tumors were MVI-negative, of which 9 were female and 38 were male. The age distribution at the first diagnosis of HCC for these patients ranged from 34 to 68 years, and the time to recurrence ranged from 740 to 4015 days. The consistency of enhanced MRI features assessed by the two physicians was high (Cohen's Kappa > 0.9, P < 0.001).
4.1. First Tumor Contrast-Enhanced Magnetic Resonance Imaging and Clinical Features, Not Being Linked to Microvascular Invasion in Recurrent Tumors
CE-MRI features and clinical features of the first tumor were not statistically significantly associated with MVI of the recurrent tumor, as detailed in Table 1.
| First tumor characteristics | Recurrent tumoral MVI positive | Recurrent tumoral MVI negative | t/χ2/Z | P-value |
|---|---|---|---|---|
| Age (y) | 52.7 ± 8.8 | 53.9 ± 8.4 | -0.573 | 0.569 |
| Gender (male) | 22 (0.9) | 39 (0.8) | 0.318 | 0.737 |
| ALT (U/L) | 37.5 ± 24.9 | 36.5 ± 24.8 | 0.154 | 0.878 |
| AST (U/L) | 28.0 ± 15.7 | 35.6 ± 30.3 | -1.176 | 0.243 |
| CEA (ng/mL) | 5.1 ± 11.2 | 2.8 ± 1.2 | 1.025 | 0.165 |
| CA19-9 (U/mL) | 25.8 ± 35.4 | 23.5 ± 17.9 | 0.375 | 0.709 |
| AFP (ng/mL) | 205.1 ± 358.8 | 113.8 ± 252.9 | 1.120 | 0.224 |
| NEU (109/L) | 3.2 ± 0.9 | 2.9 ± 1.0 | 1.146 | 0.256 |
| LYM (109/L) | 1.7 ± 0.6 | 1.6 ± 0.5 | 0.101 | 0.920 |
| MONO (109/L) | 0.4 ± 0.1 | 0.3 ± 0.1 | 0.304 | 0.762 |
| EOS (109/L) | 0.1 ± 0.1 | 0.2 ± 0.2 | -1.683 | 0.097 |
| BASO (109/L) | 0.0 ± 0.0 | 0.0 ± 0.0 | -0.798 | 0.428 |
| Size (cm) | 2.9 ± 1.7 | 3.8 ± 2.0 | -1.767 | 0.082 |
| Pseudocapsule (ill-defined) | 3 (0.1) | 8 (0.2) | 0.318 | 0.737 |
| Rim arterial enhancement | 6 (0.2) | 10 (0.2) | 0.070 | 0.775 |
| Arterial peritumoral enhancement | 2 (0.1) | 8 (0.2) | 1.110 | 0.477 |
| Non-smooth margin | 8 (0.3) | 8 (0.2) | 2.118 | 0.233 |
| Multifocality | 2 (0.1) | 11 (0.2) | 2.617 | 0.196 |
Abbreviations: MVI, microvascular invasion; ALT, alanine aminotransferase; AST, aspartate aminotransferase; CEA, carcinoembryonic antigen; CA19-9, carbohydrate antigen 19-9; AFP, alpha-fetoprotein; NEU, neutrophil count; LYM, lymphocyte; MONO, monocyte; EOS, eosinophil; BASO, basophil.
a Values are expressed as mean ± SD or No. (%).
4.2. Variations in Clinical Features Enhancing Microvascular Invasion Prediction for Recurrent Tumors Over Image-Clinical Features Alone
First, we analyzed the correlation of preoperative imaging and clinical characteristics of recurrent tumors with the recurrent tumoral MVI. The results showed that there was no significant difference in age (years, 57.5 ± 8.4 vs. 56.0 ± 8.6, P = 0.457), ALT (U/L, 34.2 ± 23.1 vs. 47.1 ± 50.0, P = 0.230), AST (U/L, 29.9 ± 14.8 vs. 31.2 ± 16.2, P = 0.719), CEA (ng/mL, 2.9 ± 1.8 vs. 2.8 ± 2.0, P = 0.856), CA19-9 (U/mL, 23.4 ± 22.2 vs. 20.0 ± 18.0, P = 0.495), AFP (ng/mL, 221.2 ± 429.3 vs. 154.1 ± 359.8, P = 0.533), neutrophils ( × 109/L, 3.0 ± 0.9 vs. 3.0 ± 0.9, P = 0.727), lymphocytes ( × 109/L, 1.6 ± 0.5 vs. 1.6 ± 0.4, P = 0.761), monocytes ( × 109/L, 0.4 ± 0.1 vs. 0.4 ± 0.1, P = 0.769), eosinophils ( × 109/L, 0.1 ± 0.1 vs. 0.1 ± 0.1, P = 0.870), basophils ( × 109/L, 0.0 ± 0.0 vs. 0.0 ± 0.0, P = 0.725), and size (cm, 3.1 ± 2.0 vs. 2.7 ± 1.6, P = 0.350) between the recurrent tumoral MVI-negative and positive groups. Among imaging characteristics, arterial peritumoral enhancement, non-smooth margin, and multifocality were correlated with MVI in recurrent tumors, as shown in Figure 2A - C, respectively. Using these, we constructed model 1 to predict MVI in recurrent tumors.

Typical images of A, Arterial peritumoral enhancement; B, Non-smooth margin; and C, Multifocality. Arrows indicate the characteristic radiological features.
Next, we analyzed the correlation between clinical feature variations and MVI in recurrent tumors, and the results indicated that variations in eosinophil counts and tumor size were correlated with MVI in recurrent tumors, as detailed in Table 2. Eosinophil variations (Eos-var) demonstrated a power value of 0.796, while size variations (Size-var) achieved a notably higher power value of 0.922, indicating acceptable statistical power for detecting meaningful associations. By integrating imaging features, we constructed model 2 for prediction. Multivariate logistic regression results showed that variations in eosinophil counts (Eos-var) and non-smooth margin were independent risk factors for the second MVI, as detailed in Table 3.
| Characteristics | MVI positive | MVI negative | t/χ2/Z | P-value |
|---|---|---|---|---|
| Age-var (y) | 4.1 ± 2.9 | 3.1 ± 2.2 | 1.618 | 0.110 |
| Gender (male) | 22 (0.9) | 39 (0.8) | 0.318 | 0.737 |
| ALT-var (U/L) | -1.0 ± 29.0 | 3.3 ± 49.2 | -0.395 | 0.694 |
| AST-var (U/L) | 0.9 ± 15.3 | -4.5 ± 35.9 | 0.714 | 0.477 |
| CEA-var (ng/mL) | -1.8 ± 11.6 | -0.2 ± 1.7 | -0.701 | 0.490 |
| CA19-9-var (U/mL) | 1.7 ± 41.7 | -4.1 ± 27.1 | 0.720 | 0.474 |
| AFP-var (ng/mL) | -32.3 ± 340.7 | 73.7 ± 354.3 | -1.225 | 0.225 |
| NEU-var (109/L) | -0.2 ± 1.2 | 0.0 ± 0.9 | -0.887 | 0.378 |
| LYM-var (109/L) | -0.1 ± 0.7 | -0.1 ± 0.5 | -0.122 | 0.903 |
| MONO-var (109/L) | -0.0 ± 0.1 | 0.0 ± 0.1 | -0.996 | 0.322 |
| EOS-var (109/L) | 0.0 ± 0.1 | -0.0 ± 0.1 | 2.871 | 0.005 b |
| BASO-var (109/L) | 0.0 ± 0.0 | 0.0 ± 0.0 | -0.106 | 0.916 |
| Size-var (109/L) | 0.7 ± 1.9 | -1.1 ± 2.7 | 3.083 | 0.003 b |
| Pseudocapsule (ill-defined) | 7 (0.3) | 7 (0.1) | 1.790 | 0.218 |
| Rim arterial enhancement | 2 (0.1) | 6 (0.1) | 0.375 | 0.705 |
| Arterial peritumoral enhancement | 7 (0.3) | 3 (0.1) | 6.376 | 0.027 b |
| Non-smooth margin | 18 (0.7) | 11 (0.2) | 16.021 | < 0.001 b |
| Multifocality | 8 (0.3) | 3 (0.1) | 8.274 | 0.012 b |
Abbreviations: MVI, microvascular invasion; age-var, age variations; ALT-var, alanine aminotransferase variations; AST-var, aspartate aminotransferase variations; CEA-var, carcinoembryonic antigen variations; CA19-9-var, carbohydrate antigen 19-9 variations; AFP-var, alpha-fetoprotein variations; NEU-var, neutrophil variations; LYM-var, lymphocyte variations; MONO-var, monocyte variations; EOS-var, eosinophil variations; BASO-var, basophil variations; Size-var, size variations.
a Values are expressed as mean ± SD or No. (%).
b Statistically Significant
| Variables | Univariate analysis | Multivariate analysis | ||
|---|---|---|---|---|
| OR (95% CI) | P-value | OR (95% CI) | P-value | |
| Eos-var (109/L) | 2.881 (1.203 - 6.899) | 0.018 | 3.422 (1.169 - 10.018) | 0.025 a |
| Size-var (cm) | 1.324 (1.052 - 1.666) | 0.017 a | 1.291 (0.971 - 1.706) | 0.072 |
| Arterial peritumoral enhancement | 5.704 (1.325 - 24.546) | 0.019 a | 3.259 (0.452 - 23.505) | 0.241 |
| Non-smooth margin | 8.416 (2.791 - 25.375) | < 0.001 a | 4.078 (1.027 - 16.188) | 0.046 a |
| Multifocality | 6.902 (1.635 - 29.135) | 0.009 a | 2.208 (0.334 - 14.593) | 0.411 |
Abbreviations: MVI, microvascular invasion; EOS-var, eosinophil variations; size-var, size variations; OR, odds ratio; CI, confidence interval.
a Statistically Significant
The AUC of model 1 was 0.769 (95% Confidence Interval [CI]: 0.652 - 0.881, P < 0.001), as shown in Figure 3A, and the AUC of model 2 was 0.839 (95% CI: 0.739 - 0.940, P < 0.001), as shown in Figure 3B. The DeLong test showed that there was a statistically significant difference between the two (z = -2.170, P = 0.030), indicating that model 2 performed better. After 5-fold cross-validation, model 1 achieved an AUC of 0.751 (95% CI: 0.617 - 0.884), and model 2 achieved an AUC of 0.807 (95% CI: 0.666 - 0.949). The comparison of sensitivity, specificity, accuracy, positive predictive value (PPV), and negative predictive value (NPV) between the two models after 5-fold cross-validation is detailed in Table 4.
 curve of model 1; B, ROC curve of model 2.")
A, Receiver operating characteristic (ROC) curve of model 1; B, ROC curve of model 2.
| Model | AUC (95% CI) | Sensitivity | Specificity | Accuracy | PPV | NPV |
|---|---|---|---|---|---|---|
| Model 1 | 0.751 (0.617 - 0.884) | 0.737 | 0.684 | 0.719 | 0.824 | 0.565 |
| Model 2 | 0.807 (0.666 - 0.949) | 0.895 | 0.737 | 0.842 | 0.872 | 0.778 |
Abbreviations: AUC, area under the curve; NPV, negative predictive value; PPV, positive predictive value.
The performance of model 2 was comprehensively evaluated through several methods. Initially, the ROC curve of model 2 was presented in Figure 4A, illustrating its discrimination capability. Furthermore, the calibration curve (Figure 4B) was employed to assess the agreement between predicted probabilities and actual outcomes. The Hosmer-Lemeshow Goodness of Fit test confirmed good calibration (χ2 = 11.186, P = 0.191), indicating that the model predictions were well-aligned with observed data. Additionally, DCA (Figure 4C) was conducted, which demonstrated that model 2 provided significant net clinical benefit across low to moderate risk thresholds (0.0 to 0.6), thus serving as a valuable reference for clinical decision-making.
 curve; B, calibration curve; C, decision curve analysis (DCA); and D, nomogram of model 2.")
A, Receiver operating characteristic (ROC) curve; B, calibration curve; C, decision curve analysis (DCA); and D, nomogram of model 2.
To facilitate the application of model 2 and provide a visual tool for risk prediction, a nomogram was constructed and is displayed in Figure 4D. This nomogram allows for the straightforward visualization of how different variables contribute to the overall risk prediction, enhancing the model's utility in practical clinical settings.
4.3. Microvascular Invasion in Secondary Tumors with Shorter Recurrence Times
The recurrence time of recurrent tumors with MVI (median recurrence time 850.0 days [95% CI: 670.5 - 1029.5]) was significantly shorter than that of recurrent tumors without MVI [median recurrence time 1270.0 days (95% CI: 1061.8 - 1478.2)] (log-rank P = 0.010), as shown in Figure 5.
 curves for microvascular invasion (MVI) negative and positive groups in recurrent hepatocellular carcinoma (HCC). The at-risk table below the K-M curve displays the number of patients remaining under follow-up at each time point.")
The Kaplan-Meier (K-M) curves for microvascular invasion (MVI) negative and positive groups in recurrent hepatocellular carcinoma (HCC). The at-risk table below the K-M curve displays the number of patients remaining under follow-up at each time point.
5. Discussion
Given the high recurrence rate of HCC, it is crucial to assess the MVI status of recurrent tumors in advance based on their imaging and clinical characteristics, as this may necessitate a larger surgical area during the second operation and more stringent postoperative monitoring. In this study, we enrolled 72 patients with confirmed recurrence of intrahepatic HCC and analyzed their imaging and clinical characteristics before both the initial and recurrent surgeries. Our findings revealed that the recurrent tumoral MVI was not associated with the characteristics of the primary tumor. Furthermore, the inclusion of the variations in clinical features enhanced the performance of predicting recurrent tumoral MVI. Notably, patients with MVI during recurrence had a significantly shorter time to recurrence compared to those without MVI.
This study found that there was no significant correlation between MVI of recurrent tumors and the imaging and clinical characteristics of the first HCC tumor. Early intrahepatic recurrence (≤ 2 years) was believed to be caused by intrahepatic metastasis of the primary tumor, closely related to the primary tumor itself (12). In contrast, late intrahepatic recurrence (> 2 years) was considered to be associated with the pathogenic factors of HCC, such as persistent liver disease and the emergence of new tumors from different clonal origins within underlying cirrhosis (12). The recurrence time of the 72 patients included in this study ranged from 90 to 4015 days, including early recurrence and late recurrence. In our study, we found that there was no significant correlation between the MVI of recurrent tumors and the imaging and clinical characteristics of the first HCC tumor. Based on previous studies (13-15), it can be concluded that the characteristics of the primary tumor are an important factor affecting the recurrence time, but it is not related to the MVI of recurrent tumors.
The study revealed that incorporating variations in clinical features improved the predictive performance for the occurrence of recurrent tumoral MVI. Reports of MVI after secondary surgery are relatively rare, and most current research focuses on predicting MVI before surgery. Based on previous studies (16-19), the risk factors for MVI include AFP level, tumor size (> 5 cm), pseudocapsule (ill-defined), two-trait predictor of venous invasion (TTPVI), hypoattenuating halo, internal arteries, arterial peritumoral enhancement, arterial ring enhancement, and radiomics score (based on various phases or combinations of different phases of enhanced MRI or CT).
This study introduces an innovative method that combines the variations between the two preoperative stages, focusing on the relative changes in clinical features before the second surgery compared to the first surgery, to observe whether this relative change is related to the recurrent tumoral MVI. The study found that the variations in eosinophil counts and size were correlated with recurrent tumoral MVI, indicating the importance of considering the clinical features of the first tumor as a baseline when considering recurrent tumoral MVI.
Based on previous research findings, it was observed that peripheral eosinophils correlate with intratumoral eosinophils (20). The elevation of eosinophils as a risk factor for recurrent MVI may be attributed to the secretion of vascular endothelial growth factor A (VEGFA) by eosinophils under the stimulation of interleukin-5 (IL-5), which significantly promotes angiogenesis. Additionally, the T helper 2 (Th2) polarization of eosinophils advances tumor progression, increases the contact between tumor cells and blood vessels, and raises the likelihood of MVI (21-23).
Tumor size stands as a representative indicator of tumor aggressiveness. In this study, preoperative clinical indicators at the time of the second surgery were unrelated to recurrent tumoral MVI, but variations in clinical features were found to be correlated, suggesting that these variations may serve as more sensitive indicators. Incorporating variations in clinical features can significantly enhance the predictive performance of MVI, thereby better guiding surgical approaches, selecting appropriate postoperative adjuvant therapies [such as TACE, Hepatic Artery Infusion Chemotherapy (HAIC), immunotherapy, etc.], and implementing more intensive postoperative monitoring. Utilizing changes in eosinophil counts and tumor size can increase confidence in predicting recurrent tumoral MVI.
Among the enrolled patients, those who recurred with MVI-positive tumors had significantly shorter recurrence-free intervals. The MVI is generally regarded as being associated with tumor recurrence, metastasis, and poor prognosis (6, 8, 24, 25). This study supplemented previous research findings, showing that tumors recurring with MVI had shorter recurrence times and required more rigorous postoperative follow-up. Possible factors contributing to this may have included increased eosinophil counts, larger tumor sizes, and imaging features of the secondary tumor. Therefore, it is also necessary to include blood routine tests during the postoperative follow-up period.
This study has several limitations. Firstly, due to strict inclusion and exclusion criteria, only a relatively small number of patients were included in the analysis, which inevitably increased the risk of overfitting in the model. Secondly, as this study is retrospective, it lacks the validation of prospective studies. In addition, peripheral blood cells are dynamically fluctuating over time. Our study's reliance on a single preoperative blood test measurement introduced potential bias, as we did not perform time normalization of clinical variables. Future research should address temporal confounding. At the same time, confounding factors were not fully excluded (e.g., genetic mutations, liver fibrosis status), and the degree of washout on T1-weighted post-contrast images was not included in the analysis and should be incorporated in future studies. Finally, given the rarity of secondary surgery cases, the research results have not been externally validated, which limits the clinical applicability of the model. In the future, larger-scale and prospective studies will be needed to further validate the research results.
In summary, this study enrolled patients who underwent secondary surgical procedures and found that the enhanced MRI of the primary tumor, along with clinical characteristics, were not correlated with MVI in recurrent tumors. By incorporating variations in clinical characteristics, the prediction of MVI in recurrent tumors can be enhanced. Notably, patients with MVI in secondary tumors experienced shorter recurrence intervals. This study has important implications for the management of patients post-HCC surgery, as early identification of MVI in recurrent tumors may lead to improved patient prognosis. Due to the rarity of the number of cases, there are few similar studies. However, this study has made useful explorations for predicting MVI in recurrent HCC, and further large-scale, prospective studies are needed to confirm the clinical applicability of our predictive model.
