


1. Background
Rectal cancer is one of the major causes of cancer mortality in the world (1). MRI is considered as the choice of modality for rectal cancer staging as it provides classification of the mesorectal fascia with high accuracy (2-5). MRI is capable of diagnosing rectal cancer very accurately. T stage (tumor stage) defines the primary tumor site including the depth of tumor invasion. In preoperative T staging of rectal cancer, the reported overall accuracy is 71% - 91% (2). Many studies have shown extramural depth of tumor invasion also known as distance of mesorectal extension (DME) as an independent risk factor for tumor recurrence and overall survival rate (6, 7). The depth of tumor invasion is proportional to the survival, most importantly for T3 rectal cancers (7).
T3 tumors penetrate the muscular layer and invade into the subserosa. T3 rectal cancer is sub-classified as T3a, T3b, T3c and T3d if DME is < 1 mm, 1 - 5 mm, 5 - 15 mm and > 15 mm respectively. The extramural depth of tumor invasion for T3a (< 1 mm) on MRI is too small for measurement and can vary from person to person. Because the distance is very narrow, therefore, the diagnosis might frequently differ from person to person that finally results in the different treatment method. One of the studies suggested that with respect to a 5-year disease free survival rate, there was no significant difference between T3a and T3b or T3c and T3d, but was statistically significant when re-categorized as T3ab and T3cd using 5 mm as cutoff point (8). Many previous studies investigated the prognosis of T3 subdivision using various cutoff points (4 mm, 5 mm, and 6 mm) and came to conclusion that the deeper the tumor invasion, the worst the prognosis (9, 10). Recently, using 5 mm as a cutoff point to differentiate early and advanced T3 rectal cancer is highly acceptable. According to recent studies, patients with a DME more than 5 mm should be identified properly because they have a worse prognosis compared to patients with DME less than 5 mm (11).
In a non-academic setting, non-expert readers evaluate many rectal cancer patients; therefore, in order to avoid over- and under-treatment, a high reproducibility is very crucial. The aim of this study was to categorize the four sub-stages (T3a, T3b, T3c and T3d) into two sub-stages (T3ab, and T3cd) in T3 staged tumor i.e. early-staged T3 tumor (mrDME < 5 mm) and advance-staged T3 tumor (mrDME > 5 mm) to check the reproducibility between the two groups. Because of the narrow measurement limitation of T3a tumor, it proves to be very challenging for non-expert radiologists and may result in varying T3 stage even by expert radiologists.
2. Objectives
To investigate the reproducibility of the distance of mesorectal extension by tumor invasion in T3 stage rectal cancer by evaluating sub-stages T3a, T3b, T3c, and T3d individually versus T3a, T3b (T3ab), T3c, and T3d (T3cd) combined together using MRI.
3. Patients and Methods
Between July 2014 and December 2015, 314 consecutive patients who were diagnosed with rectal cancer using MRI and confirmed by post-surgical pathological test were included in this study. The patients underwent curative surgery and post-surgical pathological test for rectal cancer at Zhongshan hospital affiliated to the Fudan University. The post-surgical pathological test confirmed the tumors as T3 tumors but sub-staging of T3 was not done. Data such as extramural venous invasion (EMVI), nodal status, and location of tumor were also collected but was not used for this specific study. Patients (n = 126) with the following characteristics were excluded from this study: pathological T1/T2/T4 (n = 101), incomplete MRI data (n = 11), preoperative chemo-radiotherapy (n = 9), and history of other cancer diagnoses (n = 5). One hundred eighty-eight patients who were confirmed as T3 stage rectal cancer by the pathological diagnosis were only included in this research. High, mid, and low rectal cancer was categorized according to the location of the tumor (0 - 6 cm, lower rectum; 7 - 11 cm, middle rectum; and 12 - 15 cm, upper rectum) (12). Invasion of the surrounding soft tissue through the external sphincter, but with no other organ invasion were also included in this study and considered as lower T3 rectal tumor (13). After exclusion, we had complete data available for analysis of 188 patients with clinical T3 rectal cancer. The entire process is as shown in the flowchart (Figure 1) and patient demographics characteristics are shown in Table 1.
| Characteristics | Frequency, No. | % |
|---|---|---|
| Sex | ||
| Female | 59 | 31.4 |
| Male | 129 | 68.6 |
| Tumor location | ||
| High | 18 | 9.6 |
| Low | 84 | 44.7 |
| Middle | 86 | 45.7 |
| Pathological vascular invasion | ||
| Negative | 153 | 81.4 |
| Positive | 35 | 18.6 |
| Pathological lymphatic invasion | ||
| Negative | 103 | 54.8 |
| Positive | 85 | 45.2 |
| Pathological perineural invasion | ||
| Negative | 129 | 68.6 |
| Positive | 59 | 31.4 |
| Reader1 T3 sub-staging | ||
| T3a | 10 | 5.3 |
| T3b | 81 | 43.1 |
| T3c | 92 | 48.9 |
| T3d | 5 | 2.7 |
| Reader2 T3 sub-staging | ||
| T3a | 2 | 1.1 |
| T3b | 89 | 47.3 |
| T3c | 94 | 50.0 |
| T3d | 3 | 1.6 |
aThe distribution of general population and the readings carried out by the two readers are shown in the table above. The obvious difference in T3a can be seen between the two readers.

Flowchart of patints' enrollment, data collection and analysis.
3.1. MRI Method
One hundred and eighty-eight patients with primary T3 rectal cancer were assessed by routine coronal, axial, and sagittal MRI at 1.5 or 3.0 T, including T1 weighted image (T1WI), T2 weighted image (T2WI), apparent diffusion coefficient (ADC), diffusion weighted image (DWI), and contrast image. Two radiologists with 12 and 10 years of abdominopelvic MRI reporting experience measured the MRI-predicted DME (mrDME) on the scans, without any knowledge of the prognosis and pathological T staging. All images were evaluated using PACS workstation. Presence or absence of any distant metastasis at imaging and surgery was recorded.
The rectal MRI examinations were done using three different MRI machines (1.5 T Siemens Avanto, 1.5 T Siemens Aera, and 3.0 T Seimens Verio, Siemens Medical Systems, Erlangen, Germany) in our institution. Axial T2 weighted image without fat saturation was used for extramural vascular examination. The MRI protocol in our institution consisted of the following sequences in Table 2. Sagittal T2 weighted image without fat saturation also used the same imaging protocol with the exception that the plane alignment through which images were taken were changed manually according to the location of the tumor.
| Sequence Key Features | Sagittal T2 TSE | ||
|---|---|---|---|
| VERIO 3.0 T | AVANTO 1.5 T | AERA 1.5 T | |
| Repetition time, ms | 3840 | 3000 | 5740 |
| Echo time, ms | 89.0 | 97 | 82.0 |
| Number of slices | 24 | 20 | 25 |
| FOV, mm | 280 | 200 | 280 |
| Base resolution | 320 | 320 | 320 |
| Slice thickness, mm | 5 | 4 | 4 |
| Phase FOV, % | 73.8 | 100 | 100 |
| Distance factor, % | 30 | 0 | 30 |
| Phase encode direction | A > > P | A > > P | H > > F |
| Phase resolution, % | 70 | 85 | 70 |
Abbreviations: FOV, field of view; T, Tesla; T2 TSE, T2-Weighted turbo spin-echo (TSE).
aThree different MRI machines were used for the pelvic imaging. No different machines were used in the same patients for both readers.
3.2. Magnetic Resonance Distance Predicted Mesorectal Extension Criteria (mrDME)
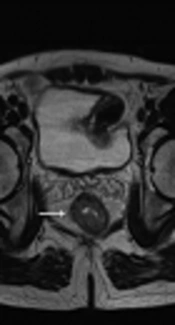
The radiologists used T2 weighted image for the measurement of mrDME and it was performed using the method Miyoshi et al. used. Each reader measured the distance from the outer extreme point of the muscular layer to the most protruded part in the mesorectal layer. The deepest tumor invasion point in serosa was identified. An imaginary line was drawn between two edges of the muscular layer to estimate the outer border if the outer border of the muscular layer was not clearly identified. A dotted line was drawn in case of difficulty in identifying the exact outer border (10, 14) (Figures 2 and 3). Reader 1 repeated the same process thrice and the mean value was obtained. The time interval for repetition of the process by reader 1 was set as two weeks. Reader 2 performed it only once.
. A, The MRI-predicted distance of mesorectal extension (mrDME) measurement of the T3 rectal cancer by reader 1 was 0.81 mm (T3a), the area is shown by the white arrow. B, The mrDME measurement of the T3 rectal cancer by reader 2 was 1.6 mm (T3b); the white arrow shows the area. The black dots are the boundary from which the readers started their measurement.")
Tumor extension is seen beyond muscularis propria (hypointense signal in T2WI). A, The MRI-predicted distance of mesorectal extension (mrDME) measurement of the T3 rectal cancer by reader 1 was 0.81 mm (T3a), the area is shown by the white arrow. B, The mrDME measurement of the T3 rectal cancer by reader 2 was 1.6 mm (T3b); the white arrow shows the area. The black dots are the boundary from which the readers started their measurement.
. A, The MRI-predicted distance of mesorectal extension (mrDME) measurement of the T3 rectal cancer by reader 1 was 3.8 mm (T3b), the area is shown by the white arrow. B, The mrDME measurement of the T3 rectal cancer by reader 2 was 5.1 mm (T3c); the white arrow shows the area. The black dots are the boundary from which the readers started their measurement.")
Tumor extension is seen beyond muscularis propria (hypointense signal in T2WI). A, The MRI-predicted distance of mesorectal extension (mrDME) measurement of the T3 rectal cancer by reader 1 was 3.8 mm (T3b), the area is shown by the white arrow. B, The mrDME measurement of the T3 rectal cancer by reader 2 was 5.1 mm (T3c); the white arrow shows the area. The black dots are the boundary from which the readers started their measurement.
3.3. Statistical Analysis
SPSS (version 21.0, Inc., Chicago, IL) was used to perform statistical analysis. Cohen’s kappa and the intraclass correlation coefficients (ICC) two-way absolute agreement method were computed to compare the readings. The first reading by reader 1 was used to evaluate inter-observer analysis. The mean value of 2nd and 3rd observations was obtained. We then categorized the mean value thus obtained into stages T3a, T3b, T3c and T3d, according to the depth of mesorectal extension (T3a = 0 - 1 mm, T3b = 1 - 5 mm, T3c = 5 - 15 mm, T3d = > 15 mm), which was used for intra-observer analysis. The criteria used for inter-/intra-observer agreements of mrDME measurements using Cohen’s kappa and ICC were set as follows: (Kappa statistics (κ) ranging from -1 to 1, with 1 indicating perfect agreement, 0 indicating completely random agreement, and -1 indicating “perfect” disagreement. Values from 0.0 to 0.2 indicate slight agreement, 0.21 to 0.40 indicate fair agreement, 0.41 to 0.60 indicate moderate agreement, 0.61 to 0.80 indicate substantial agreement, and 0.81 to 1.0 indicate almost perfect or perfect agreement. Similarly, ICCs values less than 0 indicate no agreement, 0 - 0.20 as poor correlation, 0.21 - 0.40 as fair, 0.41 - 0.60 as moderate, 0.61 - 0.80 as substantial, and 0.81 - 1 as excellent) (15, 16). We also performed Bland-Altman analysis between two readers (Figure 4). The mean and difference between two readers were obtained. We performed one sample T test. The P value for one sample T test was obtained which was not statistically significant. So we further calculated upper and lower 95% confidence intervals. Bland-Altman plot was obtained. Finally, we ran a linear regression test to check whether the data had any potential bias. A statistically non-significant P value (P > 0.05) meant there was no proportional bias.
")
Bland-Altman plot between two readers to show reproducibility in T3 rectal cancer; (note: the red line denotes the mean value, green lines are upper and lower bounds of 95% confidence interval)
4. Results
4.1. Demographics
Totally, 188 patients were enrolled in this study. The mean age of the patients was 60.99 ± 11.88 years, 68.6% were male and 31.4% were female. 9.6%, 45.7% and 44.7% of the tumors were found in the high, middle, and low rectal, respectively. The positive pathological vascular invasion, lymphatic invasion and perineural invasion were 81.4%, 54.8%, and 68.6%, respectively. The result for mrDME from reader 1 showed 5.3%, 39.9%, 52.1%, and 2.7% for T3a, T3b, T3c, and T3d, respectively; reader 2 showed 1.6%, 44.7%, 52,1%, and 1.6% for T3a, T3b, T3c, and T3d, respectively.
4.2. MRI Distance of Mesorectal Extension (mrDME)
Mean mrDME for readers 1 was 5.813 ± 3.13 mm and for reader 2 was 5.930 mm ± 2.97 mm (P < 0.05). The inter-observer result after analyzing T3a, T3b, T3c and T3d individually, value for k was 0.700 and for the intra-observer, the value of k was 0.718 (both substantial agreement); the inter-observer intraclass correlation coefficient ICC was 0.772 (95% Cl 0.707 - 0.824) and intra-observer intraclass correlation coefficient ICC was 0.786 (95% Cl 0.725 - 0.835). For T3ab and T3cd after combined together the inter-observer value for k was 0.829 (almost perfect agreement) and for intra-observer study the value of k was 0.796. The inter-observer intraclass correlation coefficient ICC was 0.829 (95% Cl 0.778 - 0.869) and intra-observer intraclass correlation coefficient ICC was 0.796 (95% Cl 0.737 - 0.843).
4.3. ICC Between Two Groups in Two Readers
The overall agreement between two readers increased from 0.772 to 0.829 (Table 3). The inter-observer kappa (k) increased from 0.700 to 0.819 (Table 4). The value above 0.8 is considered as almost perfect and can be used clinically.
| Intraclass correlation coefficient (ICC) | 95% Confidence interval | P value | ||
|---|---|---|---|---|
| Lower Bound | Upper Bound | |||
| T3a vs. T3b vs. T3c vs. T3d | ||||
| Inter-observer | 0.772 | 0.706958 | 0.823824 | < 0.001 |
| Intra-observer | 0.786 | 0.724954 | 0.835336 | < 0.001 |
| T3ab vs. T3cd | ||||
| Inter-observer | 0.829 | 0.778038 | 0.868737 | < 0.001 |
| Intra-observer | 0.796 | 0.736777 | 0.842846 | < 0.001 |
| Parameter | Inter-Observer Kappa (k) | Intra-Observer Kappa (k) | P value |
|---|---|---|---|
| T3a vs. T3b vs. T3c vs. T3d | 0.700 | 0.718 | < 0.001 |
| T3ab vs. T3cd | 0.819 | 0.883 |
aObvious increase in the agreement between the two readers after combining two sub-stages can be seen. ICC and kappa (k) both increased after re-classifying four sub-stages into two sub-stages.
5. Discussion
This study emphasizes the importance of staging T3 rectal tumors into early-staged (T3ab) and advance-staged (T3cd) rather than T3a, T3b, T3c, and T3d individually. Our study supports the concept of dividing T3 rectal cancer into early (DME < 5 mm) and advanced stage (DME > 5 mm) (7, 17, 18). The inter-observer agreement in our study was almost perfect; some studies have also reported the agreement to be good to very good in the sub-classification of T3 tumors with DME cutoff of 5 mm on MR images (19, 20). The reproducibility in inter-observer ICC also increased when sub-stages were combined together. The moderate agreement when sub-stages were measured individually can be doubtful in clinical decision-making. The almost perfect agreement result after two sub-stages combined together could be reliable for clinical decision-making. Statistically, the Bland-Altman analysis also supports our hypothesis with no proportional bias. By looking at these results, we can say that MRI can be used as a reproducible imaging modality for measurement of DME.
5.1. Management for T3 Rectal Cancer
As previous studies have already mentioned, the management and treatment method within T3 tumor differs. Therefore, accurate staging is very essential. The pathological presentation is depicted in Figure 5. According to ESMO clinical practice guidelines for rectal cancer (21), generally the treatment method for T3a and T3b or good group (DME < 5 mm) is the same (surgery alone, and radical dissection using TME method), and for T3c and T3d or intermediate/bad group (DME > 5 mm), the treatment method is similar (preoperative chemoradiotherapy followed by TME). Management consideration (adjuvant chemotherapy after neoadjuvant chemoradiotherapy/surgery regardless of the surgical pathology results) for T3 tumors as a whole without nodal involvement and even T2 rectal cancers are found to be the same (22). However, the clinician makes the final decision for the treatment considering the degree of tumor extension and metastasis. The preoperative staging of rectal cancer tumor has been correlated with the patient’s disease-free survival and prognosis (17, 22). The advantage of pre-operative MRI is that the patients with potentially involved margins can receive neo-adjuvant therapy that results in tumor down- staging so that tumor regression can help the follow-up treatment. There is also debate about the treatment method for T3 rectal cancer patients, whether all patients with T3 should undergo pre-operative chemo-radiotherapy (CRT) or surgery alone (23, 24). However, this way some patients who might not need the preoperative neoadjuvant therapy undergo unnecessary chemo-radiation. Although this might lessen the probability of tumor regeneration, the health situation beside tumor is severely affected by radiation. Our sub-staging model might be useful in considering management criteria.
. Tumor extension (black arrow) beyond the muscularis propria (white arrow) into the serosal fat (black star) can be seen; H & E, original magnification × 10.")
Tumor extension (histopathology). Tumor extension (black arrow) beyond the muscularis propria (white arrow) into the serosal fat (black star) can be seen; H & E, original magnification × 10.
5.2. Re-Categorization of T3 Sub-Staging
MRI not only helps in the pre-treatment examination and accurate diagnosis but also in the post-treatment analysis. DME with less than 5 mm has proved to show a significant higher survival rate, the early T3 tumors can be managed with surgery alone, and the prognosis is comparable to T1/T2 tumors (23). A study conducted by Merket et al. in 2001 showed a 5-year survival rate for the early-staged tumor patients DME < 5 mm (T3ab) was 85% - 90% and for advanced tumor DME > 5 mm (T3cd) was only 54%. Many other studies analyzed the impact of extramural spread (< 5 mm and > 5 mm) with respect to the survival rate in patients with no neoadjuvant chemo therapy or preoperative radiotherapy (6, 10). Other studies have also analyzed the impact of extramural spread with respect to the survival rate in patients with neoadjuvant chemotherapy and preoperative radiotherapy (8, 25). These studies support the fact, patients with DME > 5 mm have worse prognosis compared with DME < 5 mm. In a study of 679 patients with rectal cancer, MERCURY group substantiated DME to be equivalent on MRI and histopathology with a mean difference of less than 0.5 mm (11), it shows that MRI evaluation is almost as accurate as histopathology examination. A study performed by Shin et al. found no significant difference between T3a and T3b or T3c and T3d with respect to the 5-year survival rate but when re-categorized as T3ab (DME < 5 mm) and T3cd (DME < 5 mm), the 5-year survival rate for T3ab was significantly higher than T3cd (8).
Other studies already mentioned that the subdivision, which we proposed in our study, is important not only for the analysis of treatment and predicting survival but also for selecting proper patients for adjuvant and neo-adjuvant treatment (7, 26). The clinical guidelines for neoadjuvant and adjuvant therapy vary from country to country. Patients with less than 5 mm between the tumor border and the mesorectal fascia are given a long-course of preoperative chemo-radiation therapy in some places but also underwent surgery alone in some places (27, 28). Current guidelines recommend preoperative chemo-radiation therapy and post-operative chemotherapy for clinically staged T3, T4 (27). Local recurrence and overall survival in rectal cancer have shown significant improvement, but the risk of side effects such as bowel and sexual dysfunction by unnecessary chemotherapy and radiotherapy that is caused by over-staging and risk of local recurrence due to under-staging is also frequently seen (28-30).
5.3. Limitations of Our Study
Although MRI is able to provide pre-treatment diagnosis and post treatment evaluation with high accuracy, we still consider pathological result as a gold standard. In this study, we lack confirmation of radiological result with pathologic reference standard for the actual depth of extension (T3 sub-staging), but in our defense, a study revealed high agreement (92%) up to 0.5 mm for extramural tumor extension between radiologic and histopathologic diagnosis (11), and this is a reproducibility study rather than accuracy study. Therefore, it should not be criticized from that point of view.
However, our aim was to target the general radiologists who have no specific training in rectal cancer T3 sub-staging. The radiological classification based on our study i.e. early-staged T3 tumor (T3ab) and advanced-staged T3 tumor (T3cd) decreases the variation of sub-staging result compared to individual measurement (T3a, T3b, T3c and T3d). In the future, more studies should be carried out focusing on the treatment decision influenced by T3 sub-staging according to the depth of mesorectal invasion extension in rectal cancer using MRI.
In conclusion, the subdivision of T3 stage tumor into early (< 5 mm) and advanced T3 tumor (> 5 mm) resulted better reproducibility than individually in MRI. This is definitely going to help the non-expert radiologists to determine the accurate treatment method preoperatively by avoiding over- and under-treatment.
