1. Background
Umbilical cord is a vital structure of maternal-fetal life that can be used to evaluate pregnancy outcomes. In the past, sonographic investigations of the umbilical cord were limited to identification of the number of vessels and Doppler evaluation of the blood flow (1, 2). Umbilical cord morphology has been usually studied by pathologists (3, 4). During the past decade, improved ultrasound techniques in measuring the diameter of the umbilical cord and its components resulted in a more advanced perinatal diagnosis (5-7).
Wharton’s jelly (WJ) is a network of glycoprotein microfibrils, collagen fibrils and mostly hyaluronic acid that surrounds the umbilical cord and its vessels (8). It supports adequate blood flow to the fetus (9, 10). Alterations in umbilical cord and WJ area (11, 12), presence of cysts (13), a single artery, and absence of coiling (14) can be signs of adverse pregnancy outcomes. An association has been described between the amount of WJ and some pathologic conditions such as hypertensive disorders (15) and fetal distress (16). Reduction in WJ and umbilical vein area (6) and alternations in WJ proteins (17) can cause preeclampsia. The absence of WJ has been seen in some cases of prenatal mortality (18). Increased diameter of umbilical cord is reported in gestational diabetes (7, 19) and decreased diameter due to umbilical vein reduction and WJ diminution is found in small for gestational age at birth (5, 16, 20, 21).
In order to find any association between the umbilical cord CSA and pregnancy outcome, it is important to know its reference ranges for normal population. The first nomogram of umbilical cord CSA was published in 1994 (22). Thereafter, the reference ranges for umbilical cord CSA and diameter and its association with gestational age and fetal size was introduced for the first time (23). Moreover, a nomogram of WJ and its relation with gestational age and fetal biometric parameters was also established (24). Recently, a reference curve for the cross-sectional area of the umbilical cord, its diameter and the diameter of its vessels was introduced (25).
2. Objectives
With regard to the potential of the umbilical cord in predicting adverse perinatal situations, the aim of this study was to determine reference ranges of the umbilical cord CSA and to find out if umbilical cord CSA and its component parameters have any association with fetal biometric measurements and gestational age.
3. Patients and Methods
A cross-sectional study was carried out at Mahdieh hospital of Shahid Beheshti university of medical sciences, Iran, on a study population of 278 low risk pregnant women between 15 and 41 weeks of gestational age who had been referred to the ultrasound unit for a routine sonographic scan between 2011 and 2012.
Inclusion criteria were: a single pregnancy with a gestational age based on the last menstrual date (LMP) or established by ultrasonography performed until the 15th week; intact membrane; living fetus; normal Doppler flowmetry of the umbilical artery, and amniotic fluid index (AFI) (26) between the 10th and 90th percentiles.
Patients with maternal disease and pregnancy complication such as diabetes, hypertensive disorder, and fetal weight estimation below the 10th percentile and above the 90th percentile for the correspondent gestational age were excluded. Hadlock’s formula (27) was used to estimate fetal weight.
Each patient was included only once. In addition to other parameters routinely evaluated during pregnancy such as placental location, fetus present and fetus sex, biparietal diameter (BPD), head circumference (HC), abdominal circumference (AC), and femur length (FL) were measured for estimating fetal weight. The measurements of the CSA and circumference of the umbilical cord, vein and arteries were done on an adjacent plane to the insertion of umbilical cord into fetal abdomen, placing the markers at its outer borders, with maximum magnification of the image. These values were computed using the software of the ultrasound machine. The CSA and circumference of two arteries were measured. The bigger artery was named 2 and the smaller one was named 1. The WJ area was calculated by subtracting the total vessel area from the umbilical cord area. Three to five measures were performed on each cord, and the average of these measures was used as reference standard. All examinations were performed with Accuvix XQ MYLAB70 device.
Statistical analysis was performed using SPSS for windows, version 16.0 (SPSS Inc. Chicago, IL, USA). First the mean and standard deviation of the CSA of the umbilical cord were calculated in accordance with age and parity. The differences were evaluated using Wilcoxon, Mann-Whitney and Kruskal-Wallis tests for non-parametric data. Mean and standard deviation of the area of the umbilical cord and 5th, 10th, 50th, 90th, and 95th percentiles of it were calculated for each gestational age. Patients were divided into two groups according to gestational age of 30 weeks. The mean and standard deviation of the CSA and circumference of the umbilical cord, vein and arteries were calculated in each group. Pearson correlation coefficient was used to assess the correlation between the measures of the cord and the fetal anthropometric measurements. Results were significant at P < 0.05. Polynomial regression analysis was performed for curves and R2 is presented.
4. Results
A total number of 278 pregnant women were evaluated. The mean age was 27 ± 5.5 years (range: 15 to 40 years). The mean gestational age was 33.7 ± 5.8 weeks. Nulliparous pregnancies included 55% of the patients and 43% of the fetuses were male. Some general characteristics of our study are shown in Table 1. There was no association between the area of umbilical cord, and age and parity. Table 2 shows that the mean of all the umbilical cord parameters are significantly lower in gestational week ≤ 30, so these mean values increased significantly during pregnancy. Table 3 shows descriptive measurements and 5th, 10th, 50th, 90th, and 95th percentiles of the cross-sectional area of the umbilical cord for each gestational age.
| No.(%) | Mean±SD | P Value | |
|---|---|---|---|
| Maternal Age | 0.151 a | ||
| ≤ 29 | 175 (67.0) | 174.7 ± 54.4 | |
| ≥ 30 | 86 (33.0) | 180.7 ± 58.8 | |
| Parity | 0.079 a | ||
| Nullipara | 123 (49.4) | 168.1 ± 50.2 | |
| ≥ 1 | 126 (50.6) | 182.6 ± 58.6 | |
| Parity | 0.156 b | ||
| 0 | 123 (49.4) | 168.1 ± 50.2 | |
| 1 | 86 (34.5) | 182.0 ± 53.2 | |
| 2 | 27 (10.8) | 182.4 ± 71.1 | |
| 3 | 10 (4.0) | 192.5 ± 71.8 | |
| 4 | 2 (0.8) | 130.5 ± 23.3 | |
| 5 | 0 (0.0) | - | |
| 6 | 1 (0.4) | 246.0 |
a Mann-Whitney test.
b Kruskal-Wallis test.
| Mean±SD | No.(%) | P Value | |
|---|---|---|---|
| Umbilical Cord Cross Sectional Area | < 0.001 | ||
| ≤ 30 | 49 (19.1) | 133.2 ± 56.2 | |
| > 30 | 208 (80.9) | 186.4 ± 51.2 | |
| Umbilical Cord Circumference | < 0.001 | ||
| ≤ 30 | 49 (19.1) | 48.0 ± 56.2 | |
| > 30 | 208 (80.9) | 49.2 ± 9.0 | |
| Umbilical Vein Cross Sectional Area | < 0.001 | ||
| ≤ 30 | 48 (18.8) | 33.5 ± 16.7 | |
| > 30 | 207 (81.2) | 52.1 ± 15.6 | |
| Umbilical Vein Circumference | < 0.001 | ||
| ≤ 30 | 48 (18.8) | 22.0 ± 10.3 | |
| > 30 | 207 (81.2) | 26.4 ± 9.7 | |
| First Umbilical Artery Cross Sectional Area | < 0.001 | ||
| ≤ 30 | 45 (18.2) | 12.8 ± 13.0 | |
| > 30 | 202 (81.8) | 15.5 ± 7.7 | |
| First Umbilical Artery Circumference | < 0.001 | ||
| ≤ 30 | 45 (18.3) | 11.7 ± 4.8 | |
| > 30 | 201 (81.7) | 14.4 ± 7.3 | |
| Second Umbilical Artery Cross Sectional Area | < 0.001 | ||
| ≤ 30 | 45 (18.3) | 11.8 ± 12.9 | |
| > 30 | 201 (81.7) | 15.2 ± 8.6 | |
| Second Umbilical Artery Circumference | < 0.001 | ||
| ≤ 30 | 45 (18.3) | 11.6 ± 5.1 | |
| > 30 | 201 (81.7) | 14.0 ± 7.5 | |
| Wharton Jelly Area | < 0.001 | ||
| ≤ 30 | 57 (21.0) | 64.3 ± 47.7 | |
| > 30 | 215 (79.0) | 91.7 ± 46.4 |
| Gestational Age (week) | No.(%) | Mean±SD | Percentiles | ||||
|---|---|---|---|---|---|---|---|
| 5 | 10 | 50 | 90 | 95 | |||
| 15 | 2 (0.7) | ||||||
| 16 | 1 (0.4) | ||||||
| 17 | 1 (0.4) | ||||||
| 18 | 2 (0.7) | ||||||
| 20 | 3 (1.1) | 47.2 ± 33.1 | 9.0 | 9.0 | 65.5 | ||
| 21 | 7 (2.6) | 92.1 ± 23.8 | 67.0 | 67.0 | 84.0 | ||
| 22 | 7 (2.6) | 89.5 ± 33.4 | 28.0 | 28.0 | 96.0 | ||
| 23 | 1 (0.4) | ||||||
| 24 | 4 (1.5) | 99.3 ± 14.2 | 82.5 | 82.5 | 99.3 | ||
| 25 | 7 (2.6) | 145.4 ± 45.5 | 89.0 | 89.0 | 148.0 | ||
| 26 | 5 (1.8) | 166.4 ± 39.0 | 122.0 | 122.0 | 149.0 | ||
| 27 | 1 (0.4) | ||||||
| 28 | 3 (1.1) | 209.9 ± 22.5 | 194.0 | 194.0 | 209.9 | ||
| 29 | 7 (2.6) | 178.9 ± 32.9 | 138.5 | 138.5 | 173.0 | ||
| 30 | 6 (2.2) | 187.8 ± 20.0 | 161.0 | 161.0 | 186.3 | ||
| 31 | 9 (3.3) | 182.4 ± 57.8 | 102.0 | 102.0 | 183.0 | ||
| 32 | 17 (6.2) | 185.2 ± 45.5 | 126.0 | 130.8 | 180.5 | 251.8 | |
| 33 | 15 (5.5) | 181.1 ± 41.9 | 139.0 | 139.8 | 160.0 | 258.4 | |
| 34 | 22 (8.1) | 195.8 ± 55.0 | 42.7 | 133.6 | 202.2 | 270.2 | 292.7 |
| 35 | 19 (7.0) | 187.3 ± 46.7 | 124.0 | 126.1 | 180.6 | 274.2 | |
| 36 | 20 (7.3) | 190.0 ± 36.2 | 124.5 | 139.4 | 189.5 | 245.9 | |
| 37 | 30 (11.0) | 167.4±41.9 | 99.6 | 114.3 | 171.3 | 236.8 | 243.6 |
| 38 | 28 (10.3) | 186.5 ± 37.3 | 118.2 | 141.6 | 179.7 | 243.6 | 253.5 |
| 39 | 30 (11.0) | 198.6 ± 77.7 | 91.5 | 120.7 | 194.9 | 286.6 | 420.6 |
| 40 | 24 (8.8) | 188.2 ± 50.4 | 122.3 | 125.3 | 183.8 | 279.0 | 295.0 |
| 41 | 2 (0.7) | 182.3 ± 78.7 | 126.7 | 126.7 | 182.3 | ||
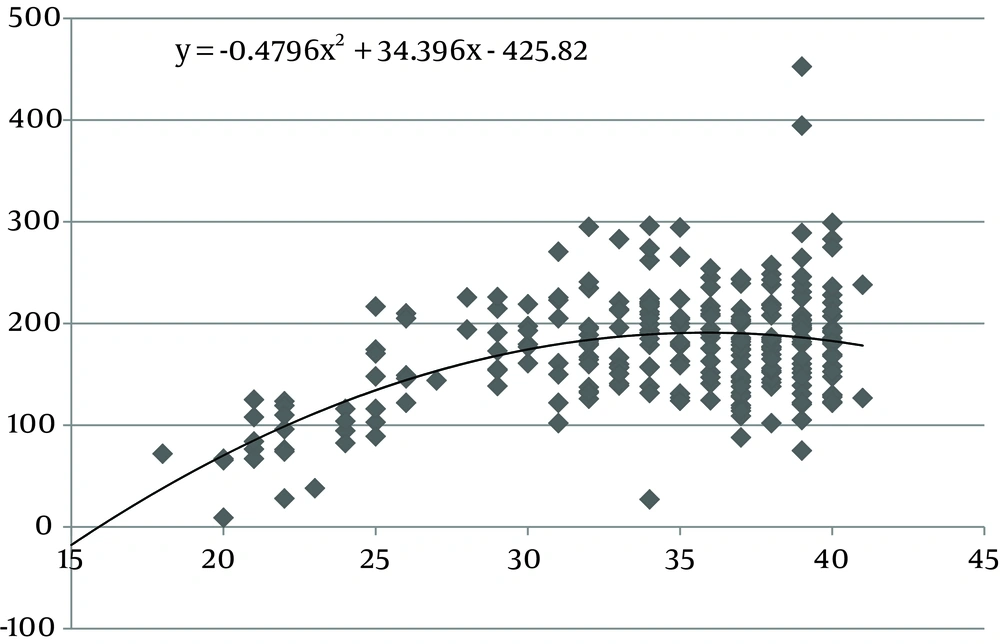
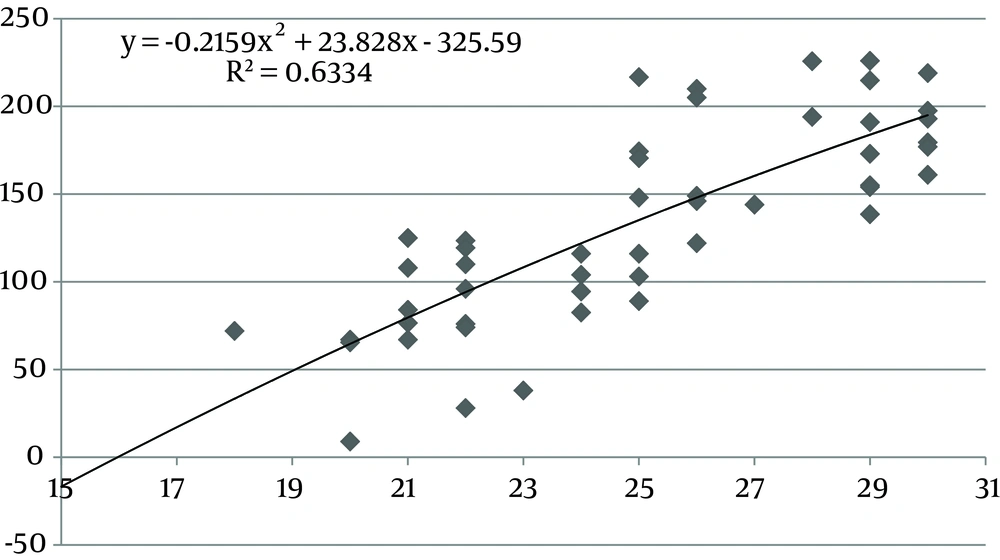
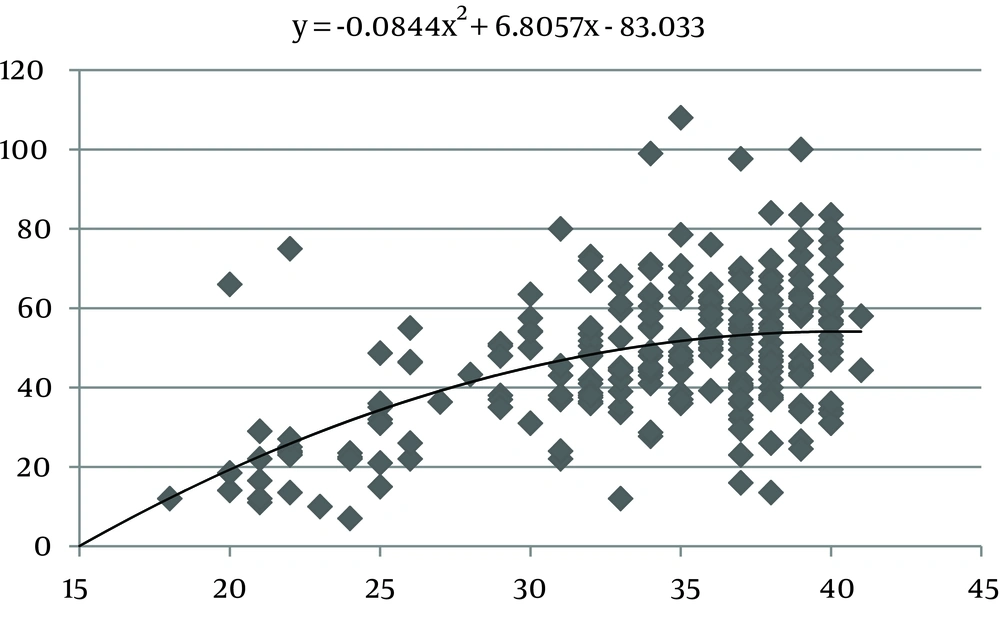
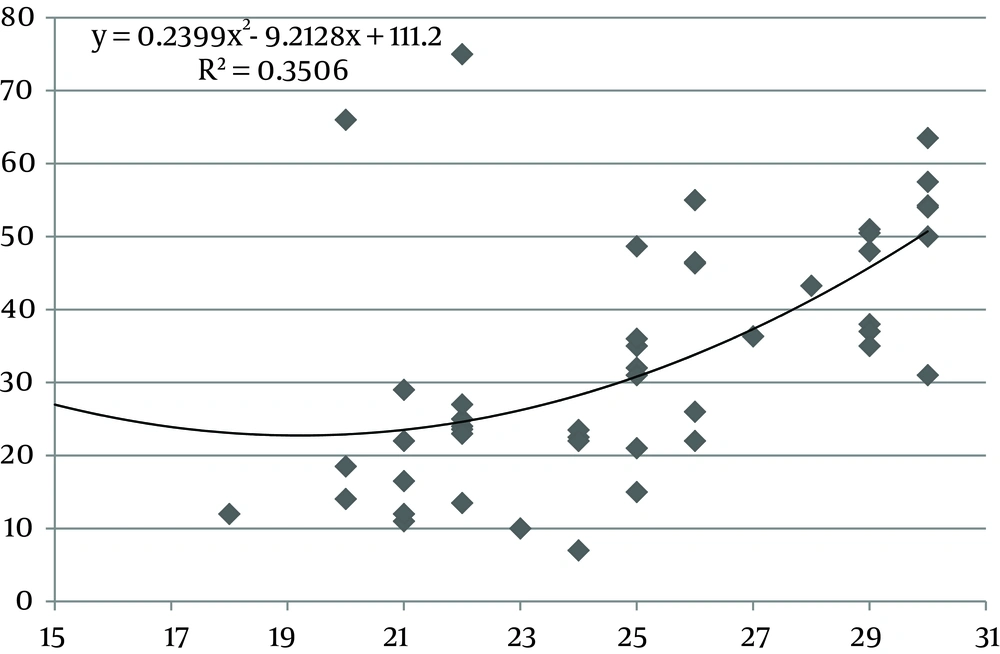
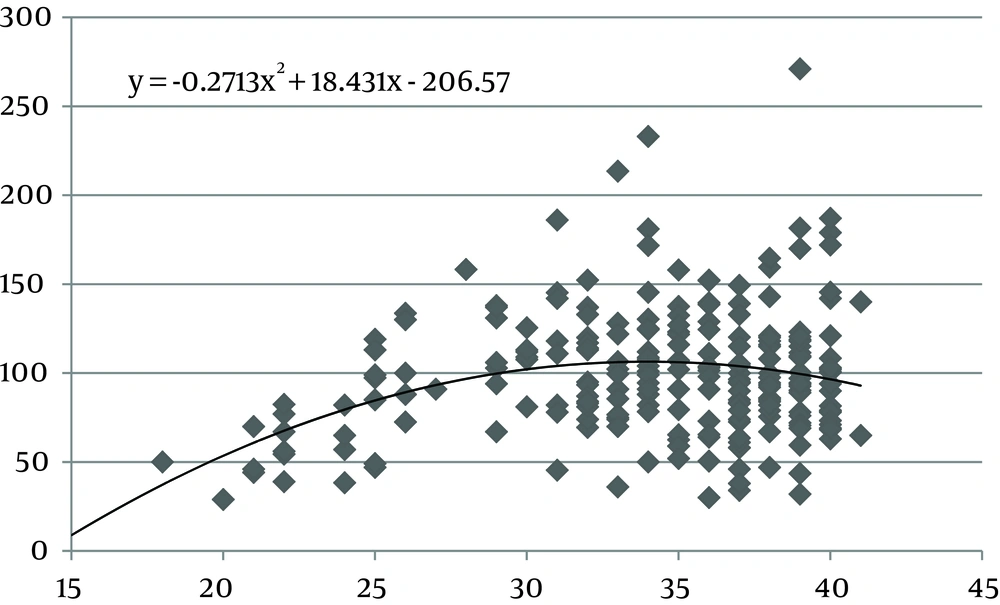
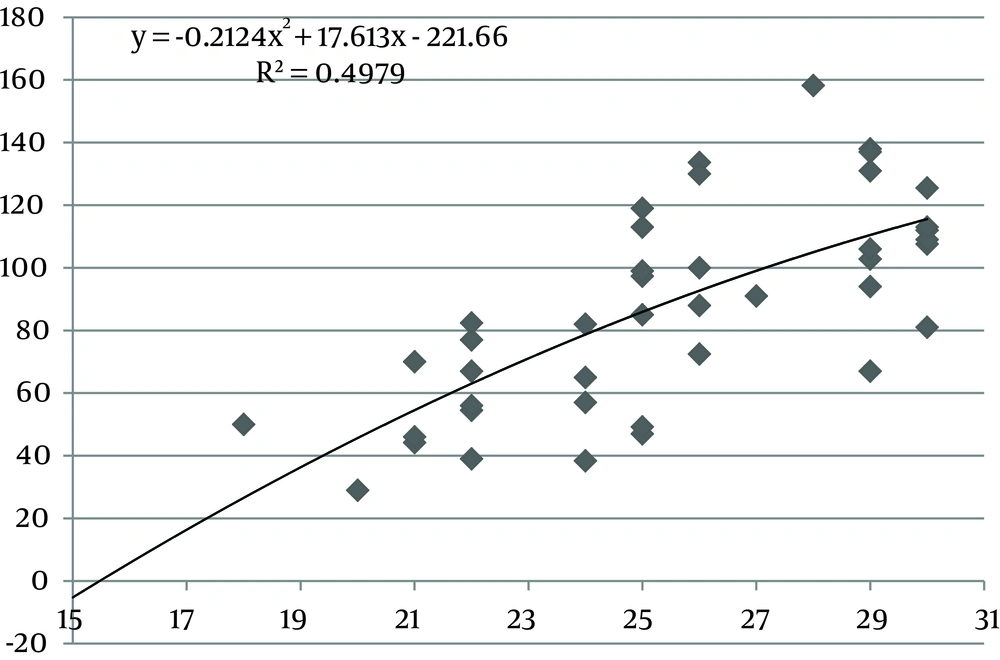
The values of the area of the umbilical cord, umbilical vein and WJ increase consistently until 30 weeks of gestation, after which they reach a plateau (Figures 1, 3 and 5). Figures 2, 4 and 6 show these values in gestational age ≤ 30.
There was a statistically significant correlation between anthropometric measurements and the cross-sectional area of the umbilical cord in ≤ 30 weeks of gestation (CSA and BPD r = 0.77, P < 0.001; CSA and AC r = 0.8, P < 0.001; CSA and FL r = 0.75, P < 0.001; CSA and HC r = 0.6, P < 0.001), umbilical vein CSA (CSA and BDP r = 0.57, P < 0.001; CSA and AC r = 0.57, P < 0.001; area and FL r = 0.57, P < 0.001; area and HC r = 0.37, P < 0.03) and WJ CSA (CSA and BPD r = 0.61, P < 0.001; CSA and AC r = 0.72, P < 0.001; CSA and FL r = 0.68, P < 0.001; CSA and HC r = 0.58, P < 0.001). Mild significant correlation was found between anthropometric measurements and umbilical vein circumference (r = 0.3) and umbilical artery circumference (r = 0.3). No strong correlation was found between anthropometric measurements and umbilical cord circumference, umbilical arteries CSA. There was a significant correlation between gestational age and umbilical cord CSA (r = 0.8, P < 0.001), WJ area (r = 0.73, P < 0.001), umbilical vein CSA (r = 0.57, P < 0.001), umbilical vein circumference (r = 0.34, P < 0.01) and umbilical artery circumference (r = 0.36, P < 0.01).
5. Discussion
In this study we found a significant increase in the CSA and circumference of the umbilical cord, umbilical vein and umbilical arteries during pregnancy. There is a significant consistent increase in the CSA of the umbilical cord, the area of umbilical vein and the CSA of WJ during pregnancy up to 30 weeks. Afterward, these measures remained stable and reached a plateau. During pregnancy, there was a strong correlation between anthropometric measurements and the CSA of the umbilical cord, the CSA of umbilical vein and the CSA of WJ up to 30 weeks.
It has been established that presence of lean umbilical cord with reduced Wharton’s jelly in sonographic scans is a marker for delivery of a fetus at risk of being small for gestational age at birth (5, 16, 20, 21). By improving ultrasound techniques, more studies have been investigating the alterations of the umbilical cord on pregnancy outcomes. Some studies described correlations between the amount of WJ and hypertensive disorder (15), fetal distress (16), preeclampsia (6, 17), and gestational diabetes (7, 19).
Evaluating umbilical cord parameters and comparing them with normal values help us in the early identification of fetal abnormalities. The first study in this field was in 1994 and it showed that the diameter of the umbilical cord and its vessels increase progressively with gestational age until 32 weeks followed by a plateau (22). The second study published reference ranges for umbilical cord diameter and CSA and showed that these values increase with gestational age until 32 weeks and correlate with fetal size (23). Moreover, a nomogram of WJ was also established and it showed that WJ area increases up to 32 weeks and that it correlated with fetal size up to 32 weeks (24). Togni et al. found the same result, but the values increased up to 33 weeks (28). Recently, a reference curve for the cross-sectional area of the umbilical cord, its diameter and the diameter of its vessels was introduced that had the same results as other studies (25). In our study, there was a significant increase in the CSA and circumference of the umbilical cord, umbilical vein and umbilical arteries and WJ area during pregnancy as a function of gestational age. There was a significant consistent increase in the CSA of the umbilical cord, umbilical vein and WJ up to 30 weeks of gestation followed by a plateau. This is consistent with other studies although it reached a plateau earlier (22-25, 28).
WJ is a network of collagen fibrils that has many interconnected cavities. The system of cavities of WJ have a role in storing water and substances of jelly so it can facilitate exchanging trophic metabolites either from or to the umbilical vessels and amniotic fluid (29). Increase in WJ quantities during normal pregnancy is mostly responsible for changes in macroscopic appearance of the umbilical cord in the second and third trimesters (30). Therefore, we expect umbilical cord area and WJ area follow the same pattern during pregnancy.
The ratio of the WJ area to the total umbilical cord area decreases significantly with advancing gestation (24). Also pathological studies have shown that the water content of the umbilical cord is significantly lower in term than in preterm neonates with a progressive reduction from 30 weeks gestation to term (31), so as it has been shown in our study after 30 weeks, water content of the umbilical cord reduced and our nomogram reached a plateau.
The correlation between WJ area and anthropometric measurements up to 30 weeks can be explained by the role of WJ during pregnancy. Pathologists have showed that the cells of WJ can act like smooth muscle cells and participate in the regulation of umbilical blood flow (32). In addition, it has been shown that infants born to women with higher pregnancy weight have more quantities of WJ around their umbilical cord vessels (33).
Our study is limited since our sample size was smaller in comparison to other studies. Besides, because we only performed sonographic scans on pregnant women who came for a routine sonographic scan in one hospital and most of these routine sonogaphic scans are usually not done in the early weeks of pregnancy, our data in those weeks is limited. However, the results of our study support previous observations and it could be due to the strong correlation that exists.
Measuring umbilical cord parameters in routine prenatal ultrasound scan inthe second trimester of pregnancy is an easy measurement technique. It can help us in the early detection of abnormalities in pregnancies such as diabetes mellitus. Therefore, measurement of umbilical cord parameters is highly recommended in the routine prenatal ultrasonography.
