1. Background
Vertical root fractures (VRFs) are usually characterized by an incomplete or complete fracture line that extends along the long axis of the root to different levels of the root (1-3). The major causes for VRFs are root canal treatment and excessive operative procedures performed in the root canal (4). VRF may lead to development of bony lesions; radiographs of which show halos, perilateral radiolucency and angular resorption of the crestal bone (5, 6). Such radiographic findings require clinician to make an accurate diagnosis. In VRF, the fracture runs lengthwise from the crown toward the apex and is usually oriented buccolingually. While the clinical presentation of a VRF can be variable, radiographic signs are quite specific. These signs can vary considerably from case to case, depending on the angle of X-ray beam in relation to the plane of fracture, as well as the duration after the fracture and the degree of separation of the fragments (7). The fracture line is visible in radiographs when the path of X-ray is parallel to the plane of fracture (8). Otherwise, the fracture line is not visible on two-dimensional radiographs, especially in primary stages when the fracture is a tender crack without detached fragments (8, 9). Many cases of VRFs cannot be diagnosed definitively until the extraction of tooth. However, teeth with undiagnosed VRFs are likely to receive endodontic treatment or retreatment, leading to frustration and inappropriate endodontic therapies. General practitioners may correctly diagnose VRFs only after endodontic failures. As a result, complications associated with VRFs are usually considered a consequence of endodontic or restorative procedures (10). In both clinical (11, 12) and ex-vivo (13, 14) studies, cone beam computerized tomography (CBCT) has been used to detect VRFs. CBCT detected twice as many teeth with VRFs as did periapical radiographs (11, 14). Therefore, when CBCT is not used, teeth with VRFs, especially those in the early stages, may be undiagnosed. This lack of diagnosis also indicates that previous estimations of the low prevalence of VRFs may have been underestimated (15, 16). With recent emergence of CBCT in dentistry and its advantages over conventional CT, researchers have been encouraged to assess this relatively new technique for the detection of root fractures (11, 14-20). Image quality has been described as the visibility of diagnostically important structures in the CT image (19, 20). Voxel size has been reported to have a positive correlation with image quality (e.g. contrast and resolution), as well as exposure dose (21, 22). In the literature, a few studies assessed the influence of voxel size on diagnostic ability of CBCT unit in evaluating simulated VRFs.
2. Objectives
This study aimed to assess the use of different voxel resolutions of two different CBCT units in the detection of VFRs in vitro.
3. Materials and Methods
The study involved 74 extracted human mandibular single-rooted premolar teeth without root fractures that had not undergone any root-canal treatments. The teeth used in this study were extracted from patients for orthodontic purposes that had no carious lesions. Fractured, internally resorbed, externally resorbed and acutely curved roots were excluded. Written consent from patients was obtained before the teeth could be used for the study. All teeth were numbered randomly and the observers were blinded to any patient data. The absence of cracks and fractures and the presence of caries on root surfaces were confirmed by stereomicroscopy (PICL-NBX, Nikon, Tokyo, Japan) at 20× magnification. Teeth were placed in 1% hypochlorite solution overnight to remove soft tissues and calculus. Thereafter, teeth were stored in distilled water containing thymol. Afterwards, the crowns were removed 2 mm above the CEJ (cementoenamel junction) with a paper disk. All root canals were instrumented to size 40-60 stainless steel K-files and irrigated with 2% sodium hypochlorite (NaOCl) following each change in instrumentation. Canals were filled with Gutta-percha and endomethasone. Teeth were numbered and randomly assigned for the two groups as a control group consisting of 37 teeth without any fractures and a test group of 37 teeth with fractures. For randomization, lots were drawn by one of the investigator (KO) with writing all numbers of teeth in a paper. The other two calibrated observers (KG, IHA) made the observations regarding the VRF. These two observers were blinded to the status of teeth and performed all examinations without knowing each other. However, observers were aware of the fact that certain teeth were left without fractures.
Teeth were randomly distributed into 37 groups, numbered and placed in empty mandibular premolar sockets of a dry human mandible. VRFs were induced as described by Monaghan et al. (23). Forty-five finger spreader-formed conical wedges that had been shaped by a bur were driven into the root canal apically until a sharp ‘cracking’ sound was heard. This procedure was performed when the teeth were inside the socket. For soft tissue simulation, the mandibles were covered with double layers of boxing wax. Images were obtained from two different CBCT units:
3D Accuitomo 170 (3D Accuitomo; J Morita Mfg. Corp., Kyoto, Japan) with a flat-panel detector offering nine different FOVs-40 × 40, 60 × 60, 80 × 80, 100 × 50, 100 × 100, 140 × 50, 140 × 100, 170 × 50 and 170 × 120 mm. Using the Accuitomo system, images were obtained at 65 kV at 2.0 mA and at an exposure time of 30.8 seconds with a 40 × 40 mm FOV (0.080 mm3 voxel size, radiation dose 1.4 mGy), as well as at 65 kV at 2 mA and at an exposure time of 30.8 seconds with an 60 × 60 mm FOV (0.125 mm3 voxel size, radiation dose 1.7 mGy). All images were taken using the High-Resolution mode. Axial scans and multiplanar reconstructions were obtained. Next, volumetric data were reconstructed using the system software programs to provide serial coronal and sagittal sections along each tooth plane. All images were reconstructed on a 21.3-inch flat-panel color active-matrix TFT medical display (Nio Color 3 MP, Barco, France) with a resolution of 76 Hz 0.2115 mm pitch 10 bit.
NewTom 3G Scanner (Quantitative Radiology, Verona, Italy) with a 1000 × 1000 pixel brilliance amplifier detector. The NewTom 3G scanner offers multiple fields of view (FOVs; 6˝, 9˝, and 12˝), allowing dentist to select the optimum scan on a case-by-case basis. Images were obtained using a 6˝ (0.16 mm3 voxel size, radiation dose 2.2 mGy) and 9˝ (0.25 mm3 voxel size, radiation dose 2.8 mGy) FOV, 0.1 mm-thick axial slices and isotropic voxels. All images were reconstructed on a 21.3 inch-flat panel color active matrix TFT medical display (Nio Color 3 MP, Barco, France) with a resolution of 76 Hz 0.2115 mm pitch 10bit).
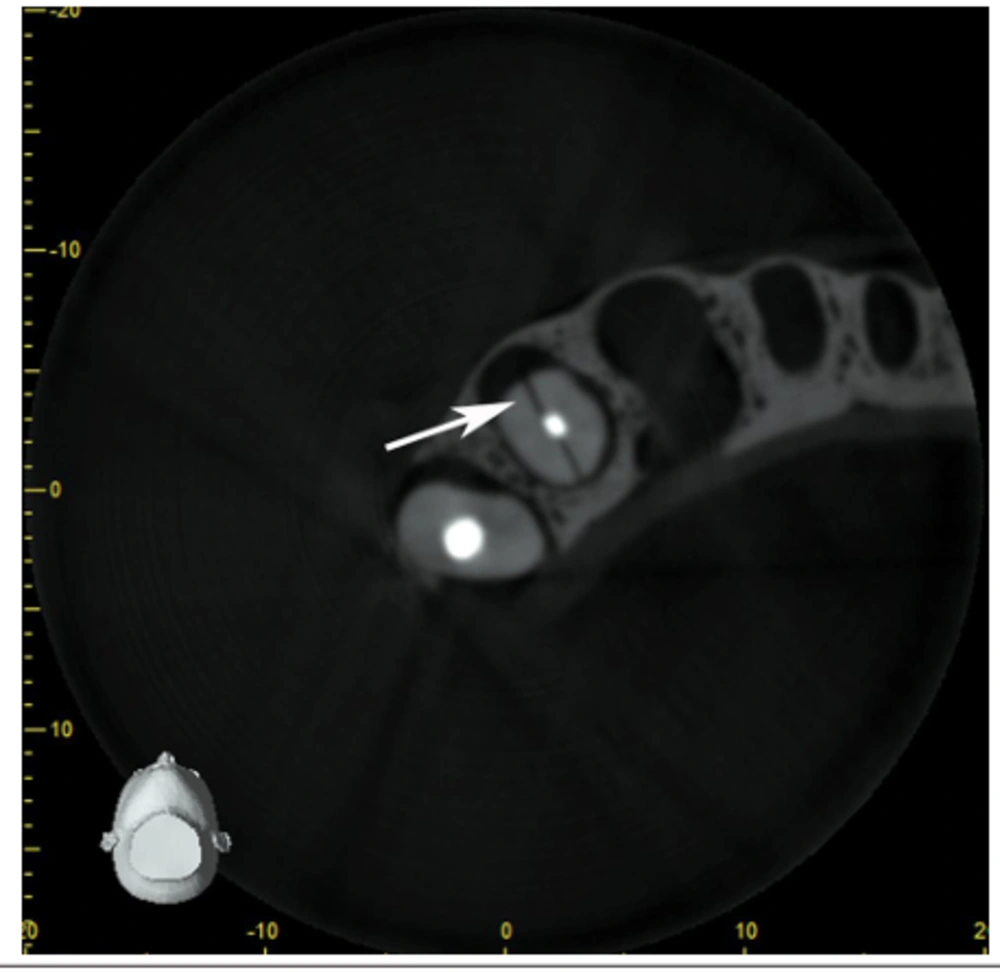
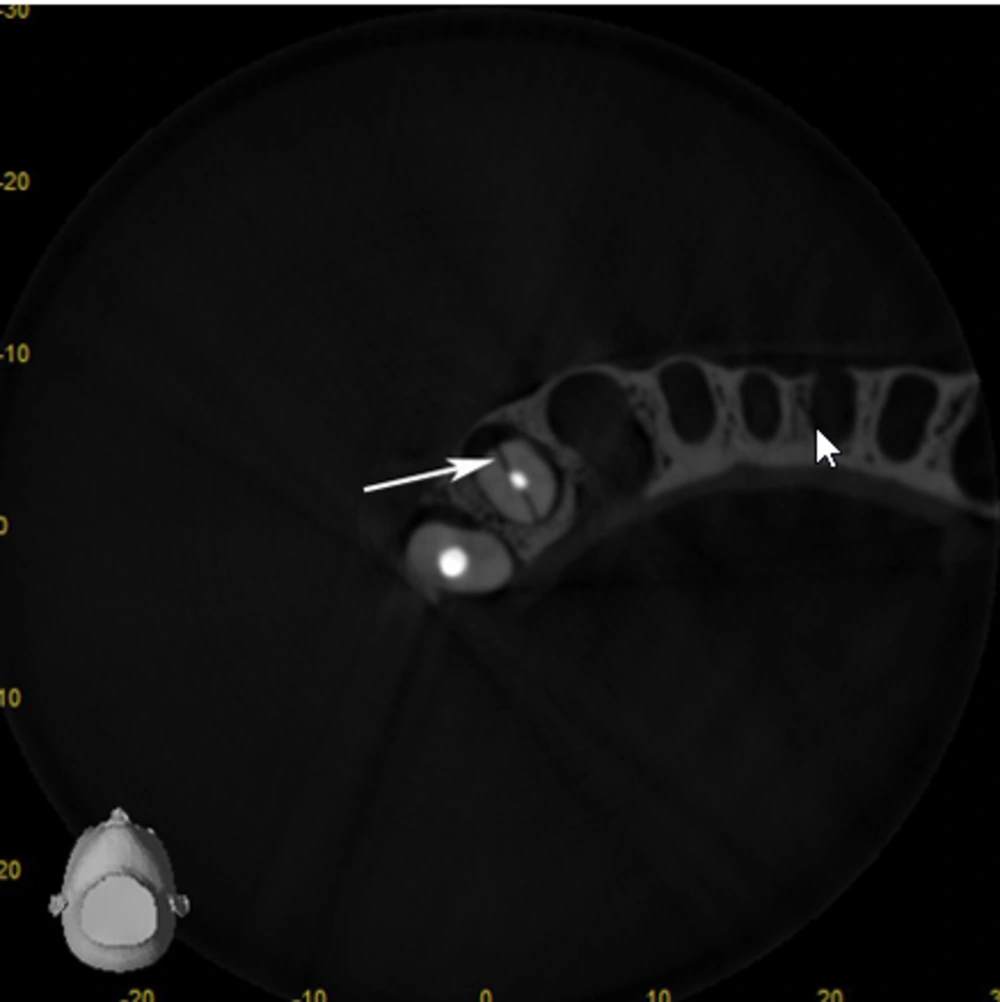
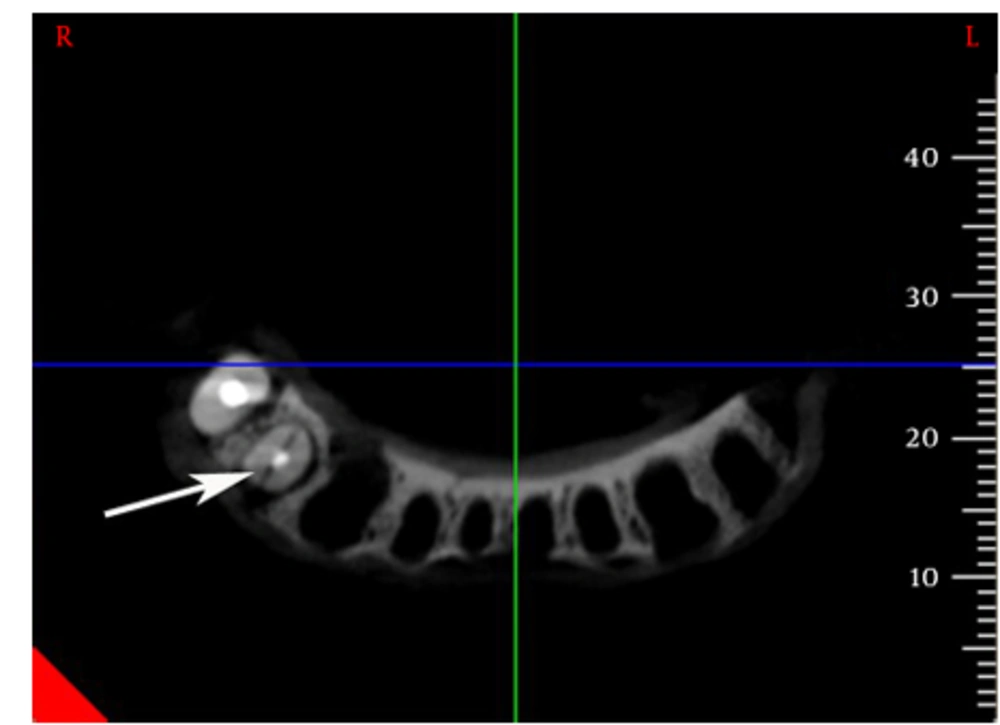
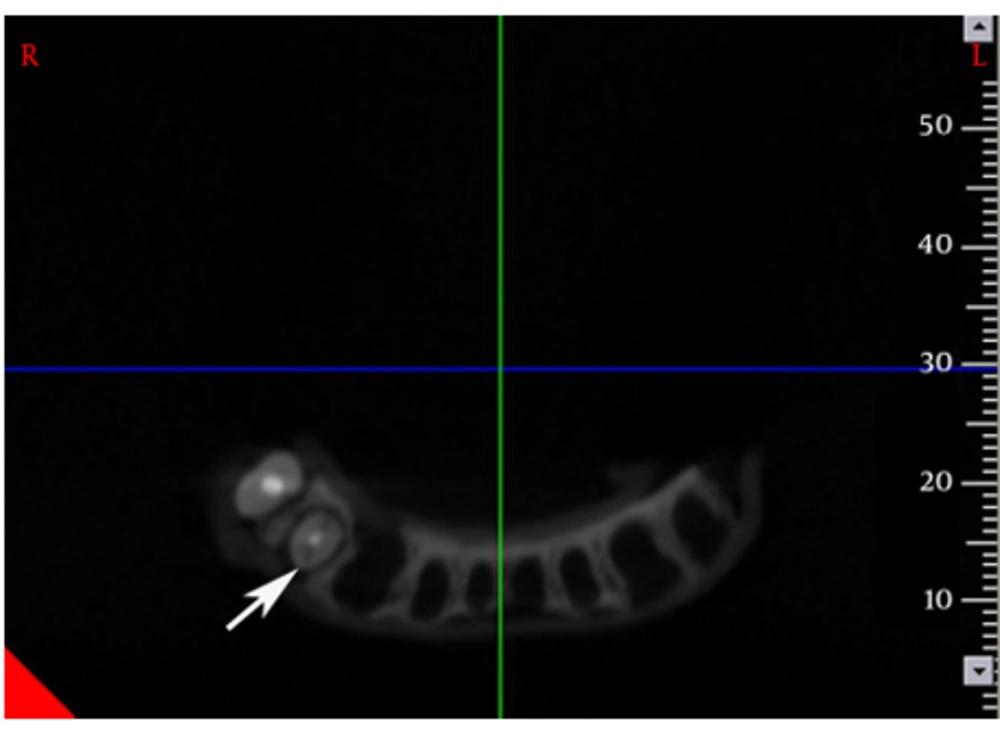
Four image sets were obtained as follows: 1) 3D Accuitomo 170, 4 × 4 cm FOV (0.080 mm3); 2) 3D Accuitomo 170, 6 × 6 cm FOV (0.125 mm3); 3) NewTom 3G, 6˝ (0.16 mm3) and 4) NewTom 3G, 9˝ FOV (0.25 mm3) (Figures 1 - 4). Each image set was evaluated separately in random order by two calibrated observers (KG, IHA) who used the software and enhancement tools of the imaging systems. The observers were performed the study twice with an interval of two months after the initial viewings. All teeth were evaluated randomly for the presence or absence of VRFs and scored using a 5-point scale, as follows; 5 = fracture definitely present; 4 = fracture probably present; 3 = uncertain-unable to tell; 2 = fracture probably not present and 1 = fracture definitely not present. Images were enhanced by two researchers for the desired filter for each session. As a result, observers had to magnify the images. The scores obtained from the observers (HK, IHA) were also recorded by the same investigator (KO) who knew the study design and performed the draw. To avoid any bias, the observers were blinded for any FOV and voxel sizes. Moreover, the observers (KG, IHA) got the images randomly from different protocols.
Kappa coefficients were calculated to assess both intra- and inter-observer agreements for each image set. Scores obtained from (1) 3D Accuitomo 170, 4 × 4 cm FOV (0.080 mm3); (2) 3D Accuitomo 170, 6 × 6 cm FOV (0.125 mm3); (3) NewTom 3G, 6˝ (0.16 mm3) and (4) NewTom 3G, 9˝ FOV (0.25 mm3) were compared with the gold standard via receiver operating characteristic (ROC) analysis to evaluate the observers’ ability to differentiate teeth with or without VRFs. Since it is necessary in ROC analysis to use a diagnostic rating with increasing values indicating a higher probability for diagnosing VRFs, the scoring system could not be directly applied. Thus areas under the ROC curves were used and ranged from 0.5 (no fracture) to 1 (fracture). Cut-offs were obtained by examining any value of the ROC curve regarding its sensitivity and specificity and subsequently predictive values were calculated. The Az values (average Z) were calculated using the NCSS 2007 statistical software (NCSS and GESS, NCSS, LLC. Kaysville, Utah) and the Az values for each image type, observer and reading were compared using z-tests, with a significance level of α = 0.05. In view of this finding, readings from each observer were evaluated independently to determine differences in diagnostic accuracy among the image types.
4. Results
Table 1 shows the intra-observer kappa coefficients calculated for each observer by image type. Higher intra-observer agreement was obtained by comparing images from 3D Accuitomo 170, 4 × 4 cm FOV (0.080 mm3) and 3D Accuitomo 170, 6 × 6 cm FOV (0.125 mm3) with those from NewTom 3G, 6˝ FOV (0.16 mm3) and NewTom 3G, 9˝ FOV (0.25 mm3). Intra-observer kappa coefficients ranged identical values of 0.973 for the 3D Accuitomo 170, 4 × 4 cm FOV (0.080 mm3) images, while ranged from 0.782 to 0.945 for the 3D Accuitomo 170, 6 × 6 cm FOV (0.125 mm3) images, suggesting notably good intra-observer agreement. Table 2 shows inter-observer kappa coefficients for both the first and second readings by image type. Higher inter-observer agreement was obtained from the 3D Accuitomo 170, 4 × 4 cm FOV (0.080 mm3) and 3D Accuitomo 170, 6 × 6 cm FOV (0.125 mm3) images compared with those from NewTom 3G, 6˝ FOV (0.16 mm3) and NewTom 3G, 9˝ FOV (0.25 mm3). Very good inter-observer agreement was found for the first and second readings from the 3D Accuitomo 170, 4 × 4 cm FOV (0.080 mm3) images (i.e. the same as 0.973). Moreover, a good inter-observer agreement was found for the 3D Accuitomo 170, 6 × 6 cm FOV (0.125 mm3) (from 0.888 to 0.946). In general, a good inter-observer agreement was found for the first and second readings for the NewTom 3G, 6˝ FOV (0.16 mm3) and NewTom 3G, 9˝ FOV (0.25 mm3) images.
| Variables | Observer 1 | Observer 2 | ||
|---|---|---|---|---|
| Kappa | SE | Kappa | SE | |
| 3D Accuitomo 170, 4 × 4 cm | 0.973 | 0.027 | 0.973 | 0.027 |
| 3D Accuitomo 170, 6 × 6 cm | 0.782 | 0.071 | 0.945 | 0.038 |
| NewTom 3G, 6˝ | 0.835 | 0.064 | 0.861 | 0.06 |
| NewTom 3G, 9˝ | 0.704 | 0.086 | 0.801 | 0.078 |
Intra-Observer Agreement Calculated for Each Observer by Image Type a
| Variables | First Reading, Obs1-Obs2 | Second Reading, Obs1-Obs2 | ||
|---|---|---|---|---|
| Kappa | SE | Kappa | SE | |
| 3D Accuitomo 170, 4 × 4 cm | 0.973 | 0.027 | 0.973 | 0.027 |
| 3D Accuitomo 170, 6 × 6 cm | 0.888 | 0.054 | 0.946 | 0.038 |
| NewTom 3G, 6˝ | 0.859 | 0.061 | 0.945 | 0.038 |
| NewTom 3G, 9˝ | 0.757 | 0.079 | 0.811 | 0.074 |
Inter-Observer Kappa Coefficients Between Observers For the First and Second Readings a
The areas under the ROC curves (Az values) for different observers, readings and image types were calculated and are shown in Table 3. Higher Az values were obtained for the 3D Accuitomo 170, 4 × 4 cm FOV (0.080 mm3) and 3D Accuitomo 170, 6 × 6 cm FOV (0.125 mm3) images than for the NewTom 3G, 6˝ FOV (0.16 mm3) and NewTom 3G, 9˝ FOV (0.25 mm3) images. The Az values of readings from both observers were higher for the 3D Accuitomo 170, 4 × 4 cm FOV (0.080 mm3) than for the 3D Accuitomo 170, 6 × 6 cm FOV (0.125 mm3) images compared with NewTom 3G, 6˝ FOV (0.16 mm3) and NewTom 3G, 9˝ FOV (0.25 mm3) images.
| Variables | Observer 1 | Observer 2 | ||||||||||
|---|---|---|---|---|---|---|---|---|---|---|---|---|
| First Reading | Second Reading | First Reading | Second Reading | |||||||||
| Az Value | SE | P Value | Az Value | SE | P Value | Az Value | SE | P Value | Az Value | SE | P Value | |
| 3D Accuitomo 170, 4 × 4 cm | 0.9730 | 0.0219 | < 0.0001 | 0.9865 | 0.0156 | < 0.0001 | 0.9865 | 0.0156 | < 0.0001 | 0.9730 | 0.0219 | < 0.0001 |
| 3D Accuitomo 170, 6 × 6 cm | 0.8784 | 0.0442 | < 0.0001 | 0.9865 | 0.0156 | < 0.0001 | 0.9324 | 0.0339 | < 0.0001 | 0.9595 | 0.0267 | < 0.0001 |
| NewTom 3G, 6˝ | 0.9054 | 0.0395 | < 0.0001 | 0.9595 | 0.0267 | < 0.0001 | 0.8919 | 0.0420 | < 0.0001 | 0.9324 | 0.0339 | < 0.0001 |
| NewTom 3G, 9˝ | 0.8784 | 0.0442 | < 0.0001 | 0.8243 | 0.0514 | < 0.0001 | 0.7703 | 0.0568 | < 0.0001 | 0.7973 | 0.0543 | < 0.0001 |
Az Values, Standard Errors and Significance Levels for Both Observers and Their Readings a
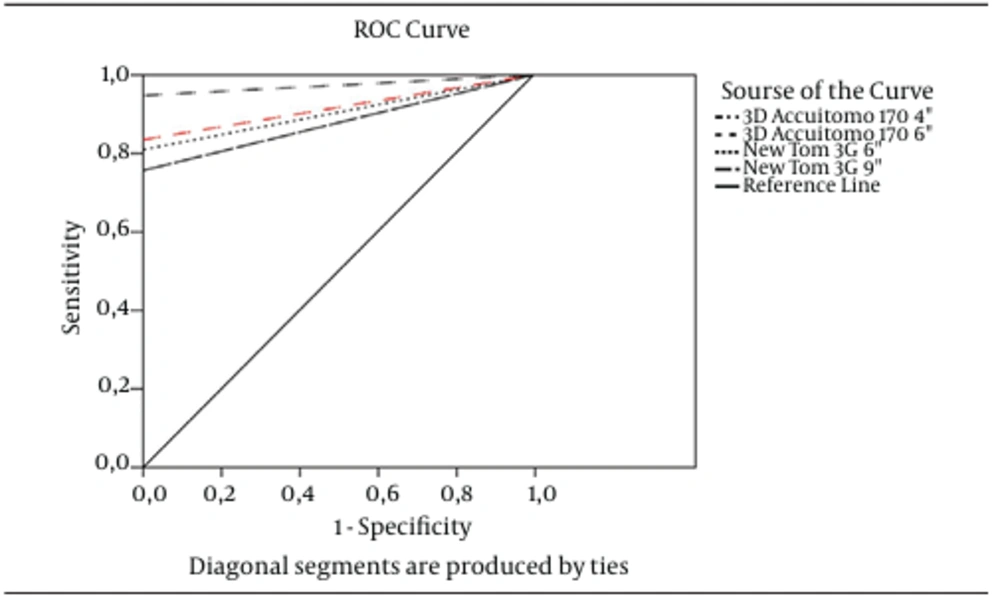
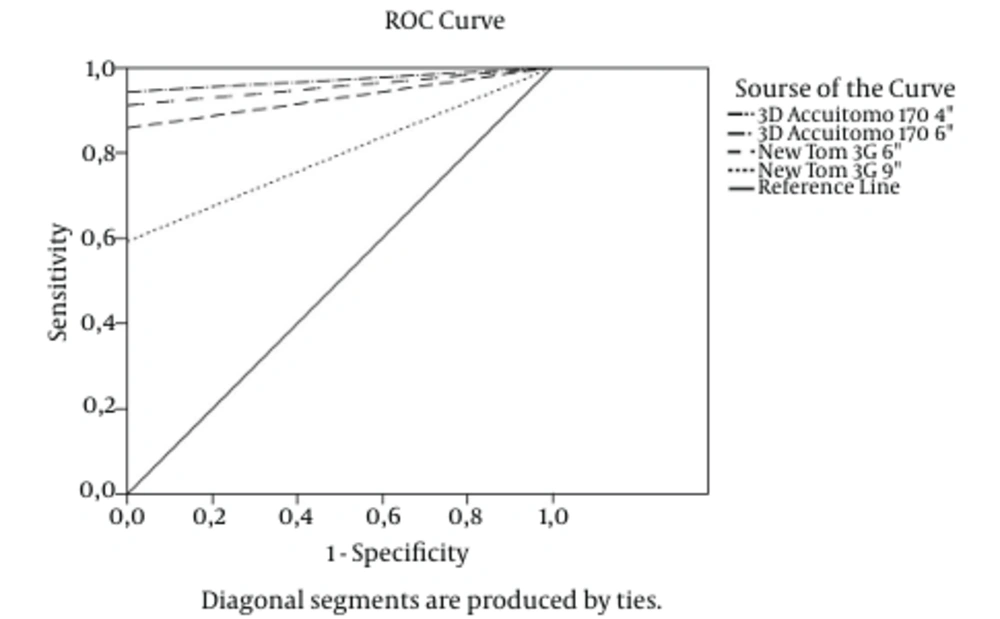
The Az values of the 3D Accuitomo 170, 6 × 6 cm FOV (0.125 mm3) images were also higher than those of NewTom 3G, 6˝ FOV (0.16 mm3) and NewTom 3G, 9˝ FOV (0.25 mm3) with the exception of the first reading by observer one. Figure 5 shows the ROC curves for observer one for the first reading for each image type, while Figure 6 shows the ROC curves for observer two for the second reading for each image type. Comparisons between modalities are shown in Table 4. In Table 4, the Az values are compared according to Z test, which was defined by McClish et al. (24). The table shows the Z test values together with significance between them. P values lower than 0.05 were considered as statistically significant. The first observer yielded the highest Az scores with 3D Accuitomo 170, 4 × 4 cm FOV (0.080 mm3) in the first reading. In addition, the first reading by the second observer also yielded the highest Az scores for the 3D Accuitomo 170, 4 × 4 cm FOV (0.080 mm3). However, in the second readings by both observers, the Az values increased for the 3D Accuitomo 170, 4 × 4 cm FOV (0.080 mm3), 3D Accuitomo 170, 6 × 6 cm FOV (0.125 mm3) and NewTom 3G, 6˝ FOV (0.16 mm3). The reason for the gradually increasing scores may be that both observers started to score images from 3D Accuitomo 170, 4 × 4 cm FOV (0.080 mm3) and later switched to other modalities, which may have increased observer experience with reading images with VRFs. However, NewTom 3G, 9˝ FOV (0.25 mm3) showed the lowest Az values both in the first and second scores, even though the observers presumably became more accustomed to the examination procedures. As such, the 3D Accuitomo 170, 4 × 4 cm FOV (0.080 mm3) was found to be the most efficient and powerful imaging modality for detection of fractures. When NewTom 3G was assessed separately, Az values for 6˝ FOV (0.16 mm3) were higher than those from the 9˝ FOV (0.25 mm3) images, indicating a statistically significant difference. Given the fact that lower Az values for NewTom 3G, 9˝ FOV (0.25 mm3) depend on the size of FOV and image quality of this modality.
| Variables | P Values | |||
|---|---|---|---|---|
| Obs1-1st reading | Obs1-2nd reading | Obs2-1st reading | Obs2-2nd reading | |
| Method 1 | ||||
| 3D Accuitomo 170, 4 × 4 cm | 0.0038 | 1.0000 | 0.0367 | 0.3173 |
| 3D Accuitomo 170, 4 × 4 cm | 0.0177 | 0.1515 | 0.0038 | 0.0747 |
| 3D Accuitomo 170, 4 × 4 cm | 0.0127 | < 0.0001 | < 0.0001 | < 0.0001 |
| 3D Accuitomo 170, 6 × 6 cm | 0.4825 | 0.1515 | 0.2549 | 0.1515 |
| 3D Accuitomo 170, 6 × 6 cm | 1.0000 | < 0.0001 | 0.0007 | < 0.0001 |
| NewTom 3G, 6˝ | 0.4164 | 0.0012 | 0.0028 | 0.0003 |
| Method 2 | ||||
| 3D Accuitomo 170, 6 × 6 cm | 0.0038 | 1.0000 | 0.0367 | 0.3173 |
| NewTom 3G, 6˝ | 0.0177 | 0.1515 | 0.0038 | 0.0747 |
| NewTom 3G, 9˝ | 0.0127 | < 0.0001 | < 0.0001 | < 0.0001 |
| NewTom 3G, 6˝ | 0.4825 | 0.1515 | 0.2549 | 0.1515 |
| NewTom 3G, 9˝ | 1.0000 | < 0.0001 | 0.0007 | < 0.0001 |
| NewTom 3G, 9˝ | 0.4164 | 0.0012 | 0.0028 | 0.0003 |
Comparing Modalities Using t Test With a Significance Level of 0.05 a
5. Discussion
The present study compared the diagnostic accuracy of CBCT scans with different voxel resolutions in the detection of simulated VRFs. Both intra- and inter-observer agreement values were relatively better for 3D Accuitomo 170 images than the images of NewTom 3G. The highest Az and kappa values were obtained with the 3D Accuitomo 170, 4 × 4 cm FOV (0.080 mm3) images. This study evaluated the effects of voxel size on detection of VFRs using two different CBCT systems. Artificially stimulated vertical fractures were used, as previous studies showed them to be the most difficult to detect using intra-oral radiographs. Hassan et al. (14) compared five different CBCTs for the detection of VRFs and reported that the Next Generation i-CAT was the most accurate system (voxel of 0.25 mm) followed by the Scanora 3D (voxel of 0.2 mm), Accuitomo-XYZ (voxel of 0.25 mm), NewTom 3G (voxel of 0.2 mm) and Galileos 3D (voxel of 0.3 mm). Generally, performance was better with the 0.25-mm and 0.2-mm voxel sizes than with the 0.3-mm voxel size. Additionally, in an in vitro study assessing VRF detection using CBCT, Kamburoglu et al. (13) compared two different CBCT units (NewTom 3G and Iluma) with varying resolutions of 0.19-, 0.1- and 0.3-mm3 voxel sizes. They found that 0.19-mm3 and 0.1-mm3 voxel resolutions achieved better results than did the 0.3-mm3 resolution. In another study, Ozer (25) compared the diagnostic accuracy of CBCT scans with different voxel resolutions in the detection of simulated VRFs. This author used only one CBCT (i-CAT) and found no significant differences among different observers or voxel sizes. The sensitivity and specificity results were high for all groups (sensitivity/specificity for 0.125 mm: 98/96; for 0.2 mm: 97/96; for 0.3 mm: 93/93 and for 0.4 mm: 91/93). Wenzel et al. (26) evaluated the diagnostic accuracy of CBCT and a photostimulable storage phosphor plate system (PSP) to detect VRFs. These researchers specifically used i-CAT scanner with 0.125-mm3 and 0.25-mm3 voxel sizes. Higher accuracy was reported with smaller voxel sizes; the 0.125-mm3 voxels showed a specificity of %98 and sensitivity of %87. These authors also reported that the 0.25-mm3 voxel resolution was more accurate than the periapical PSP system. High-resolution scanning was recommended in cases of suspected VRFs that could not be visualized using only periapical images. In the present study, no significant differences were found between observers or voxel sizes, with high Az results reported for all groups. The values revealed that all groups were similar for sensitivity and specificity. The Az results also showed that the 3D Accuitomo 170 (4 × 4 and 6 × 6 cm FOVs) and NewTom 3G, 6˝ FOV (0.16 mm3) systems were better than the NewTom 3G, 9˝ FOV (0.25 mm3) system. Accuracy results also showed that the 0.080-mm3, 0.125-mm3 and 0.16-mm3 resolutions were more successful than the 0.25 -mm3 resolution in detecting VRFs, although the latter two voxel resolutions were acceptable under clinical conditions. Before the newest sensitive flat-panel detectors (CMOS) were developed for CBCT units, a wide FOV required a larger voxel size due to computational limitations (27). First, the resolutions were limited. Even at the smallest voxel size, it was impossible to increase the resolution, which resulted from the focus size of the X-ray tube, the pixel size of the sensor and the precision of the rotation. Second, small voxel sizes led to increased noise (28). In such cases, radiation dose had to be increased to reduce the noise, although this adjustment was impractical based on the principle of ‘‘as low as reasonably achievable’’ (ALARA) (29). Recently, with the advent of new flat-panel technology, smaller FOVs can capture images with less ionizing radiation (30). In this study, charge-coupled device (CCD) and new flat panel technology imaging CBCT devices were used to detect VRFs. Although the devices showed similar results for all FOVs in the detection of VRFs, CCD devices with small FOVs emit more radiation than those with large FOVs. The four different voxel resolutions showed similar results for detecting simulated VRFs. However, if a high-resolution image is required, one should choose a voxel size of 0.080 and a limited FOV (4 × 4 cm) with a standard radiation dose, which may make reconstruction difficult using a personal computer. For instance, with treatment planning of dental implants over large areas, one should choose a voxel size of 0.125 mm3 or 0.16 mm3 and a low radiation dose to improve the noise in the images. In the literature, the effective dose from the cone beam CT units we worked with ranged between 11 and 102 μSv depending on the size of volume used, exposure parameters chosen and examined region (31). 3D Accuitomo 170 (4 × 4 and 6 × 6 cm FOVs) achieved 11-31 and 57-69 μSv (31), while NewTom 3G, 6˝ FOV and 9˝ system had effective dose level of 58-102 μSv (32). However, effective dose from a panoramic radiograph is 13 μSv (32), a cephalometric radiograph, 1-3 μSv (32), a periapical radiograph, 1-8 μSv (33) and an occlusal radiograph, 8 μSv. Despite small-volume CBCT doses being an order of magnitude or more below doses from conventional CT, they are still significantly higher than those from conventional dental radiography. While clinical applications of CBCT have expanded, current CBCT technology has limitations related to the ‘‘cone-beam’’ projection geometry, detector sensitivity and contrast resolution producing images that lack the clarity and usefulness of conventional CT images. The clarity of CBCT images is affected by metallic artifacts, noise and poor soft tissue contrast. However, still CBCT should be considered the most reliable imaging modality for the diagnosis of vertical root fracture as they can avoid scanning structures outside the region of interest susceptible to beam hardening (e.g. metallic restorations, dental implants) (16), although, another method was used in this study for simulating VRFs. Besides, for such studies (esp. for horizontal root fracture studies) joining or unifying the fragmented process is crucial, since if the fractured parts are approximated closely, the fracture line would be unclear and hard to diagnose and vice versa. In addition, making artificial fractures can lead loss of small fragments, which can make eventually a gap when joining the fragments together. Thus, investigators should use a strict standardized protocol when performing such artificial fractures. In the present study, no significant differences were found between observers or voxel sizes and high Az results reported for all groups. 3D Accuitomo 170 (4 × 4 FOV) has the highest sensitivity and diagnostic accuracy for detecting vertical root fracture among radiographic modalities. High-resolution scanning is recommended only in cases of suspected VRFs difficult to visualize using only periapical images.
