


1. Background
2. Objectives
3. Patients and Methods
3.1. Patients Selection
3.2. MR Imaging
3.3. Image Analysis
3.3.1. Visual Evaluation
3.3.2. Quantitative Evaluation


3.4. Statistical Analysis
4. Results
4.1. Visual Evaluation
| Benign Masses | Malignant Masses | |
|---|---|---|
| Number | 40 | 35 |
| Size (mm), mean (SD) | 32.12 (21.75) | 52.63 (21.78) |
| Contour | ||
| Smooth | 81.2 | 22.8 |
| Irregular | 18.8 | 77.2 |
| Internal structure | ||
| Homogeneous | 89.7 | 45.7 |
| Heterogeneous | 10.3 | 54.3 |
| Signal Intensity on T1W image | ||
| Hypointense | 22.7 | 20.3 |
| Isointense | 52.5 | 75.2 |
| Hyperintense | 24.8 | 4.5 |
| Signal Intensity on T2W image | ||
| Hypointense | - | - |
| Isointense | 17.2 | 3.2 |
| Hyperintense | 82.8 | 96.8 |
aValues are expressed as % unless otherwise indicated.
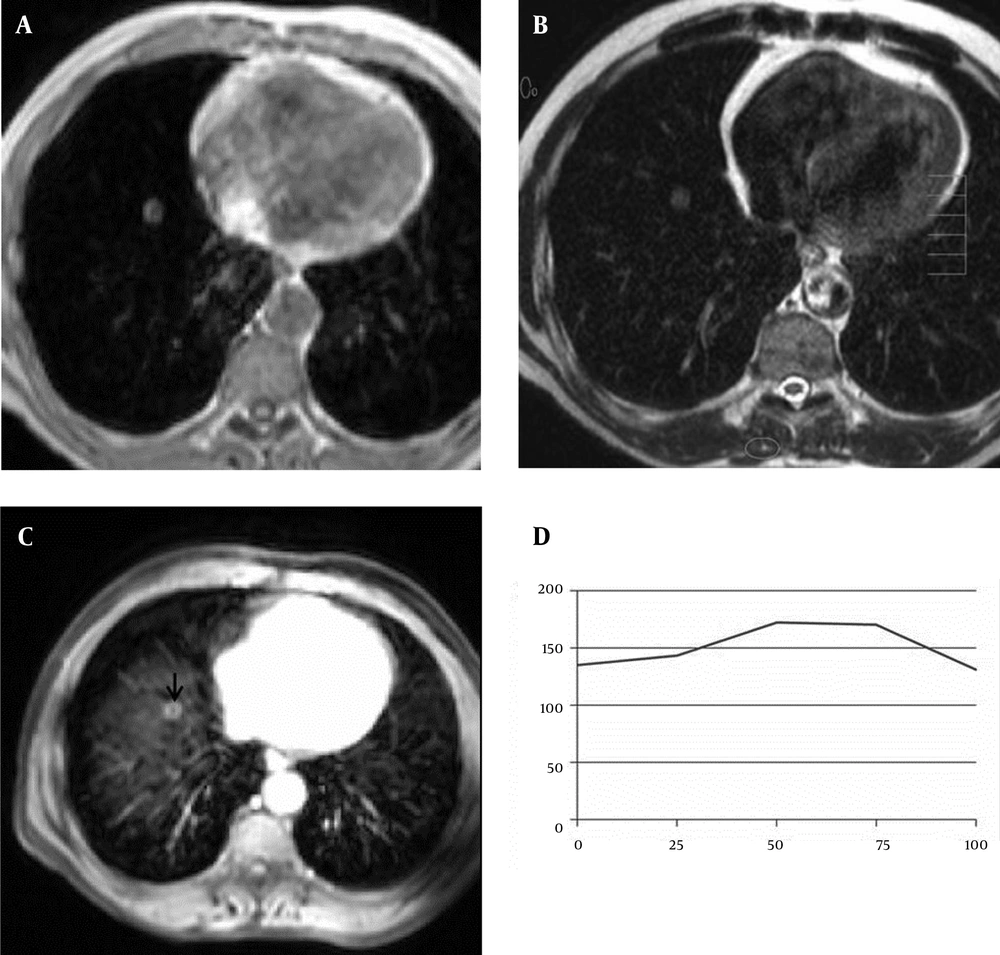
A 61-year-old man with benign solitary pulmonary nodule. A, Axial T1-weighted FFE and B, T2-weighted TSE MR images show a nodule in the right lower lobe of the lung. C, This nodule (arrow) shows peripheral ring-enhancement on the axial post contrast fat-suppressed T1-weighted image (5th minute). D, SI-time curve and quantitative interpretation of the curve obtained from the nodule. Maximun relative enhancement (27%) and wash-in rate (1.48 seconds) implied benign mass.
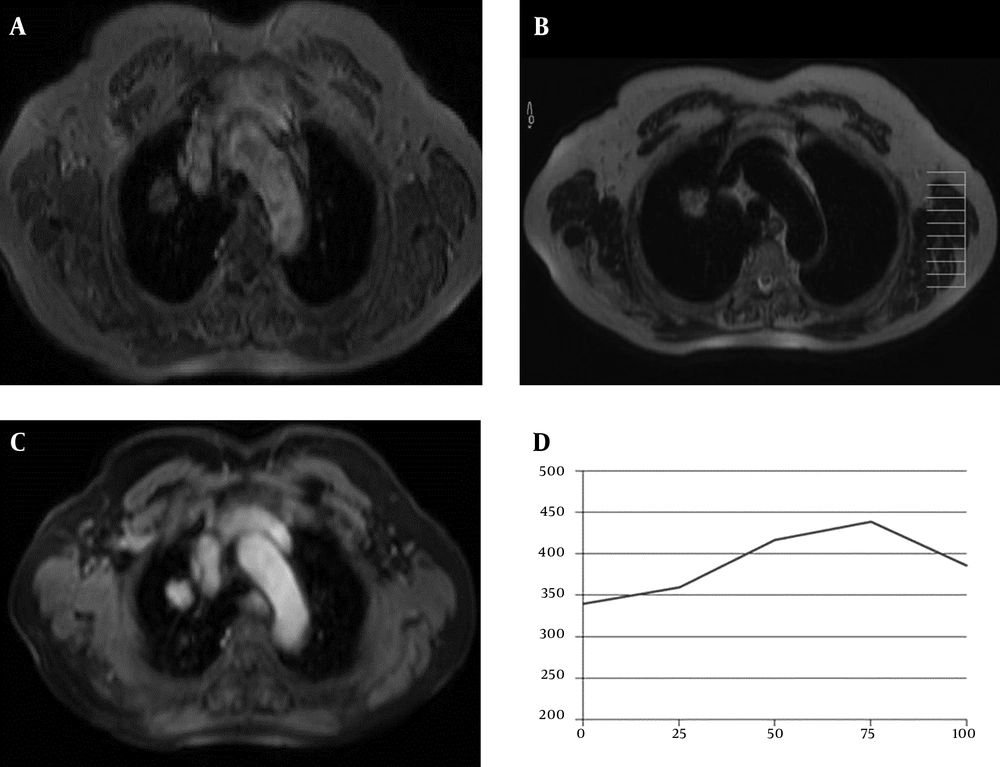
A 77-year-old woman with adenocarcinoma. A, Axial T1-weighted FFE and B, T2-weighted TSE, MR images show a mass in the right upper lobe of the lung; C, This mass shows prominent central homogeneous enhancement on the axial post contrast fat-suppressed T1-weighted image (5th minute); D, SI-time curve and quantitative interpretation of the curve obtained from the mass. Maximum relative enhancement (30%) and wash-in rate (2.28 seconds) implied benign mass.
| Benign Masses | Malignant Masses | |
|---|---|---|
| Number | 40 | 35 |
| 25th second | ||
| Homogeneous | 78.2 | 25.6 |
| Heterogeneous | 21.8 | 74.4 |
| 5th minute | ||
| Homogeneous | 70.8 | 10.6 |
| Heterogeneous | 10.4 | 82.4 |
| PE | 18.8 | 7.0 |
Abbreviation: PE, peripheral enhancement.
aValues are expressed as %.
4.2. Quantitative Evaluation
| Malignant Masses | Benign Masses | P Value | |
|---|---|---|---|
| WIR | 2.25 (5.15) | 2.45 (2.28) | 0.046 |
| MRE | 26.34 (24.81) | 43.21 (32.52) | 0.038 |
| TTP | 63.65 (33.72) | 73.36 (26.82) | > 0.05 |
Abbreviation: WIR, Wash-in rate; MRE, Maximum relative enhancement; TTP, Time to peak.
