

1. Background
Coronary artery stent implantation is becoming popular for the treatment of coronary stenosis; however, it requires long-term follow-up to monitor stent patency due to in stent restenosis. Coronary computed tomography angiography (CCTA) has been widely used in daily clinics as a non-invasive method to rule out coronary artery stenosis. Various CT techniques, such as low voltage, low current, and high pitch scan, were developed to reduce the radiation dose of CCTA. As the radiation dosage had an exponential decrease with lowering voltage, using a lower tube voltage was considered as a major method to reduce dose. In order to compensate the increasing image noise with lower tube voltage, iterative reconstruction was used to improve image quality and to decrease image noise compared with filtered back projection (FBP) (1-7).
2. Objectives
The purpose of this study was to compare the quality of CT imaging of coronary artery stents between low tube voltage scan (100 kVp) combined with sinogram affirmed iterative reconstruction (SAFIRE) and routine tube voltage scan (120 kVp) with FBP.
3. Patients and Methods
3.1. Patients
From April 2012 to June 2013, CCTA was performed on a total of 156 patients with coronary artery stent implantation (male, 110; female: 46; age range, 32 - 86 years; mean ± SD age, 63.10 ± 11.17 years). The participants were randomly assigned into two groups: group A (male, 59; female, 21; age range, 32 - 81 years; mean ± SD age, 63.81 ± 10.35years) and group B (male, 51; female, 19; age range, 38 - 86 years; mean ± SD age, 62.21 ± 12.13 years). The age and body mass index (BMI) of group A and B were compared by t-test and there was no statistically significant difference (P > 0.05). The following exclusion criteria were applied: positive iodine allergy test, severe renal insufficiency (serum creatinine > 84 μmol/L measured by creatinine test kit), severe arrhythmia (including supraventricular tachycardia, ventricular tachycardia, atrial fibrillation, atrioventricular block), and body mass index (BMI) > 28 kg/m2. The study was approved by the institutional ethics committee. Written informed consent was obtained from all patients.
3.2. Scan Protocol
CCTA was performed by a second generation dual-source CT system (SOMATONM definition flash, siemens healthcare, Forchheim, Germany). The scan ranged from 1 cm below the level of the tracheal bifurcation to the diaphragm. Prospective electrocardiogram (ECG)-triggered scan mode was used with a collimation of 128 × 0.6 mm. Reference tube current was 350 – 410 mAs with tube current modulation activated. A total volume of 50 - 70 mL contrast agent (iopromide, 370 mg iodine/mL, Bayer Schering Pharma, Berlin, Germany) was injected with a flow rate of 5 mL/s and followed by 50 mL saline flush at the same rate. Bolus tracking technique was used with a signal attenuation threshold of 100 HU at the root of the descending aorta. One hundred kVp was used for patients in group A, while 120 kVp was used for group B. The image data was collected in the preset R-R interval 35 - 80 percentage of concurrently traced ECG.
3.3. Image Reconstruction and Analysis
CT images of group A were reconstructed with SAFIRE at the reconstruction strength level of 3, while the datasets of group B were reconstructed with FBP. The reconstruction convolution kernels were I46f and B46f, respectively. All datasets were reconstructed with a slice thickness of 0.6 mm with an increment of 0.4 mm. All reconstruction datasets were analyzed on the Siemens Syngo multi-modality workplace (MMWP). The mean attenuation, signal to noise ratio (SNR), and stent-lumen attenuation increase ratio (SAIR) were recorded for both groups. The mean attenuation measurements were obtained from the aortic root, in-stent lumen (proximal, middle, and distal), and the coronary artery above the stent. The region of interest (ROI) size for aortic root was 2 cm2 and the size of the in-stent ROI was drawn as large as possible while avoiding artifacts and occlusions. The image noise expressed as the standard deviation (SD) and in-stent SNR was calculated as in-stent attenuation or in-stent standard deviation (8). The SAIR was calculated as (in-stent attenuation-coronary lumen attenuation) or coronary lumen attenuation (9). The lesion assessment of stents included analysis of lumen obstruction, lumen plaque, plaque nature, and the degree of luminal stenosis. Subjective image quality scores were rated by a four-point scale (10, 11) (1 = poor, 2 = moderate, 3 = good, 4 = excellent) and scores of 2 - 4 were considered as diagnostic image quality.
3.4. Radiation Dose
Volume computed tomography dose index (CTDI vol) and dose length product (DLP) were recorded from the CT scanner. Conversion coefficient of 0.014 mSv Gy-1 cm-1 (12) for thorax was used to calculate the effective dose.
3.5. Statistical Analysis
Statistical analysis was performed on SPSS version 17.0 (SPSS Inc, Chicago, IL) and the mean attenuation, image noise, SNR, SAIR, and radiation dose were compared between group A and B by two independent sample t-tests. Moreover, to compare image quality scores and lesion assessment, we performed Wilcoxon signed rank test. P ≤ 0.05 was considered as a statistically significant difference.
4. Results
4.1. Mean Attenuation, Image Noise, SNR and SAIR
The mean attenuation, SNR, and SAIR of group A (100 kVp with SAFIRE) and group B (120 kVp with FBP) were compared by t-test and listed in Tables 1 and 2. The mean attenuation, image noise, and SAIR showed a statistically significant difference between the two groups (P < 0.05), while SNR did not show a statistically significant difference (P > 0.05) (Figure 1).
| Scan Protocol | Aortic Root Attenuation | In-Stent Attenuation | Coronary Artery Attenuation | Noise | SAIR |
|---|---|---|---|---|---|
| Group Aa | 495.44 (111.77) | 585.76 (119.35) | 486.78 (113.69) | 30.08 (3.02) | 0.12 (0.05) |
| Group Bb | 428.11 (93.24) | 484.43 (97.58) | 413.24 (94.72) | 54.79 (7.61) | 0.14 (0.04) |
| t Statistics | 2.752 | 11.77 | 3.19 | -9.51 | -2.53 |
| P Value | 0.008 | < 0.001 | 0.002 | < 0.001 | 0.012 |
Comparison of Mean Attenuation (HU), Noise and SAIR Between Groups A and B
| Scan Protocol | Aortic Root | In-Stent | Coronary Artery |
|---|---|---|---|
| Group Aa | 25.41 (10.36) | 19.56 (11.72) | 21.60 (10.04) |
| Group Bb | 28.97 (15.53) | 21.98 (13.52) | 25.23 (14.89) |
| t Statistics | -1.337 | -0.951 | -1.673 |
| P Value | 0.184 | 0.344 | 0.097 |
Comparison of Signal to Noise Ratio Between Groups A and B
 and 120 kVp combined with filtered back projection (B) showing image noise of the aortic root.")
Two protocols of 100 kVp combined with sinogram affirmed iterative reconstruction (A) and 120 kVp combined with filtered back projection (B) showing image noise of the aortic root.
4.2. Lesion Assessment of Stents and Subjective Image Quality Scores
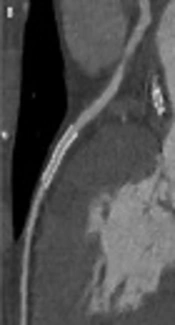
There were 243 cases of coronary artery stents in the two groups. Sixty-seven were found in the right coronary artery, 123 in the left anterior descending branch, 36 in the left circumflex coronary artery, and 17 in other branches. The length of the stents ranged from 3.8 to 98.7 mm with an average length of 27.5 ± 16.4 mm. No fracture and dislocation were found in any of the stents. Seventy plaques were found; 35 in the proximal, 23 in the middle and 18 in the distal part. The lesion assessment of stents with 100 kVp combined with SAFIRE showed no significant difference with 120 kVp FBP (P > 0.05).The subjective image quality score between group A (3.63 ± 0.62) and B (3.65 ± 0.57) was not statistically different (P > 0.05) (Figure 2A - D).
 including 120 kVp combined with filtered back projection (FBP) (A and C), and 100 kVp combined with sinogram affirmed iterative reconstruction (SAFIRE) (B and D). A, Multiple small low-density shadows are detected in the stent, stent metal artifacts or small soft plaques were not determined; B, Stent patency, no plaques, and less metal artifacts are detected; C, Stent patency, little metal artifacts and no plaques are seen; moreover, some soft plaques are demonstrated above the stent and mild in-stent stenosis is seen; D, Stent patency, no plaques and no metal artifacts, and small calcification in the distal stent is seen; moreover, some mixed plaques are visualized above the stent and mild in-stent stenosis is seen.")
Comparison between two protocols of coronary computed tomography angiography (CCTA) including 120 kVp combined with filtered back projection (FBP) (A and C), and 100 kVp combined with sinogram affirmed iterative reconstruction (SAFIRE) (B and D). A, Multiple small low-density shadows are detected in the stent, stent metal artifacts or small soft plaques were not determined; B, Stent patency, no plaques, and less metal artifacts are detected; C, Stent patency, little metal artifacts and no plaques are seen; moreover, some soft plaques are demonstrated above the stent and mild in-stent stenosis is seen; D, Stent patency, no plaques and no metal artifacts, and small calcification in the distal stent is seen; moreover, some mixed plaques are visualized above the stent and mild in-stent stenosis is seen.
4.3. Radiation Dose
The radiation dose of CTDI vol, DLP, effective dose (ED) between group A and B were compared by t-test with significant difference (P < 0.05). The dose data were listed on Table 3. The effective dosage of 100 kVp was significantly lower (4.92 mSv or about 51.5%) than that of 120 kVp.
| Radiation Dose | Group Aa | Group Bb | t Statistics | P Value |
|---|---|---|---|---|
| CTDI vol, mGy | 20.04 (6.94) | 40.72 (12.06) | -11.03 | < 0.001 |
| DLP, mGy × cm | 272.87 (124.34) | 562.37 (184.31) | -9.41 | < 0.001 |
| ED, mSv | 4.64 (2.11) | 9.56 (3.13) | -9.41 | < 0.001 |
Comparison of Radiation Dose Between Groups A and B
5. Discussion
CCTA is considered as a reliable noninvasive method to evaluate the contorts and variation of the coronary artery, lumen obstruction, lumen plaque, plaque nature and to determine the degree of luminal stenosis and calcification. CCTA has important clinical value for treatment and prognosis of coronary heart disease. Coronary artery stent implantation is the most effective means of treatment of coronary heart disease. In-stent restenosis can profoundly affect treatment outcome and prognosis. This requires long-term follow-up for stent patency. The problem of radiation caused by CT examination is inevitable and beam-hardening artifacts of the coronary artery can affect image quality. It has been demonstrated that iterative reconstruction (IR) can reduce beam-hardening artifacts, which can improve image quality, decrease image noise, reduce radiation dose compared with FBP (1, 2, 13-16).
The principle of IR technology generates in the main image from the original data and through correction process, reference images can receive from the main image. The reference images can accurately define anatomical structure and improve the image boundary. The IR process occurs in image space. After several iterative corrections, the goal of significantly reducing image noise and producing the desired image even if the main image data is incomplete or has low SNR is achievable (17-19). The SAFIRE algorithm is a raw data-based IR technique developed by Siemens Healthcare. SAFIRE process includes two different loops. The first loop is a correction process. In the loop, imperfections can be corrected in the original reconstruction and artifacts can be removed or decreased. This loop is then repeated a number of times to improve image noise without noticeable loss of sharpness. The second loop is a statistical optimization process that occurs in image space. The corrected image is compared with the original and the reconstruction process is repeated a number of times, until the optimized image is achieved.
The purpose of the study was to determine image quality and radiation dose with low tube voltage (100 kVp) combined with SAFIRE in coronary artery stents in comparison with routine tube voltage (120 kVp) using FBP. In this study, the mean attenuation, and SAIR were significantly different statistically between group A (100 kVp SAFIRE) and group B (120 kVp FBP) (P < 0.05), while SNR was not significantly different statistically (P > 0.05). The mean attenuation of 100 kVp was higher than that of 120 kVp, which coincide with the opinion that CT attenuation decreases with tube voltage increase. When CT attenuation is higher, small soft plaques, thrombosis and endometrial thickening may be shown more clearly in the lumen. In this study, measuring SAIR indirectly reflected CT attenuation change with the lumen, which was helpful in the diagnosis of stent restenosis. The result showed SAIR of 100 kVp was less than that of 120 kVp, which was thought beam hardening artifacts of SAFIRE smaller than FBP. Theoretically, low tube voltage scanning can significantly increase the value of CT and increase the image noise and coronary artery stent beam hardening artifacts. However, SAFIRE can reduce image noise and beam-hardening artifacts, which counteract the side effect of low tube voltage scanning increasing beam hardening artifacts that can objectively reflect the situation of the stent. These results are consistent with the previous studies (14). Moreover, the subjective image quality score between group A (3.63 ± 0.62) and B (3.65 ± 0.57) was not statistically different (P > 0.05), which demonstrated SAFIRE could improve image quality with a lower dose. The lesion assessment of stents with 100 kVp combined with SAFIRE was not significantly different with 120 kVp FBP. Our study has the following limitations. First, patients with a BMI higher than 28 kg/m2 were excluded. Second, flash CT can support many personalized scanning protocols. Finally, the reconstruction strength level of SAFIRE includes 1 - 5 and we only investigated strength level 3 in this study.
In normal weight range (BMI < 28 kg/m2), SAFIRE used in coronary artery stent CT imaging could improve image quality and significantly reduce the radiation dosage with lower tube voltage.
