1. Background
Pulmonary embolism (PE) has become the third most common cardiovascular disease, which can seriously harm human health (1, 2). Pulmonary embolism usually occurs as an emergency with relatively ambiguous clinical symptoms and is prone to be misdiagnosed. Early diagnosis and treatment can significantly reduce the fatality rate of pulmonary embolism. Therefore, accurate early diagnosis of pulmonary embolism has great clinical value.
Peripheral pulmonary embolism refers to pulmonary embolism in the segmental and subsegmental pulmonary arteries. The clinical symptoms differ from those of central pulmonary embolism and are prone to misdiagnosis (3). Some scholars believe that peripheral pulmonary embolism may lead to a large area of central pulmonary embolism. Chronic or subacute pulmonary embolism may become acute; especially in patients with recurrent deep vein thrombosis, this may be fatal (2, 4). Almost no research concerning peripheral pulmonary embolism has been conducted. Some scholars believe that a small peripheral pulmonary embolus may be easily overlooked when relying on the traditional diagnostic method because of the large quantity of peripheral pulmonary arteries (5, 6).
Dual-source computerized tomography (CT) has been widely used in clinic, mainly applied for coronary artery, low dose, and energy perfusion imaging (7-10). There have been many reports concerning the application of dual-source CT for detecting pulmonary embolism (11-13), primarily for the diagnosis of acute central pulmonary embolism (11-13). However, the severity of pulmonary embolism usually does not correlate with its size or location. Lee et al. (14) demonstrated that dual-source CT could significantly increase the detection rate of peripheral pulmonary embolism.
CT pulmonary angiography (CTPA) is a routine method of pulmonary angiography by CT examination. In this method, axial, sagittal, and coronal images are reconstructed and analyzed to diagnose PE. Compared with pulmonary angiography, CTPA is safer and more comfortable. It has no complications in most of patients. Pulmonary embolism detection software (PED) provides a reconstructed method of computer-aided diagnosis (CAD) and is used for automatic PE detection. The automatic detection algorithm for PE includes lung segmentation that is performed first, and then suspected pulmonary vessels are screened by using a tobogganing algorithm (15). The results of this program are demonstrated as direct localization of each suspected PE at the multiplanar images and the curved images of the workstation. Compared with CTPA, PED is more efficient and reduces the workload of doctors. Dual-energy pulmonary perfusion imaging (DEPI) is a functional imaging of the lung which could display pulmonary perfusion by double energy mode of dual-source CT. The iodine dose could be decomposed and displayed according to the principle that the CT value is different in double energy mode of dual-source CT. The distribution of iodine represents the distribution of pulmonary blood perfusion. Compared with CTPA and PED, DEPI is a functional imaging and could display the change of pulmonary perfusion.
2. Objectives
In the present study, we analyzed patients with suspected peripheral pulmonary embolism using PED, DEPI, and CTPA on dual-source CT.
3. Patients and Methods
3.1. Patients
The Ethics Committee of our hospital approved this retrospective study. All patients or their families understood the potential harm of radiation and the potential side effects of the iodine contrast agent and signed the informed consent for this study. One hundred and fifty patients with suspected pulmonary embolism who were referred to the Binzhou Medical Affiliated Hospital between January 2010 to March 2014 were retrospectively reviewed for enrollment in this study. One hundred and forty-three patients accepted dual-source dual-energy CT of the chest, and then reconstructions were performed. Seven patients with an allergy to iodine were not scanned by dual-source dual-energy CT.
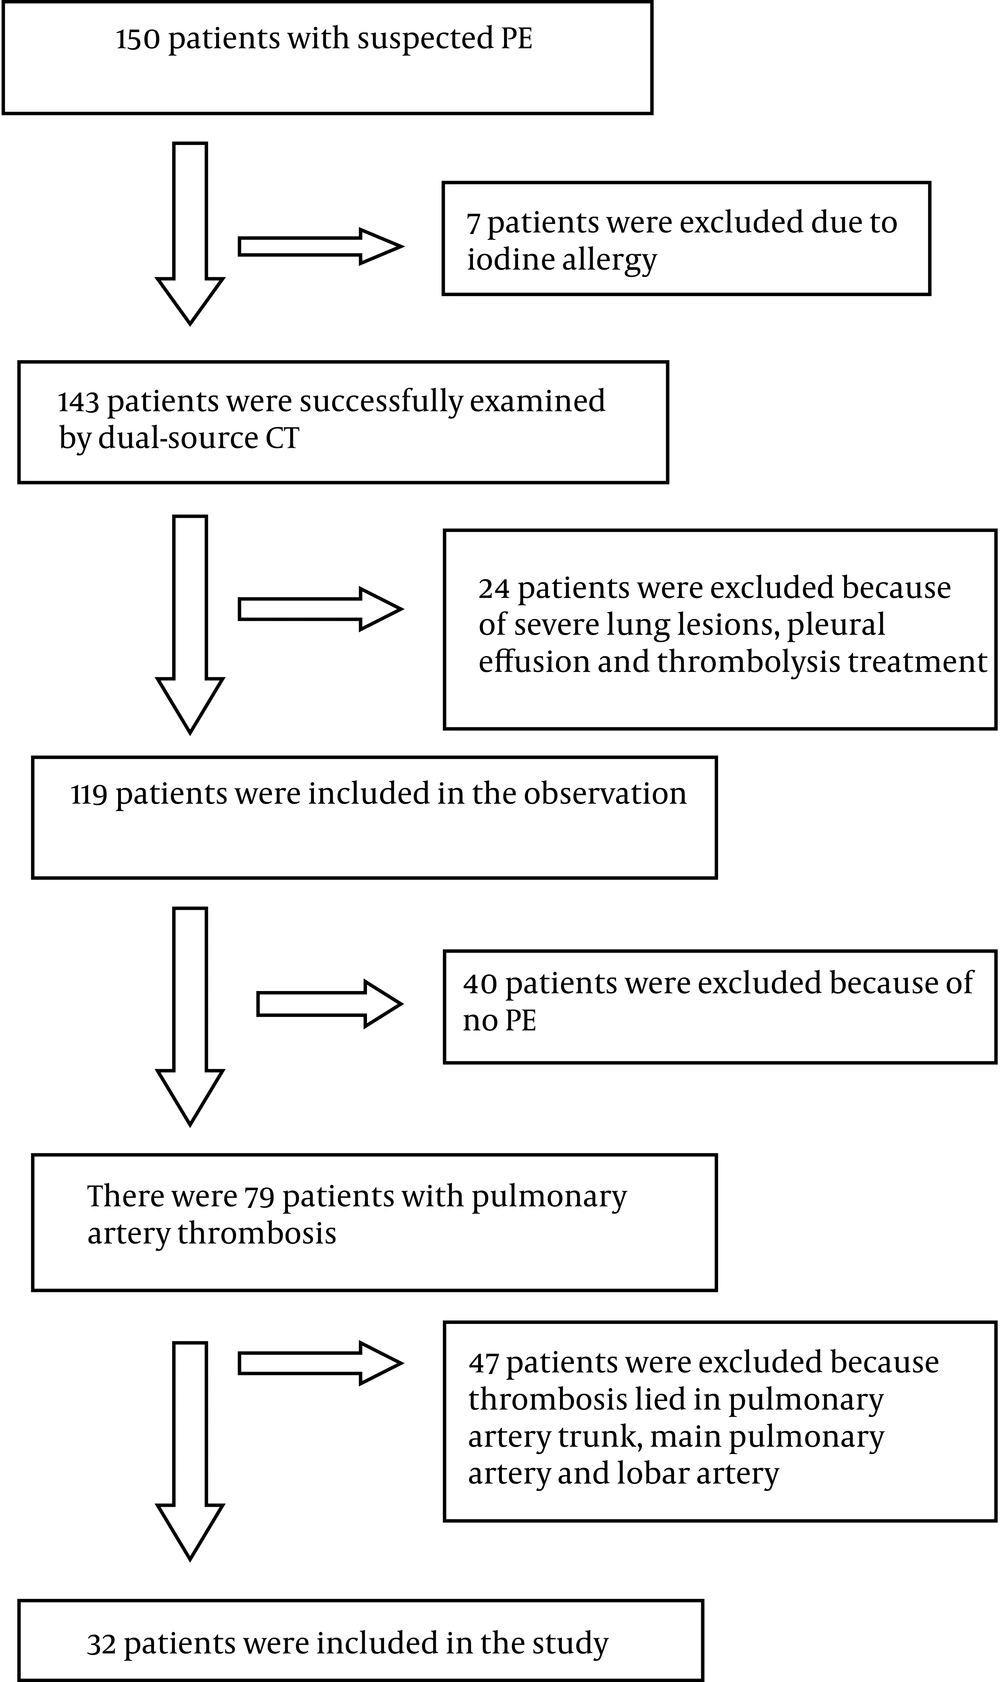
The main symptoms of these patients included chest tightness, chest pain, cough, expiratory dyspnea, and syncope. The criteria for inclusion in the study were pulmonary embolus involving the segmental pulmonary artery and distal branches, and completion of the dual-source CT examination. The exclusion criteria were iodine allergy; abnormal liver or kidney function; thrombolysis treatment; and extensive lung changes or massive pleural effusion. One hundred and eleven patients who did not meet the diagnostic criteria for peripheral PE were excluded (Flow diagram) (Figure 1).
Finally, a total of 32 patients who finished the exams without any adverse reactions were enrolled in this study, including 22 men and 10 women, aged from 48 to 75 years old, with a median age of 62.3 years.
3.2. Computerized Tomography Examination
All patients underwent pulmonary artery CT exams with a Siemens SOMATOM Definition Flashspeed dual-source CT (Germany, Berlin). With the patient in supine position, the scanning was performed in the head-to-toe direction, from the thoracic inlet to the inferior edge of the costophrenic angle. Using the dual-energy scanning mode, the tube voltage 140 kV /100 kV, the tube current 60 mA/240 mA, pitch 0.5, collimator 32 × 0.6 mm. The acquired data was reconstructed with a 0.5-mm thickness and 0.5-mm interval, and field of view (FOV) = 30 cm × 30 cm - 35 cm × 35 cm. The whole scan time was 18 - 22 seconds. The volumetric CT dose index (CTDIvol) and dose length product (DLP) of each examination were automatically archived by the system when the scan was finished.
The contrast agent used was nonionic contrast medium Ultravist 100mL (300 mg I/mL; Schering Healthcare, Guangzhou, China). This contrast agent was injected into the antecubital vein, according to the amount of 1.5 mL per kilogram of body weight, through a 20 G needle with a double-cylinder high-pressure syringe with a flow rate of 5 mL/s, followed by 30 to 40 mL saline at the same flow rate. The scanning was automatically triggered using the artificial intelligence technology of bolus tracking after the administration of the contrast agent. The region of interest was set in the pulmonary artery trunk, with a threshold of 100 Hounsfield units, and the scanning was triggered with a delay of two seconds after reaching the threshold. Patients were instructed to hold their breath at the end of inspiration when the scan was triggered.
3.3. Image Reconstruction and Interpretation
After scanning, the original 100 keV, 140 keV, and mixed images with a proportion of 5:5 were transferred to an Aquarius iNtuition 4.2 workstation. A radiologist performed the image post-processing for the mixed source images using multiplanar reformation software and acquired axial, sagittal, and coronal CTPA images, for which slice thickness is 3 mm. The 100 keV and 140 keV images were reconstructed with the PED software, which is computer aided diagnosis. It could automatically analyze the images and obtain the axial and curved surface reconstruction image of the suspected pulmonary embolus by computer aided diagnosis. Finally, the images must be confirmed by a radiologist. The 100 keV and 140 keV images were reconstructed to achieve the three dimensional imaging of pulmonary perfusion by adopting the Lung PBV software.
The post-processed reconstructed images were interpreted by a double-blind method by two radiologists, both of whom have experience in vascular disease. They were asked to evaluate the images independently and mark every embolus on the images. A total of three reading sessions were undertaken. In the first session, they were asked to evaluate the CPTA images alone. In the second session, they were asked to evaluate the PED images. In the third session, they were asked to evaluate the DEPI images generated by Lung PBV. Each session was performed with at least a one week interval and the images were randomly distributed in order to minimize their memory effect. The continuous filling defects that extended into branching vessels were regarded as single PE at the most proximal location. The CTPA images were evaluated in turn: left and right pulmonary artery and lobed, segmental, and subsegmental pulmonary artery. These were carefully assessed through observation from all angles to determine the presence of any embolism.
For PED images, suspicious images diagnosed by computer were further observed by radiologists to determine the presence of embolism. The diagnostic scoring for pulmonary embolism was in accordance with Lee et al. (14): 1, positive, the pulmonary artery displays a complete or partial filling defect image; 2, negative, the pulmonary artery is smooth with natural distribution, without lumen stenosis and no filling defect within the lumen.
The DEPI figures were evaluated from top to bottom, internal to external, and comparisons of both sides of the lung tissues were made. When there was perfusion loss or reduction for one side of the lung tissue, then the diagnosis of pulmonary embolism could be definite.
3.4. Statistical Analysis
All statistical analyses were performed using SPSS ver. 13.0 software (SPSS Inc., Chicago, IL, USA). The detection rates of CTPA and PED images for segmental and subsegmental pulmonary embolisms were calculated and compared with the McNemar test. P < 0.05 was considered statistically significant. The diagnostic consistency of the two radiologists for all images, CTPA images, and PED images were assessed by kappa (κ) coefficient of agreement. The total of pulmonary segmental artery embolus diagnosed by two radiologists using CTPA images and PED images was regarded as reference standard. The diagnostic consistency of PED and CTPA images and DEPI images for segmental pulmonary embolism was also compared with the kappa (κ) test. Diagnostic consistency was rated as: κ < 0, none; 0 < κ ≤ 0.4, poor; 0.4 < κ < 0.8, good; and κ ≥ 0.8, excellent. The sensitivity, specificity, positive predictive value (PPV), and negative predictive value (NPV) of DEPI images on the diagnosis of PE were also calculated.
4. Results
4.1. Dose Measurement
Examinations were performed successfully in all 143 patients without any technical problems. All CT angiograms were fully diagnostically evaluable. The estimated mean CTDIvol was 18.25 ± 0.73 mGy (range, 16.50 – 21.30 mGy) and DLP was 458.35 ± 10.54 mGy-cm (range, 373.60–576.70 mGy - cm)
4.2. Diagnostic Consistency Between Two Observers
The diagnostic consistency between the two radiologists for all images was excellent (κ = 0.95; Table 1). The diagnostic consistency between the two radiologists for both CTPA images and PED images was also excellent (κ = 0.90, κ = 0.98; Tables 2 and 3). However, the diagnostic consistency between the two radiologists for PED images was higher than for CTPA images.
| Observer B | Total | ||
|---|---|---|---|
| Observer A | Positive | Negative | |
| Positive | 244 | 12 | 256 |
| Negative | 12 | 3572 | 3584 |
| Total | 256 | 3584 | 3840 |
aKappa = 0.95 (95% confidence interval=0.93-0.97)
| Observer B | Total | ||
|---|---|---|---|
| Observer A | Positive | Negative | |
| Positive | 88 | 10 | 98 |
| Negative | 8 | 1814 | 1822 |
| Total | 96 | 1824 | 1920 |
aKappa = 0.90 (95% confidence interval=0.86-0.95).
| Observer B | Total | ||
|---|---|---|---|
| Observer A | Positive | Negative | |
| Positive | 156 | 2 | 158 |
| Negative | 4 | 1758 | 1762 |
| Total | 160 | 1760 | 1920 |
aKappa = 0.98 (95% confidence interval=0.96-0.99).
4.3. Pulmonary Embolism Detection Software and Computerized Tomography Pulmonary Angiography Images of Peripheral Pulmonary Embolism
According to the segmentation of the lung proposed by Remy-Jardin et al. (16), each lobe can be divided into 10 pulmonary segments with each segment dominated by a pulmonary artery, and each pulmonary artery is divided into two sectional arteries. Therefore, in 32 patients, 640 segmental and 1,280 subsegmental pulmonary arteries were analyzed (Table 4).
Abbreviations: PED; Pulmonary Embolism Detection Software, CTPA; Computerized Tomography Pulmonary Angiography
aValues are expressed as No (%).
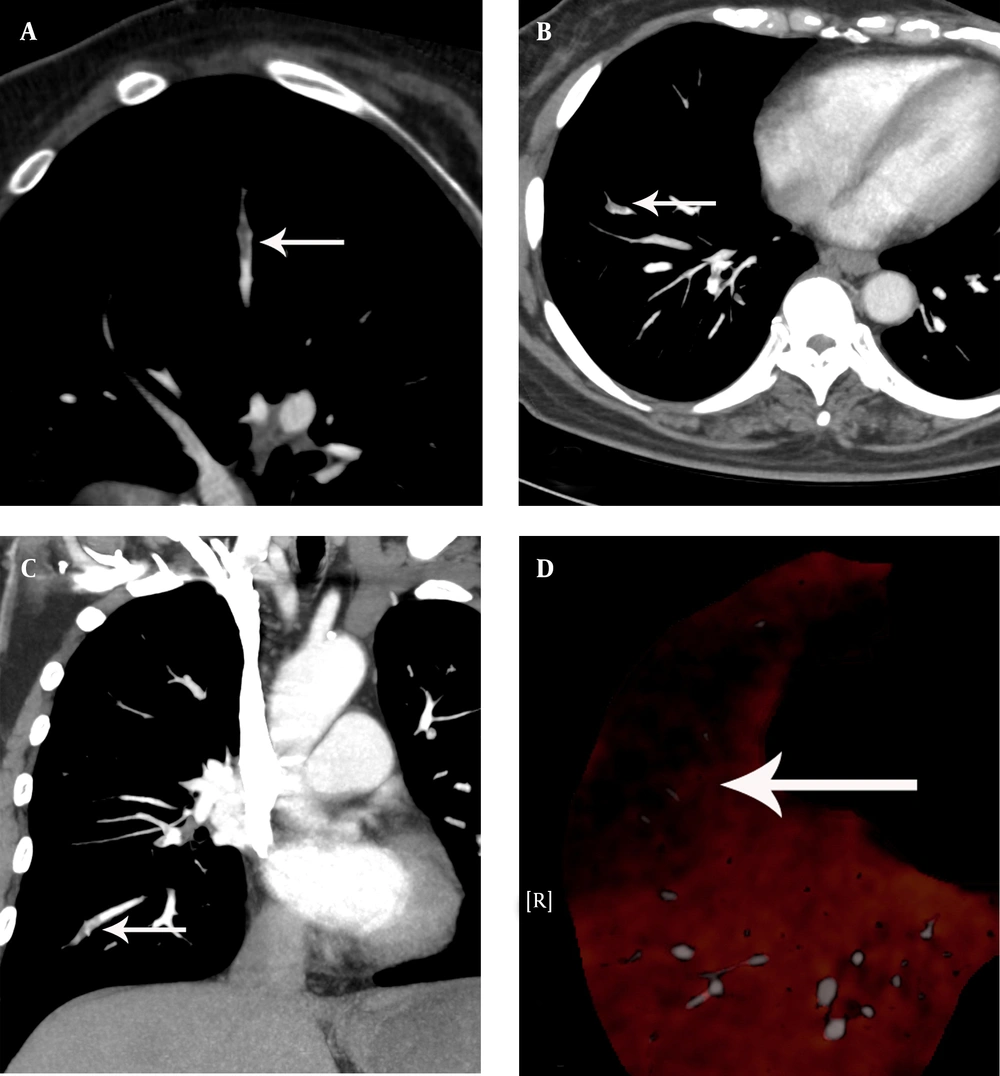
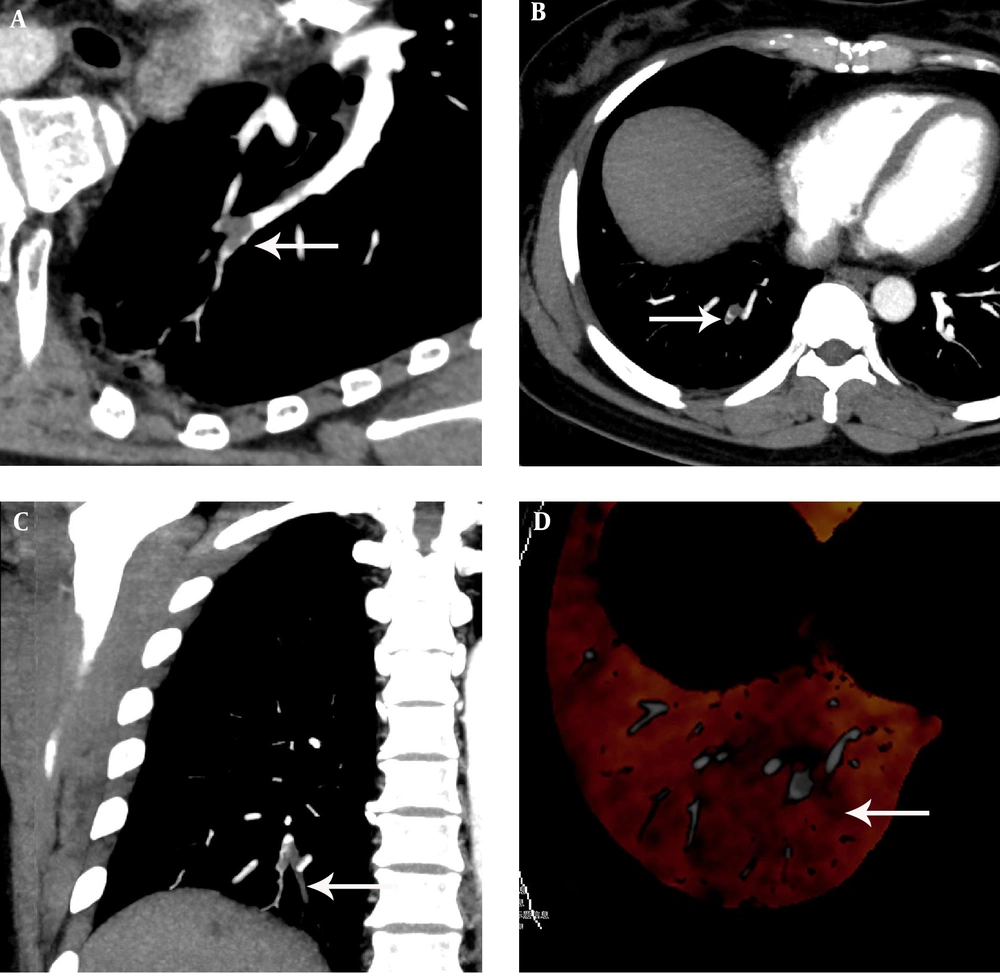
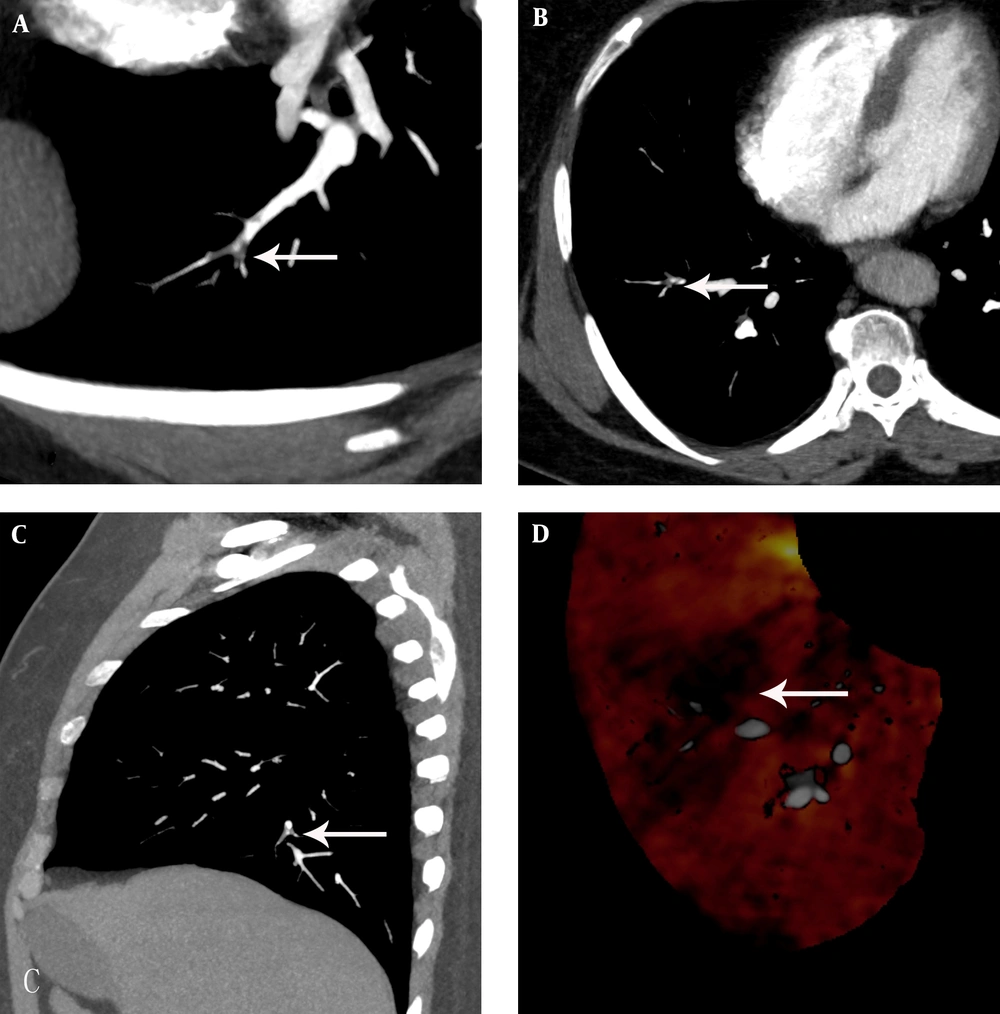
The PED images revealed significantly more embolisms in segmental (68) and subsegmental (94) pulmonary arteries than were seen in the CTPA images (50 and 56, respectively; P < 0.05) (Figure 2B and C; Figure 3 B and C; Figure 4 B and C).
A 60-year-old woman with chest distress and shortness of breath for one week, who had a history of breast cancer, worsened for one day. A, The pulmonary embolism detection software image displayed a partial eccentric filling defect and significantly narrow lumen at the anterior basal artery of the lower lobe of the right lung. B, C, The computerized tomography pulmonary angiography image showed a filling defect at the anterior basal artery of the lower lobe of the right lung. D, The dual-energy pulmonary perfusion imaging image revealed obvious sparse perfusion and a partial perfusion defect at the anterior basal segment of the lower lobe of the right lung.
A 54-year-old woman with chest distress for two weeks aggravated for one day, who had a history of varicose veins of the lower extremity. A, The pulmonary embolism detection software image showed an irregular filling defect which rode across the arterial bifurcation and luminal narrowing at the posterior basal segment artery of the lower lobe of the right lung. B, C, The computerized tomography pulmonary angiography image found an irregular filling defect which rode across the arterial bifurcation and luminal narrowing at the posterior basal segment artery of the lower lobe of the right lung. D, The dual-energy pulmonary perfusion imaging image revealed mild pulmonary sparse perfusion and significant sparse portion at the posterior basal segment of the lower lobe of the right lung.
A 68-year-old man with chest distress, chest pain for one week aggravated for one day. A, The pulmonary embolism detection software image showed an irregular filling defect which rode across the arterial bifurcation and luminal narrowing at the lateral basal segment artery of the lower lobe of the right lung. B, C, The computerized tomography pulmonary angiography image found an irregular filling defect which rode across the arterial bifurcation and luminal narrowing at the lateral basal segment artery of the lower lobe of the right lung. D, The dual-energy pulmonary perfusion imaging image revealed mild pulmonary sparse perfusion, partly obvious sparse perfusion and significant sparse portion at the lateral basal segment of the lower lobe of the right lung.
4.4. Comparison of Pulmonary Embolism Detection Software and Dual-Energy Pulmonary Perfusion Imaging For Diagnosing Segmental Pulmonary Embolism
In DEPI images, 66 lung segment perfusion abnormalities were observed, including 48 areas of sparse perfusion (Figure 3D, 4D) and 18 defects (Figure 2D). The PED images yielded 72 segmental pulmonary embolisms (20 complete and 52 incomplete; Figure 2A, 3A, 4A). Of the 20 complete pulmonary embolisms, 75.0% (15/20) appeared as a perfusion defect and the others were sparse. Of the 52 incomplete pulmonary embolisms, 82.7% (43/52) were sparse perfusions, 5.8% (3/52) were perfusion defects, and the other 6 were without obvious perfusion changes. (Table 5) Using the diagnostic results of CTPA and PED images as reference standard, there was very good consistency between the CTPA and PED images and DEPI images for diagnosing segmental pulmonary embolisms (κ = 0.85; Table 6). The sensitivity, specificity, positive predictive value (PPV), and negative predictive value (NPV) of DEPI images on diagnosis of pulmonary embolism were 91.7%, 97.5%, 82.5%, and 98.9%, respectively (Table 7).
| Number | DEPI, Perfusion | |||
|---|---|---|---|---|
| PED, Embolism | Defect | Sparse | Normal | |
| Complete | 20 | 15 | 5 | 0 |
| Incomplete | 52 | 3 | 43 | 6 |
Abbreviations: DEPI, dual-energy pulmonary perfusion imaging; PED, pulmonary embolism detection software.
| DEPI | Total | ||
|---|---|---|---|
| CTPA+PED | Positive | Negative | |
| Positive | 66 | 6 | 72 |
| Negative | 14 | 554 | 568 |
| Total | 80 | 560 | 640 |
Abbreviations: PED; pulmonary embolism detection software, DEPI; dualenergy pulmonary perfusion imaging, CTPA; computerized tomography pulmonary angiography
Kappa = 0.85 (CI 95% 0.79, 0.91).
| DEPI images | Sensitivity | Specificity | PPV | NPV |
|---|---|---|---|---|
| Value | 91.7% (%95 CI=82.1-96.6) | 91.7% (%95 CI=82.1-96.6) | 82.5% (%95 CI=72-89.8) | 98.9 % (%95 CI=97.6-99.6) |
5. Discussion
With the development of imaging technology and clinical diagnosis ability in recent years, PE has gradually become one of the most common emergency and critical diseases in clinic. PE is more likely to occur in elderly patients, patients with a postoperative fracture, patients lying in bed for a long period, patients with a malignant tumor, and patients with abnormal coagulation function. The clinic untypicalities and fatalness of PE are closely related to its own anatomical and pathological characteristic. When the embolus exists in the pulmonary artery trunk and lobar arteries, it makes pulmonary circulation pressure and the right ventricular load increase, leading to right heart failure. The clinical symptoms tend to be more obvious and sudden death is likely to happen. When the embolus involves the pulmonary segmental and sub-segmental pulmonary arteries, the clinical symptoms are usually not obvious and the duration of the disease is often subacute or chronic because the region influenced by the embolus is smaller and there is collateral circulation around the region. However, the embolus existing in peripheral pulmonary arteries makes the blood flow become slow, the vortex increase, mean transit time become prolonged, and the blood platelet more easily stay in the pulmonary artery wall. Further, it induces a large area of central PE. It is necessary to diagnose pulmonary embolism in peripheral pulmonary arteries in a timely and accurate manner. However, it is relatively difficult to conduct a definitive diagnosis with conventional CTPA. Tang et al. (11) used canine models and found that dual-energy CT could significantly increase the detection rate of peripheral PE compared with traditional CTPA. Lee et al. (14) demonstrated that the combined application of multiple reconstruction methods on dual-source CT could increase the detection rate of peripheral PE.
We found that the diagnostic consistency between the two radiologists for PED images was higher than for CTPA images. These may be due to the characteristics of different reconstruction methods. Precise assessment of CTPA images is a boring process because it needs evaluation of large number of pulmonary arteries one by one. In addition, observation ability and diagnostic criteria are slightly different between different people so the diagnostic consistency between the two radiologists for CTPA images is lower. However, assessment of PED images is more convenient as these images are screened and reconstructed by computer, which could reduce the workload and artificial interference so the diagnostic consistency between the two radiologists for PED images is higher.
We also found that the detection rate using PED images for segmental and subsegmental pulmonary embolism was significantly higher than that of CTPA, which is consistent with the literature. This may be due to the radiologist’s need to observe each artery in turn on CTPA images, which contain a huge number of segmental and sub-segmental pulmonary arteries, and their courses are usually unnatural or varied. Therefore, the radiologist may misdiagnose due to boring course of assessment or problems of image reconstruction. However, with PED images, each artery is analyzed by computer and the presence of pulmonary emboli is determined according to an internal model, subverting the possibility of misdiagnosis. Yet, due to its high sensitivity, false positives are possible because PED images are vulnerable to the influence of factors such as blood perfusion status, vascular filling, and microcirculation. PED images must be combined with CTPA images to decrease the false positives cases. The radiologist must be the final arbiter, meticulously observing the images determined by the software to have an embolus, and making the final determination combining with CTPA images.
Some scholars found that dual-source dual-energy CT perfusion imaging could better display perfusion defects caused by PE (12, 17-19), which is similar to our findings. The sensitivity and specificity of DEPI images on the diagnosis of PE were 91.7% and 97.5%, respectively. The sensitivity was slightly lower. We analyzed the data and found that, for complete PE, DEPI could better show the perfusion changes of the corresponding region, while the diagnostic accuracy of DEPI for incomplete PE was less in this study. This may be because the embolus did not completely block the blood vessels and enough blood could flow through so that a decline in perfusion was not significant. There were 14 false positive cases in this study. Lung perfusions were abnormal in DEPI images, but pulmonary artery emboli were not found in the CTPA and PED images. The reason may be that the perfusion of blood in the lung was heterogeneous, susceptible to gravity, cardiac output, or disturbances in microcirculation. In addition, lung lesions themselves, such as pneumonia, pleural effusion, and pulmonary interstitial lesions, can obscure perfusion images. They may cause interference in DEPI figures. Finally, the diagnostic accuracy of DEPI images may be detrimentally influenced by contrast agents within the heart cavity and veins, which can produce artifacts.
It has been reported that the consistency of diagnosis for PE between pulmonary artery angiography and pulmonary perfusion imaging is good (20, 21), which is consistent with our results. We found that there was good consistency (kappa = 0.85) between PED and CTPA images and DEPI figures for diagnosing peripheral PE. PED images and CTPA images are able to provide information regarding pulmonary emboli, but they cannot show changes in pulmonary perfusion or pulmonary function. DEPI can indicate changes in pulmonary perfusion, but is vulnerable to a variety of factors. Therefore, the definitive diagnosis of peripheral PE requires the combined observation of both PED and CTPA images and DEPI images.
Of course, as a computer aided diagnosis software, the reliability and accuracy of PED have yet to be further verified in daily clinical work. As a semiquantitative lung perfusion image, DEPI images were easily influenced by gravity, cardiac output, and microcirculation and were also influenced by observation ability and diagnostic criteria of the observer. As a result, it was necessary to do the combined observation of PED, CTPA, and DEPI images.
There are several limitations in our study. First, the number of patients in this study sample is relatively small, and we need to collect more cases with peripheral pulmonary embolism and make a systematic summary in the future. Second, the observation of pulmonary arteries and diagnosis of PE are difficult as the segmental and subsegmental pulmonary arteries are relatively small and have more variation.
In conclusion, using PED software of dual-source CT combined with energy perfusion imaging significantly improves the detection rate of peripheral PE and enables diagnosis at an early stage. This combination provides valuable information for clinical treatment and has great clinical value.


