1. Background
The universal use of multi-detector computed tomography (MDCT) in hospitals has recently led to an increased use of CT angiography (CTA) and other dynamic studies (1-7). CTA is noninvasive, generates fewer motion artifacts than magnetic resonance angiography, and can provide highly sensitive images at a low cost (8).
Generally, CTA involves a bolus timing method (test bolus or bolus tracking technique) in which a contrast material (CM) is intravenously injected at a volume that exceeds the trigger threshold (5, 9). In addition, a real-time monitoring scan is performed to confirm that the CM has reached the trigger threshold at the intravenous (IV) location of the region of interest (ROI) cursor. Simultaneously, the same region is repetitively exposed to radiation. The number of monitoring scans generally depends on the IV location of the CM, the injection rate, the CM volume, the CM concentration, saline flushing, and patient characteristics (weight and size, central blood volume, blood flow, age, cardiac output, degree of hydration, etc.) (8, 10-13). These factors can be used as determinants of the radiation dose when employing the bolus timing method.
Undergoing repetitive, short CT scans has been shown to increase the likelihood of cancer occurrence (14). A cohort study in the United States found that 0.7% of all patients who had received a CT scan developed cancer (15), and that 1.5% to 2.0% may have developed cancer due to a CT scan (16). To reduce concerns about repetitive radiation to the same region during a monitoring scan with the bolus timing method, which is essential for CTA, efforts should be made to minimize the side effects of the radiation dose by properly controlling determinants of the number of monitoring scans. It is currently recommended to use 100 kVp rather than 120 kVp to reduce the radiation dose and to raise both the contrast-to-noise ratio (CNR) and the signal-to-noise ratio (SNR) in CTA (2, 17).
2. Objectives
This study aims to effectively identify and reduce the radiation dose needed for the repetitive monitoring scans utilized in CT involving the bolus timing method.
3. Patients and Methods
3.1. Patients’ Bolus Timing
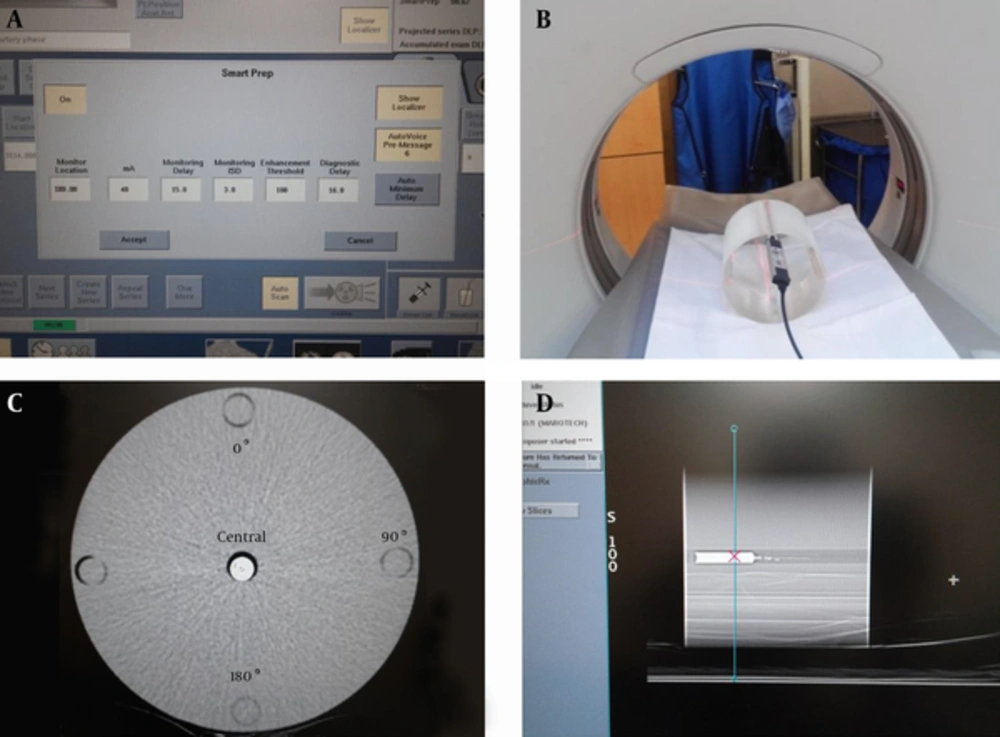
To analyze the radiation dose exposure resulting from the bolus timing method, we selected 871 scanned cases receiving dynamic CT liver (DCTL) and CTA at the Korean national cancer center between October 1, 2013 and March 31, 2014. Of these, 581 were men, 268 were women, and 22 patients receive more than two scans. The mean age was 62.7 years. All of the subjects had CT scans with the bolus timing method, and the monitoring scans were analyzed for DCTL (450 cases), head and neck CTA (140), pulmonary CTA (140), abdomen CTA (85), and lower extremity CTA (78). The CT device was a 64-section multi-detector row CT system (GE Discovery CT 750 HD; GE Healthcare), and the scout scan used 120 kVp and 10 mA. The CT device allowed the same kVp level to be used in a monitoring scan with bolus timing (Figure 1A). Levels of 120 kVp and 40 mA were used to analyze the number of monitoring triggers, and the bolus timing protocol presented in Table 1 was applied, as shown in Figure 1A. Neovist 370 contrast agent (Daewoong pharmaceutical Co., Korea) containing iopromide was utilized, and an automatic, dual-shot power injector (auto enhance A50, Nemoto Kyorindo Co., Japan) was used to inject the contrast agent intravenously into patients. This retrospective study did not require institutional review board approval or patient consent.
| Parameter | Value | |
|---|---|---|
| Scout | Tube voltage (kVp) | 120 |
| Tube current, mA | 10 | |
| Automatic bolus tracking protocol | Monitoring scan, mA | 40 |
| ROI cursor (10 - 15 mm2) | DCTL: abdominal aorta (dome of liver level); head and neck CTA: aortic arch; Pulmonary CTA: ascending aorta; Abdomen CTA: descending aorta (mid-liver level); Lower extremity CTA: common iliac artery | |
| Monitoring delay (sec) | DCTL: 16; Head and neck CTA: 6.7; Pulmonary CTA: 5.3; Abdomen CTA: 10;Lower extremity CTA: 12.8 | |
| Monitoring inter scan delay (sec) | DCTL: 3; head and neck CTA: 1; Pulmonary CTA: 3; Abdomen CTA: 3; Lower extremity CTA: 2.5 | |
| Diagnostic delay (sec) | DCTL: 16; Head and neck CTA: 6.7; Pulmonary CTA: 10; Abdomen CTA: 10; Lower extremity CTA: 12.8 | |
| Enhancement threshold (HU) | 100 |
Abbreviations: DCTL, dynamic CT liver; CTA, computed tomography angiography; ROI, region of interest.
Images of the bolus timing protocol with the CTDI head phantom. A, Imaging was carried out with the bolus timing protocol on the CT scanner; B, An ionization chamber was inserted into the CTDI head phantom cavity for the radiation dose; C, CTDI head phantom CT image; CM and saline were mixed in a 2 mL syringe and inserted into the central cavity of the CTDI head phantom; D, Setting of the ROI position of the mixed CM syringe for bolus monitoring (Abbreviations: CTDI, computed tomography dose index; CM, contrast material; ROI, region of interest).
3.2. Phantom Bolus Timing
A CT dose index (CTDI) head phantom (18) has been designated by the center for devices in radiological health of the food and drug administration (FDA) as a criterion for determining the radiation dose in a head CT scan. This was used to measure kVp, mA, the radiation dose in each exposed region, CNR, and SNR with bolus timing (Figure 1B). The phantom was cylindrical with a diameter of 16 cm; it was made of two types of polymethyl methacrylate (i.e., acrylic, Lucite) and gad multiple holes for placement of an ionization chamber. To measure the radiation dose in the CTDI head phantom, a calibrated ionization chamber (UNFORS Xi, Raysafe AB, Billda, Sweden) was inserted into each of the outer cavities at the central, 0°, 90°, and 180° positions; no measurements were taken at 270˚ because of similar position of the 90° location (Figure 1C).
A thermo-hygrostat was used to keep the CT scan room at a temperature of 21°C and humidity of 45%. The ionization chamber was placed in the room for one hour before measuring the dose to improve accuracy of the measurements. The radiation dose was measured within a range of 10 mA to 50 mA, increasing in increments of 10 mA for both 100 kVp and 120 kVp. The same protocol for the monitoring scan with bolus timing was applied to the remaining scan conditions.
To examine the change in the CNR and SNR of the CM in response to variation in kVp and mA, a 2 mL syringe containing a 1: 300 mixture of CM and saline was inserted into the central cavity of the CTDI head phantom (Figure 1D). A monitoring scan was performed in the same manner using a range of 10 mA to 100 mA, increasing in increments of 10 mA for both 100 kVp and 120 kVp. To reduce Hounsfield unit (HU) and noise errors, the scan was repeated three times to determine the average measurement for each level of kVp. The CTDI was used to examine the dose variation by kVp and mA.
3.3. Image Analysis
To measure the CNR and SNR of the mixed contrast agent in the CTDI head phantom, CT images were sent to AW 4.5 (advantage workstation, GE healthcare, Milwaukee, WI) to measure HU and noise. Measurements were made in the middle of the syringe inserted into the central cavity of the head phantom (CM area) and in the lateral part of the phantom, 1 cm away from the central cavity (non-CM area). The (background) ROI image size was set at 33 mm2.
CNR and SNR were calculated using the following equations:
CNR = (CM HU - non-CM HU)/background noise,
SNR = CM HU/background noise.
To determine the mean significant difference of the CNR and SNR at 100 kVp and 120 kVp, correlation and two-tailed student’s t-tests were performed using SPSS for Windows statistical software (SPSS version 20.0 SPSS, IBM, NY, USA).
4. Results
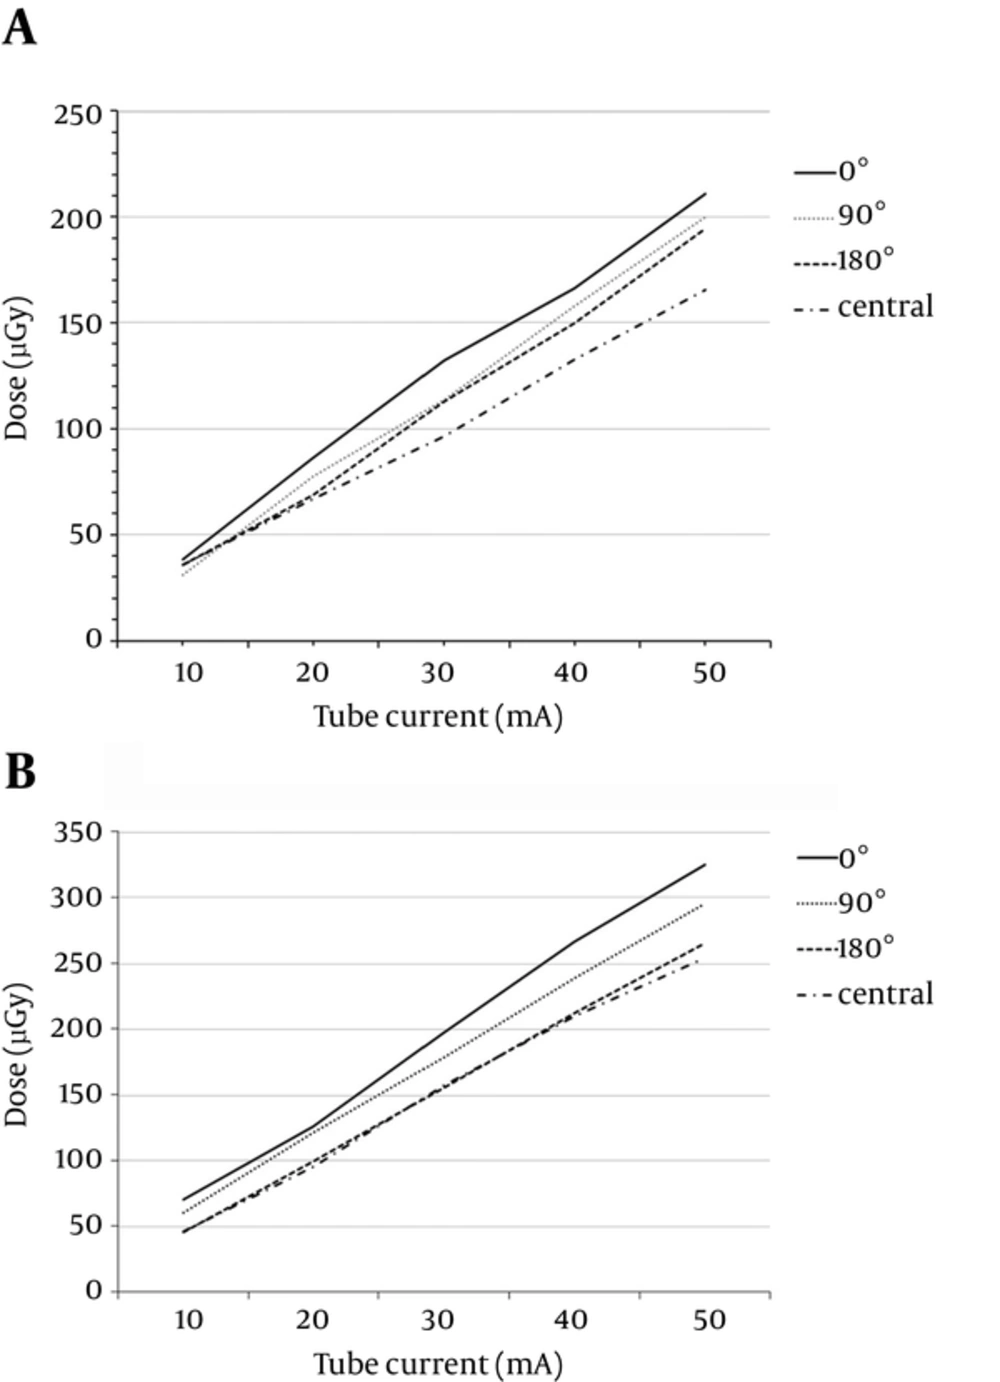
Slight variation was found among the different cavities. The smallest dose was found in the central cavity of the CTDI head phantom, with increasing doses found in the 180°, 90°, and 0° cavities for both levels of tube voltage (100 kVp and 120 kVp; Figure 2). Table 2 shows the detailed results of radiation dose at different positions for both 100 kVp and 120 kVp. When the voltage was shifted from 100 kVp to 120 kVp, the dose decreased at a higher rate in the central cavity (63.18% reduction; r = 0.995; paired t-test P Value = 0.03) than in the 0° cavity (53.16% reduction; r = 0.996; paired t-test P Value = 0.13).
. Comparison of radiation dose depending on variation in angular positioning of the CTDI head phantom using ionization chamber dosimetry. A, The radiation dose depending on variation in angular positioning of CTDI head phantom using ionization chamber dosimetry at 100 kVp; B, The radiation dose depending on variation in angular position of the CTDI head phantom using ionization chamber dosimetry at 120 kVp (Abbreviation: CTDI, computed tomography dose index).
CTA exam analysis showed that the mean number of monitoring scans per patient ranged from 4.5 to 5.4, with deviation ranging from ± 1.4 to 2.5 (Table 3). The smallest number of monitoring scans was performed in DCTL, and the largest number of radiation exposures was found in lower extremity angiographies (Table 3).
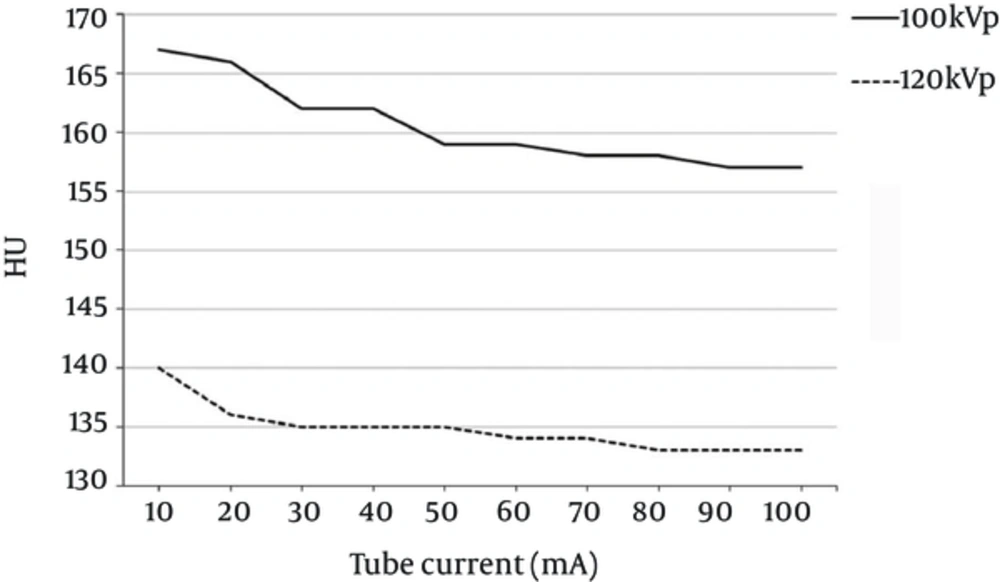
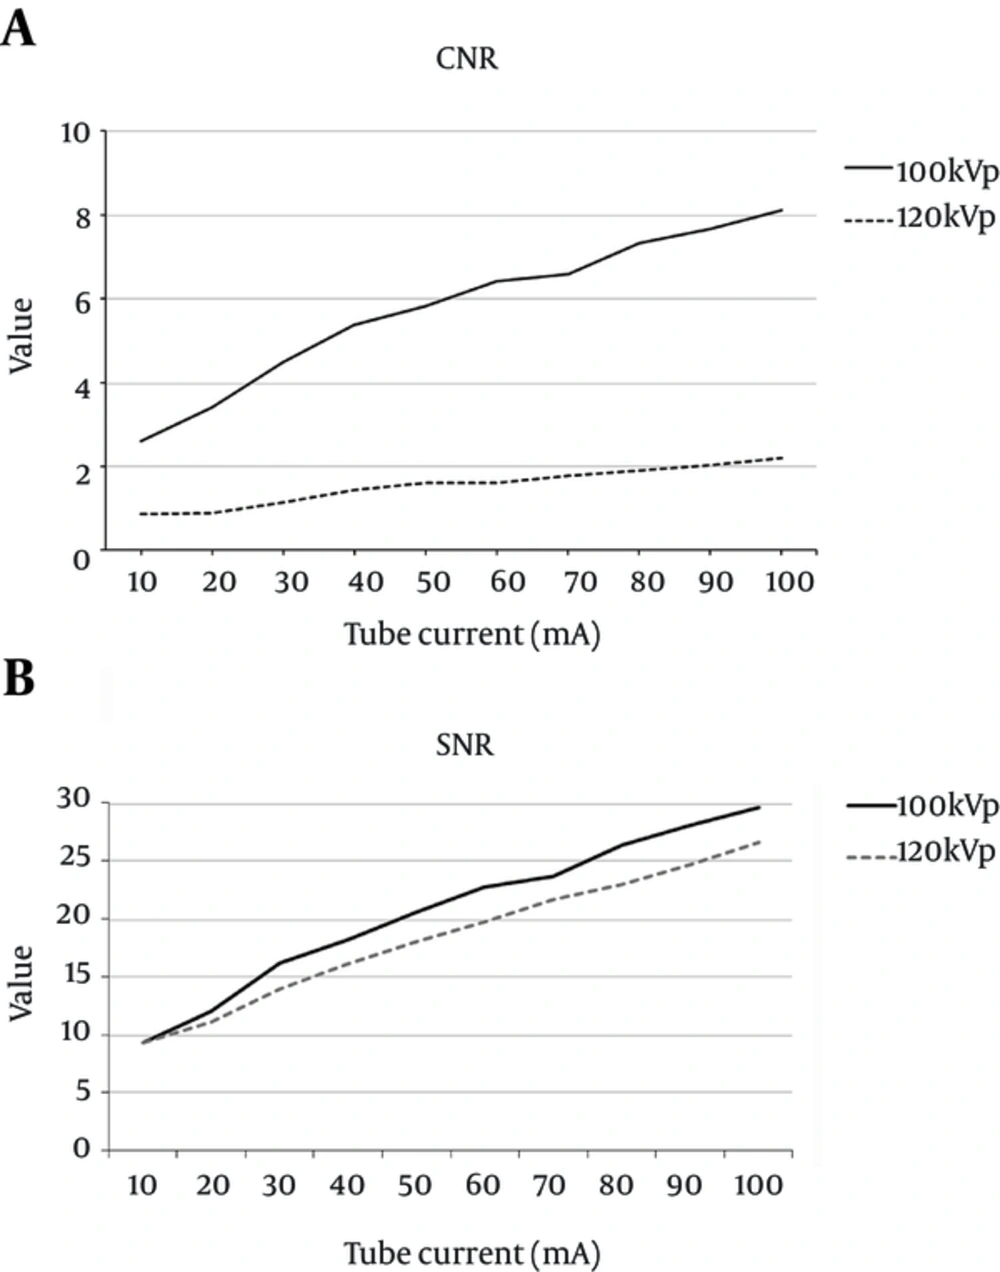
To examine HU variation in response to changes in kVp and mA during monitoring scans, a mixed CM syringe was inserted into the central cavity of the CTDI head phantom. It was found that the HU value was inversely proportional to the mA value, with a gap of approximately 25 HU, when a voltage of 100 kVp rather than 120 kVp was applied (Figure 3). When 100 kVp was used, the HU value decreased drastically until it reached 40 mA; it then began to decrease gradually at 50 mA. When 120 kVp was used, the HU value decreased drastically until it reached 20 mA and then began to lessen gradually. The CNR and SNR were used as image evaluation indices, and as shown in Figure 4, the increase in kVp and mA led to a decrease in HU and background noise. When 120 kVp was used, HU and noise decreased markedly between 10 mA and 20 mA and then began to decrease gradually at 30 mA. When 100 kVp was used, HU and noise decreased drastically until 30 mA and then began to decrease gradually at 40 mA. Consequently, at 100 kVp rather than 120 kVp, the increase of mA led to significant variation in the CNR (Figure 4A) but only slight variation in the SNR (Figure 4B).
Comparison of the quantitative image quality of the CTDI head phantom central cavity. A, Comparison of the CNRs between the mixed CM syringe and non-CM area of the CTDI head phantom central cavity; B, Comparison of the SNRs in the mixed CM syringe of the CTDI head phantom central cavity (Abbreviations: CTDI, computed tomography dose index; CM, contrast media; CNR, contrast-to-noise ratio; SNR, signal-to-noise ratio).
The correlation test showed that CNR varied in a statistically significant manner (Pearson correlation r = 0.983, Kendall’s t = 0.978, P < 0.000), while SNR showed similar results between 100 kVp and 120 kVp (Pearson correlation r = 0.997, Kendall’s t = 1.0, P < 0.000).
| Tube Voltage, kV | Tube Current, mA | Cavity Position | |||
|---|---|---|---|---|---|
| Central, µGy | 180°, µGy | 90°, µGy | 0°, µGy | ||
| 100/120 | 10 | 35.7/46 | 35.7/45.3 | 31.0/60.3 | 38.4/69.9 |
| 20 | 66.9/86 | 68.8/110.2 | 77.3/121.1 | 86.4/125.6 | |
| 30 | 96.3/156.9 | 113.1/155.3 | 113.8/178 | 132.2/197 | |
| 40 | 132.8/209.6 | 130.8/212.1 | 166.4/238.5 | 166.2/266.4 | |
| 50 | 165.4/254 | 194.3/264.8 | 182.1/295.4 | 210.9/324.8 | |
| P Value (2-tailed) | 0.03 | 0.018 | 0.011 | 0.013 | |
Abbreviations: CTDI, computed tomography dose index.
| Exams | Intravenous Flow Rate (Contrast Agent: Saline; mL/sec) | No. of Average Monitor (Exposure of Radiation) | |
|---|---|---|---|
| Dynamic study | Liver | 3.4: 3.4 | 4.5 |
| Angiography | Head and neck | 4.5: 4.5 | 5.2 |
| Pulmonary | 4.0: 4.0 | 4.6 | |
| Abdomen | 4.0: 4.0 | 4.7 | |
| Lower extremity | 4.0: 4.0 | 5.4 | |
5. Discussion
Bolus timing methods can be divided into either test bolus or bolus tracking techniques. A test bolus technique may be performed with fixed delay by injecting a small volume (approx. 5 mL) of CM before a CT scan to identify the peak HU. This makes it possible to determine the exact time of maximum peak enhancement for the trigger threshold HU prior to performing a CT scan; however, the HU value based solely on the venous system without considering the saline chaser and CM volume of the bolus can create variation in the actual CT scan (5, 9). In contrast, a bolus tracking technique makes it possible to track the CM coming into vessels while the CT scan is being performed and a timing scan of the trigger threshold HU can be performed using a relatively smaller volume of CM (5, 9, 10). Generally, the radiation emission of the CT X-ray tube is affected by the mA, time, and kVp.
The bolus timing method necessary for a CTA scan can cause repetitive radiation exposure due to the monitoring scan that is used to identify the HU value of CM. As seen in Table 3, the radiation dose by monitoring scan was higher in the lower extremity CTA than in the DCTL study. This is likely because the average number of monitoring scans in lower extremity CTA was approximately one greater than in the DCTL study. Since bolus timing method protocols may vary based on hospital standards, monitoring scan outcomes may also be affected. It is therefore necessary to reduce the radiation dose by setting a proper protocol based on the CT study, the patient’s characteristics, and properties of the CM.
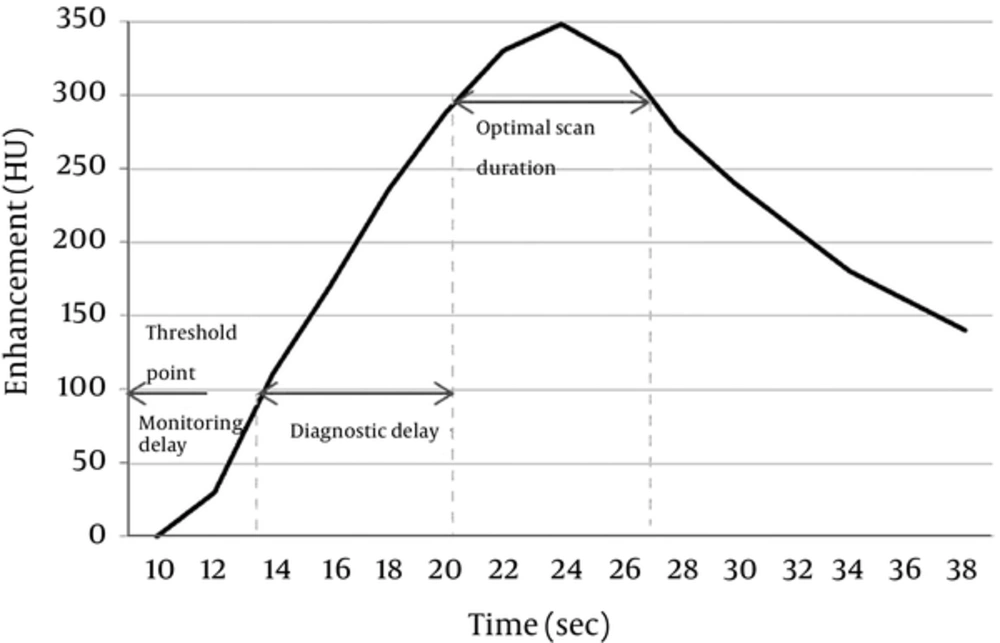
A CT scan using the bolus tracking technique begins after a time delay following repetitive exposure to radiation until the trigger threshold HU with a fixed level of kVp and mA is reached. Thus, when CTA using the bolus tracking technique is performed on a patient with vascular stenosis or an occlusion in the scan region, it is necessary to avoid unnecessary radiation exposure by decreasing the number of monitoring scans and increasing the monitoring delay. This is necessary because of the decreased blood flow in these patients (10). Such patient characteristics as weight, size, central blood volume, blood flow, age, and cardiac output should be taken into account, in addition to vascular stenosis. It is also necessary to properly determine the monitoring delay and scan delay based on the saline flush chaser and the CM injection rate, volume, and concentration (7-13, 19, 20). If a scan is performed without taking these factors into account, especially when using a CTA protocol in a patient whose lower extremity is connected intravenously via the median cubital vein, inconsistencies in the time for the CM to reach the target vein can result, leading to increased radiation exposure. Figure 5 demonstrates the contrast bolus transit time, optimal monitoring phase, and scan time after bolus timing injection in full detail.
The ideal protocol setting for a monitoring scan with bolus timing depends on the HU value in the target vein (awareness of the HU value at the trigger threshold). Use of a 120 kVp is standard in CT imaging studies for patients with a normal body type, as it produces better quality images than any other tube voltage value (2). In CTA or dynamic study CT scans with quick CM injection, the standard tube voltage can lead to images with high CNR and SNR in the ROI and can reduce the radiation dose (1, 2, 21). As shown in Figure 3, the HU value decreased with an increase in mA (100 kVp: 40 mA; 120 kVp: 20 mA), but it began to change insignificantly at a certain mA value (100 kVp: 50 mA; 120 kVp: 30 mA). At a constant mA value, the HU value depended more heavily on the kVp level (9). Background noise exhibited a similar correlation with mA to that of the HU value. That is, when 100 kVp was used, background noise decreased drastically until a value of 40 mA was reached (120 kVp: 20 mA), while it began to decrease gradually at 50 mA (120 kVp: 30 mA). To obtain accurate CTA images, it is important to determine an effective scan delay duration when the CM reaches the peak of maximum enhancement during the actual CTA. Therefore, the level of mA in a monitoring scan should be determined from the point of inflection of the HU value based on the level of kVp (100 kVp: 50 mA; 120 kVp: 30 mA). Since this outcome is based on the use of a CTDI head phantom, a patient who weighs more may require a higher level of mA.
The CTDI is a unit related to the energy of the diagnostic X-ray CT scanners for the patient. Generally, the CTDI depends on the kVp and mA chosen to perform the CT study (22). In this study, with an increasing mA, the radiation dose was found to be largest in the central cavity of the CTDI head phantom using an ionization chamber, with decreasing values in the 180°, 90°, and 0° cavities (Figure 2). However, at a voltage of 120 kVp, there was greater variation in the radiation dose in the central cavity of the CTDI head phantom. Thus, when the tube voltage is lowered from 120 kVp to 100 kVp, the radiation dose can be decreased by 53.16% in the 0° cavity and by 63.18% in the central cavity. At 100 kVp, the radiation dose was estimated to be 649 µGy in the central cavity and 310 µGy in the 0° cavity. At 120 kVp, it was estimated to be 1,024 µGy in the central cavity and 1,298 µGy in the 0° cavity, based on results from the monitoring scan in the head phantom at this hospital (4.88 monitoring scans on average; 40 mA for the entire scan). This shows that the increase in kVp and the number of monitoring scans led to a drastically greater amount of radiation exposure.
The international commission on radiological protection (ICRP) reports that organs with relatively higher tissue-weighting factors for the effective dose are located in the 0° part of the human body and include the lungs, coronary arteries, thyroid, and breasts (23, 24). The highest dose was also found at the 0° position of the head phantom in the experiment, as shown in Figure 2. It is therefore necessary to minimize the number of repetitive monitoring scans in organs such as the lungs, coronary arteries, thyroid, and breasts, as they have higher tissue-weighting factors and are located in the 0° part of the human body.
In the bolus tracking technique, helical CT scans have typically been performed by pressing the start button after the operator has confirmed that the CM has reached the trigger threshold via a real-time monitoring scan. At present, however, a scan is automatically performed when CM reaches the trigger threshold without the operator’s confirmation. Thus, when a bone with high X-ray attenuation or a metal substance is present around an ROI cursor for bolus tracking, dark or streak artifacts can be generated due to beam hardening effects (25). Although in some cases, the motion artifacts caused by breathing can prevent the CM from coming into the vein, the artifacts may also cause the HU value to exceed the trigger threshold, leading to a helical CT scan (26). When artifacts are likely to be generated around the target vein for an ROI cursor, it is necessary to locate the ROI in another vein and to make the ROI as small as possible so that it is not pushed out of the vein when the patient breathes.
This study has the limitation that it failed to prospectively show variation in the real-time monitoring radiation dose (kVp and mA) and did not describe how those variations affect the final images. For example, it did not identify the effects of factors like the intravenous CM injection spot, injection rate, CM volume, CM concentration, saline flushing, or patient characteristics, such as weight and size, central blood volume, blood flow, age, cardiac output, and degree of hydration, on monitoring scans with different values of kVp and mA, and consequently the CTA image. Furthermore, the results were collected from monitoring scans using a bolus tracking protocol specific to the Korean national cancer center. Thus, variations in the trigger threshold value (100), monitoring delay, scan delay, kVp, mA, patient distribution, IV line gauge, CTA scan type, and CM type could lead to a number of different monitoring scan results. Another limitation is that only a head phantom was used instead of utilizing multiple types of phantoms. This limited the study’s ability to show an association between variation in the radiation dose and bolus tracking for each body part.
When the bolus timing method was used in CTA exams, patients are generally exposed to excessive radiation due to repetitive monitoring scans. Thus, it is necessary to use the minimum voltage level 100 kVp, 50 mA; 120 kVp, 30 mA at which the HU value at the trigger threshold is not significantly different from that in actual helical scans. When using a voltage of 100 kVp on deep parts of the body, it was found that the radiation dose decreased at a higher rate, while the CNR and SNR were both slightly higher.
