


1. Background
2. Objectives
3. Patients and Methods
3.1. Patients
3.2. Technical Imaging Parameters
3.3. BMI and Noise
3.4. Image Analysis
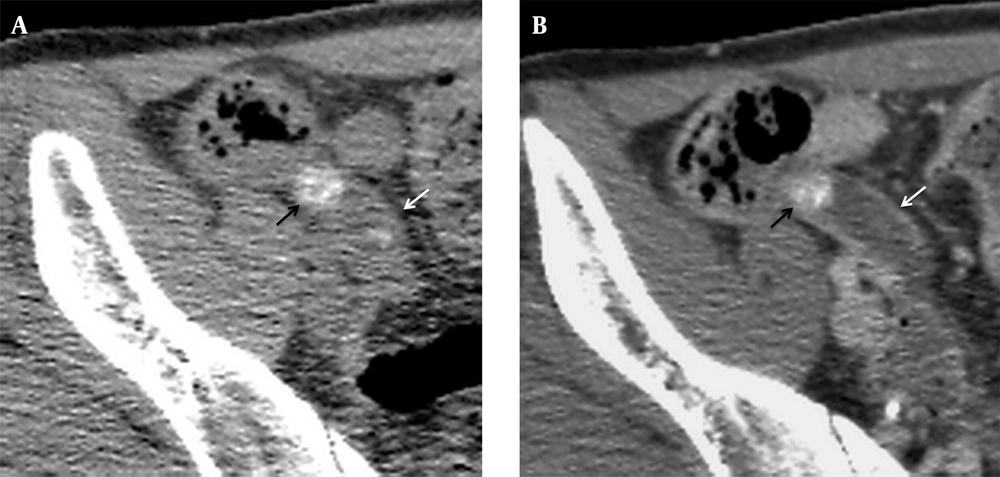
A, Axial NE-LDCT and B, CE-SDCT images of a 29-year-old woman with acute appendicitis show appendicolith impaction (black arrow) with enlarged appendix and wall thickening (white arrow). Both reader 1 and reader 6 (1-year resident) assigned a score of 5 (definitely appendicitis) for the diagnosis of appendicitis on NE-LDCT and CE-SDCT. The BMI was 18.4 kg/m2. The dose-length product was 291.2 and 630.8 mGy cm, respectively.
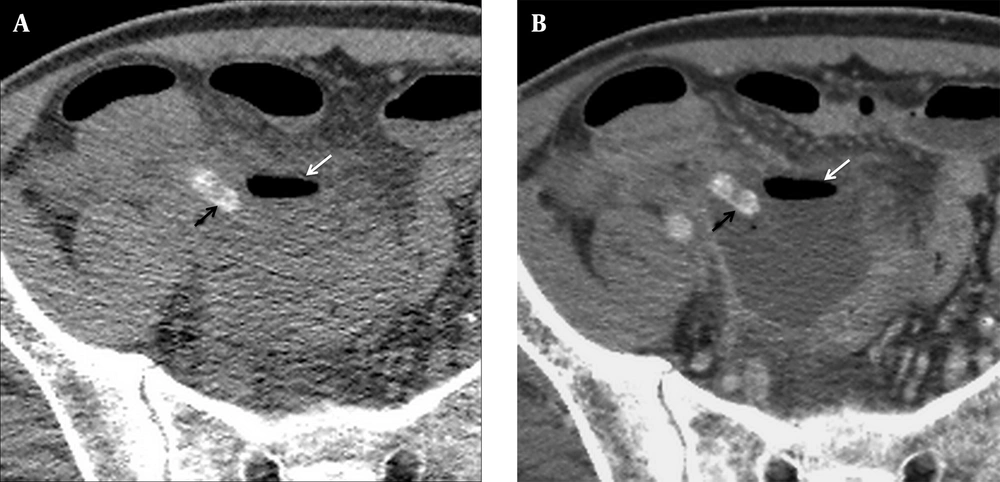
A, Axial NE-LDCT and B, CE-SDCT images of a 51-year-old man with ruptured appendicitis show extraluminal appendicolith (black arrows) with extraluminal gas in the abscess formation (white arrows). Reader 1 and reader 6 assigned a score of 5 and 4 (probably appendicitis) for the diagnosis of appendicitis on NE-LDCT and CE-SDCT. The BMI was 19.8 kg/m2. The dose-length product was 267.7 and 627.8 mGy cm, respectively.
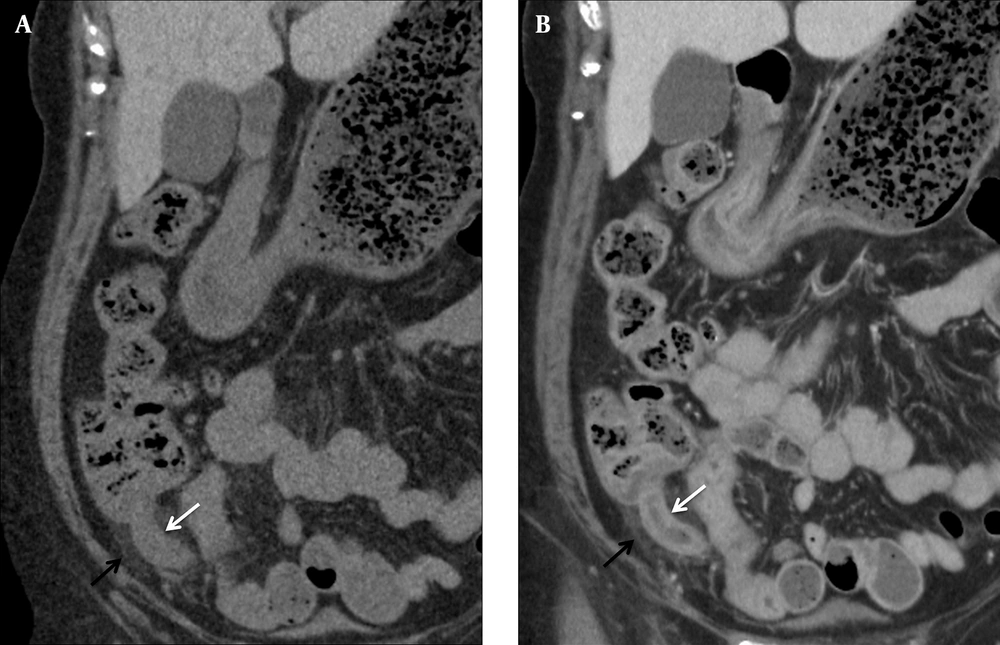
A, Coronal NE-LDCT and B, Coronal CE-SDCT images of a 64-year-old woman with acute appendicitis show dilated appendix (white arrows), wall thickening, and surrounding fat stranding (black arrows). Reader 1 and reader 6 assigned a score of 5 and 1 (definitely not appendicitis) for the diagnosis of appendicitis on NE-LDCT and a score of 5 and 5 on CE-SDCT. The BMI was 23.6 kg/m2. The dose-length product was 239.6 and 647.9 mGy cm, respectively.
3.5. Final Diagnosis
3.6. Statistical Analysis
4. Results
4.1. Diagnoses and Treatments
| Alternative Diagnoses | 44 Patients |
|---|---|
| Gastrointestinal disorder | 26 |
| Diverticulitis/diverticulosis | 18 |
| Colitis/ enteritis | 5 |
| Colon cancer | 1 |
| Small bowel perforation | 1 |
| Periappendicitis | 1 |
| Gynecological disorder | 10 |
| Tubal-ovarian abscess | 3 |
| Pelvic inflammatory disease | 3 |
| Hemorrhagic ovarian cyst | 2 |
| Endometrioma | 2 |
| Urinary tract stones | 4 |
| Peritonitis | 2 |
| Mesenteric adenitis | 1 |
| Acute pancreatitis | 1 |
4.2. Comparison of Diagnostic Performance of NE-LDCT and CE-SDCT
| Reader | NE-LDCT | CE-SDCT | P Value | ||
|---|---|---|---|---|---|
| AUC | 95% CI | AUC | 95% CI | ||
| R1 | 0.970 | 0.916 to 0.994 | 0.963 | 0.905 to 0.990 | 0.738 |
| R2 | 0.952 | 0.891 to 0.985 | 0.944 | 0.880 to 0.980 | 0.768 |
| R3 | 0.972 | 0.918 to 0.994 | 0.953 | 0.892 to 0.985 | 0.433 |
| R4 | 0.924 | 0.854 to 0.967 | 0.973 | 0.920 to 0.995 | 0.050 |
| R5 | 0.888 | 0.809 to 0.942 | 0.946 | 0.882 to 0.981 | 0.053 |
| R6 | 0.824 | 0.736 to 0.893 | 0.882 | 0.803 to 0.938 | 0.252 |
a Abbreviations: AUC, area under the curve, CE-SDCT, contrast enhanced standard dose computed tomography; CI, confidence interval; NE-LDCT, non-enhanced low dose computed tomography; R, reader.
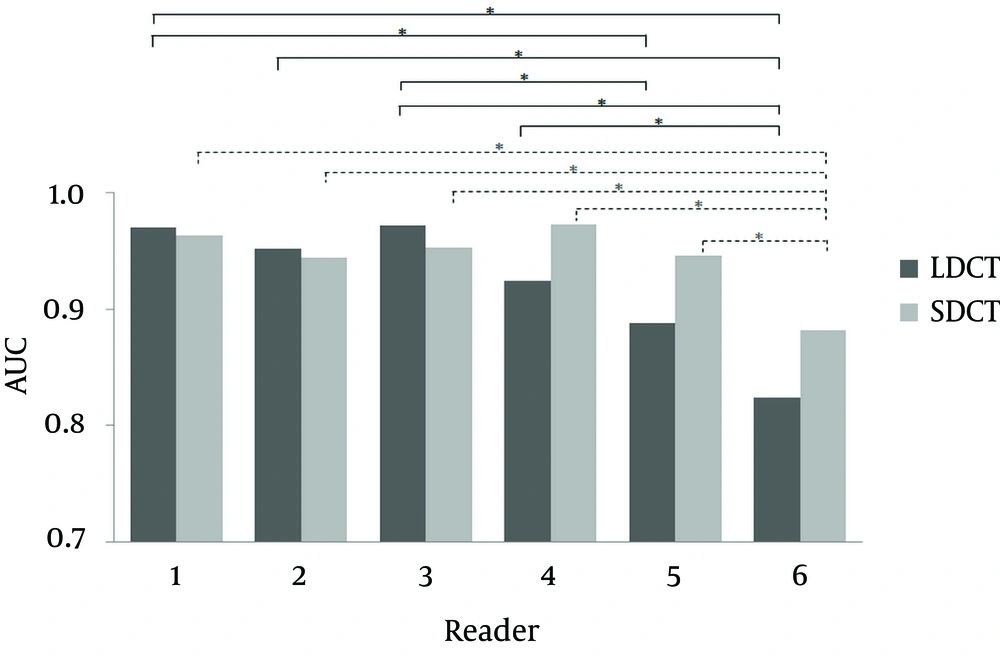
Bar charts of AUC values for the diagnosis of acute appendicitis on NE-LDCT and CE-SDCT of six readers. Statistically significant inter-observer comparisons (P < 0.05) of AUC values on both NE-LDCT (solid line) and CE-SDCT (dash line) are denoted by * (CE-SDCT, contrast enhanced standard dose computed tomography; NE-LDCT, non-enhanced low dose computed tomography; AUC, area under the curve).
4.3. BMI, Radiation Dose, and Image Noise
4.4. Comparison of Diagnostic Accuracy with BMI and Image Noise
| Sen | Spe | Acc | |
|---|---|---|---|
| NE-LDCT | |||
| R1 | 91.7 | 92.5 | 92.1 |
| R2 | 89.6 | 84.9 | 87.1 |
| R3 | 85.4 | 96.2 | 91.1 |
| R4 | 93.8 | 81.1 | 87.1 |
| R5 | 85.4 | 81.1 | 83.2 |
| R6 | 56.3 | 94.3 | 76.2 |
| CE-SDCT | |||
| R1 | 93.8 | 94.3 | 94.1 |
| R2 | 93.8 | 83.0 | 88.1 |
| R3 | 97.9 | 86.8 | 92.1 |
| R4 | 97.9 | 90.6 | 94.1 |
| R5 | 91.7 | 92.5 | 92.1 |
| R6 | 60.4 | 94.3 | 78.2 |
a Abbreviations: Acc, Accuracy; CE-SDCT, contrast enhanced standard dose computed tomography; NE-LDCT, non-enhanced low dose computed tomography; R, reader; Sen, Sensitivity; Spe, Specificity.
b Data are presented as percentage.
