1. Introduction
Peliosis hepatis (PH) is a rare benign disease that is detected in liver imaging (1). It is characterized by the dilatation of the hepatic sinusoids presenting as variable-sized, blood-filled cystic spaces on pathology. Although the exact pathogenesis of PH is unknown, it has been associated with malignancies, immunosuppression, chronic wasting disease, infection, and certain medications such as anabolic steroids, corticosteroids, or oral contraceptives (1, 2). It is difficult to diagnose PH, because its imaging features are non-specific and can appear similar to malignant tumors, metastasis, or abscesses (3-6). Here, we present a case of a large PH in a serious alcoholic patient who was hepatitis B antigen-positive. The patient was examined by liver dynamic magnetic resonance imaging (MRI) using the Gadolinium ethoxybenzyl diethylenetriamine pentaacetic acid (Gd-EOB-DTPA) hepatocyte-specific MRI contrast agent. We also review the literature on PH in relation to its pathology and the imaging findings of Gd-EOB-DTPA liver MRI.
2. Case Presentation
A 57-year-old male was referred to our institution by a local clinic due to uncontrolled type II diabetes mellitus and a large hepatic mass detected incidentally on ultrasonography (US). The patient had experienced an 18-kg weight loss during the previous 3 months as well as general weakness. A physical examination revealed no specific abnormality. Laboratory testing showed a mild elevation of both aspartate transaminase (43 IU/L) and alanine transaminase (51 IU/L). The patient’s fasting blood glucose level was 518 mg/dL, and his glycated hemoglobin (Hb A1c) level was 14.6%. The hepatitis B antigen was determined as positive, but the tumor marker alfa fetoprotein was within the normal range.
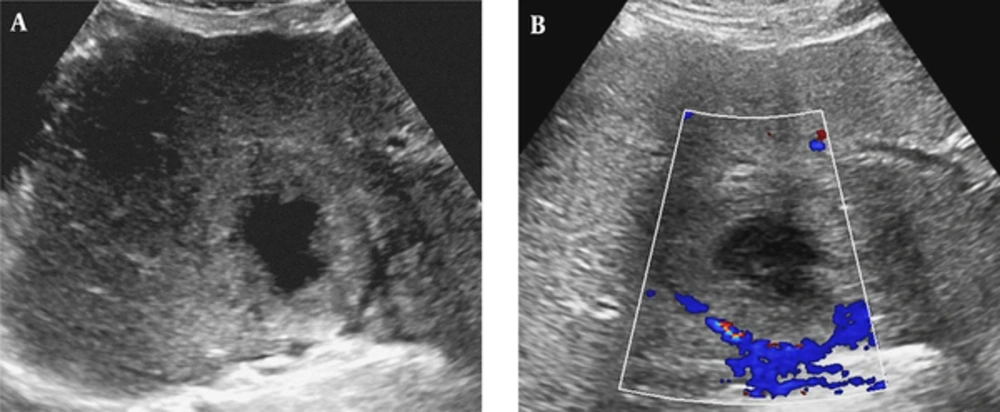
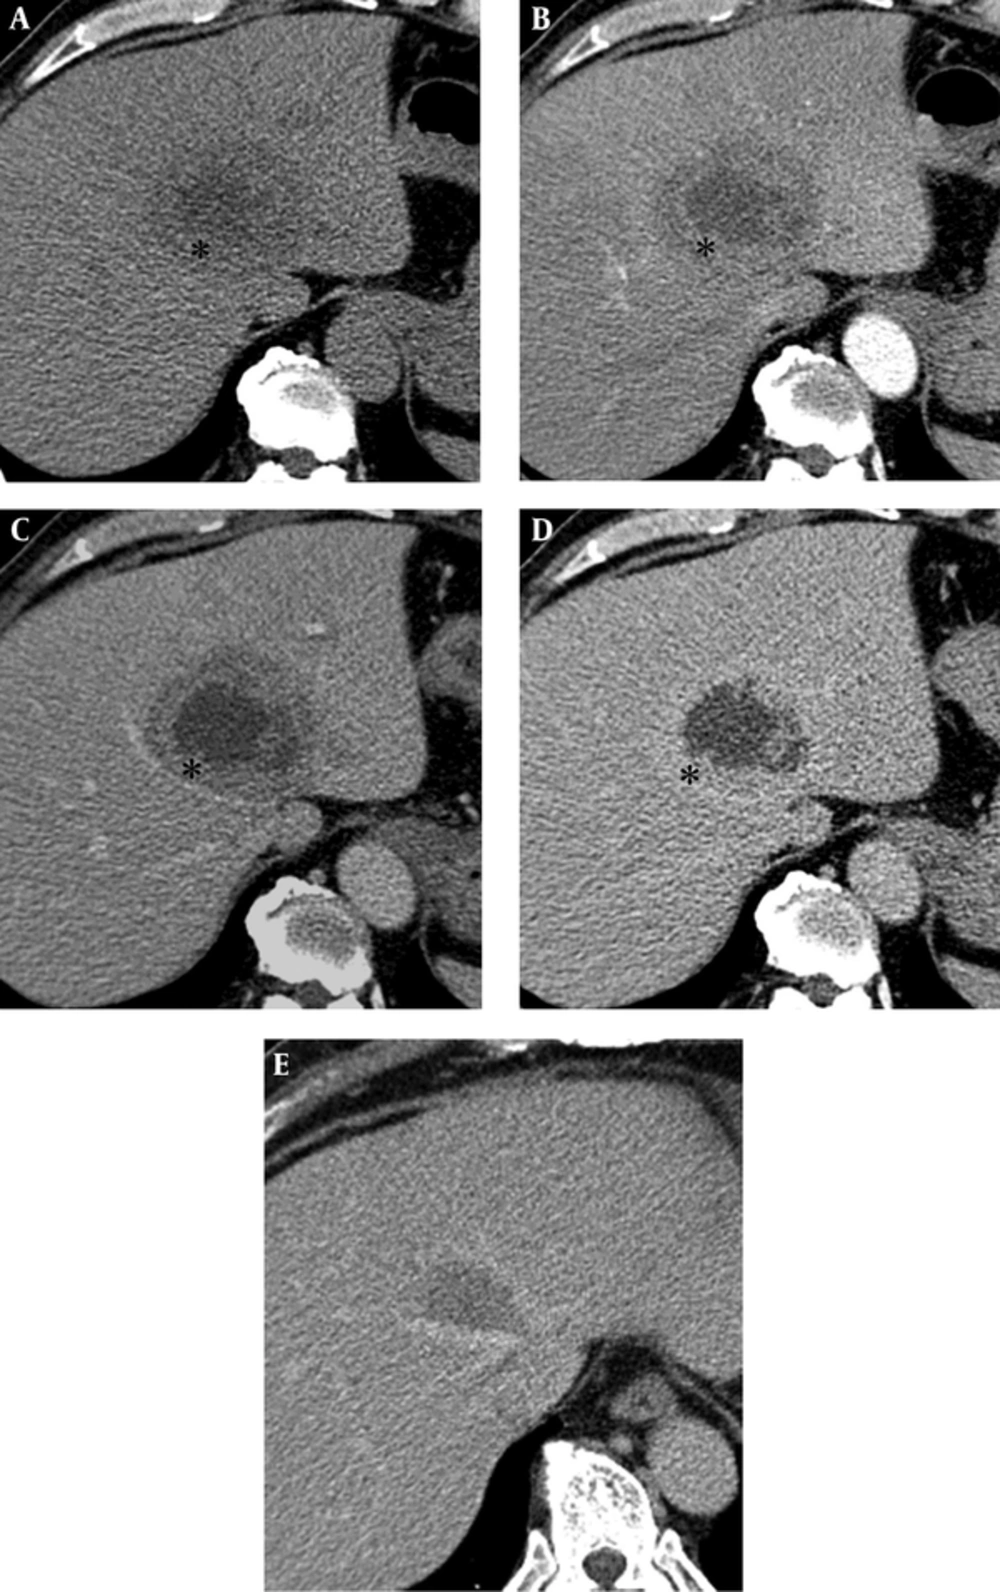
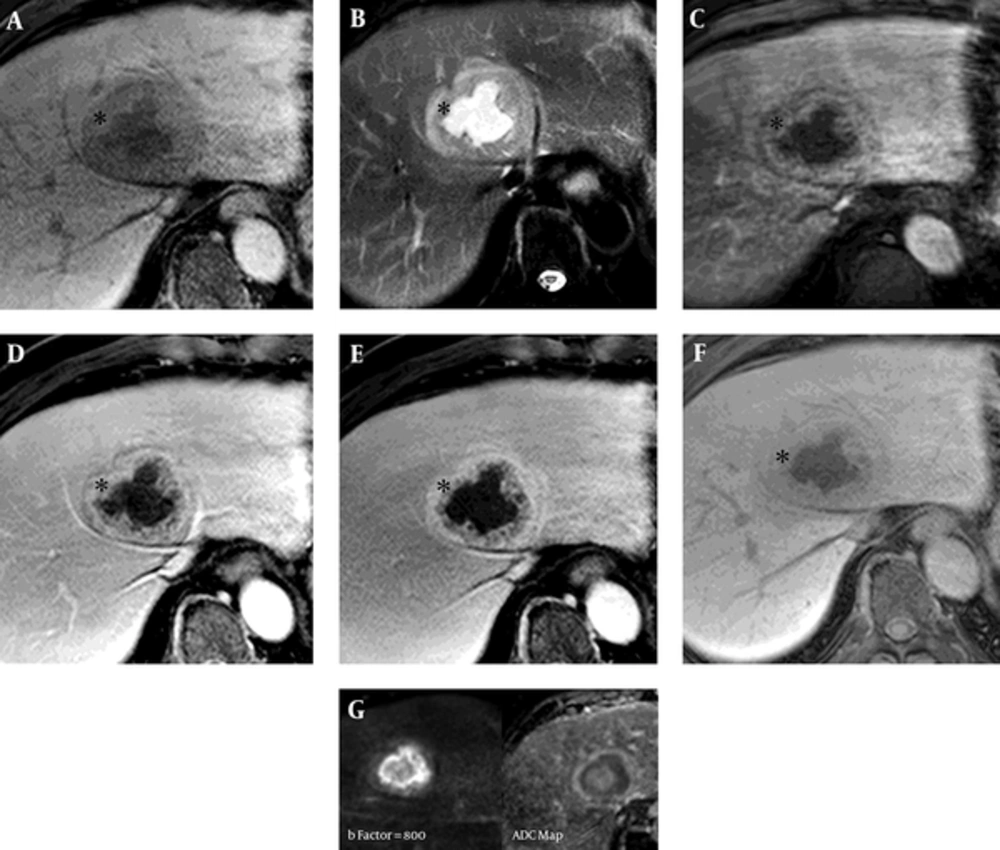
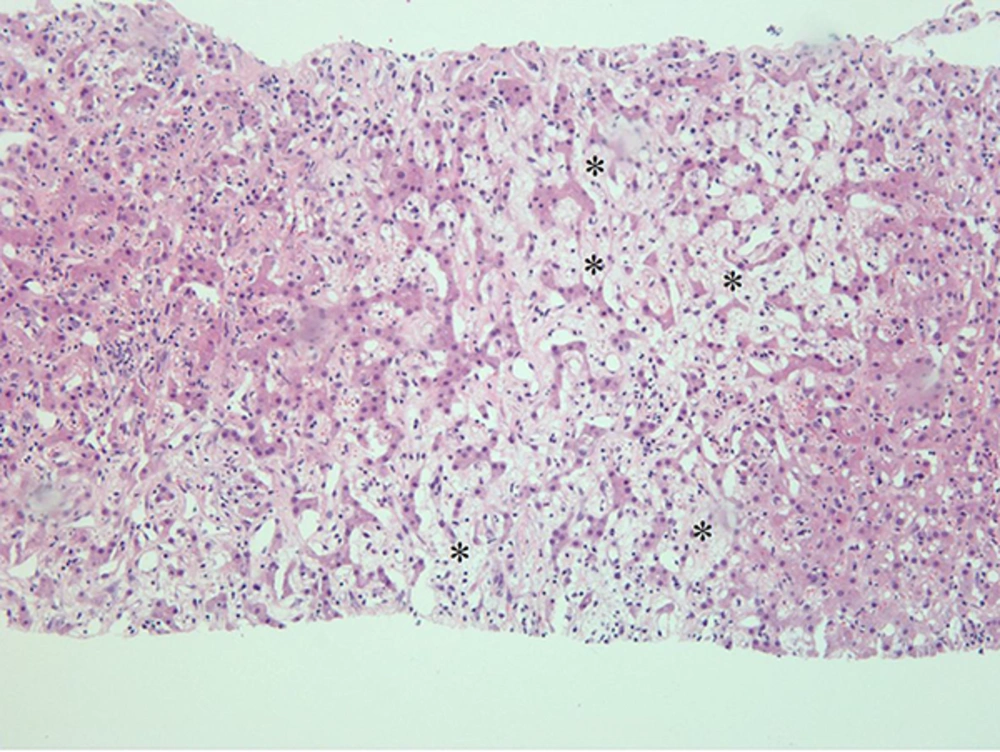
On a transabdominal US examination at our hospital, an ill-defined hyperechoic mass of approximate size 6.5 cm was detected in hepatic segment IV. It had a central irregular anechoic lesion, and a color Doppler US indicated no increased blood flow to the lesion (Figure 1A and 1B). A four-phase liver dynamic multidetector computed tomography (MDCT) scan was then performed. The mass was located at the dome of hepatic segment IV between the middle and left hepatic veins. However, there was no observed mass effect caused by the mass. On pre-contrast phase imaging, the mass showed a triple-density-layered pattern consisting of a central low density area surrounded by a middle thick isodensity layer adjacent to the normal liver parenchyma that was engulfed by a low attenuation outer layer, which suggested perilesional edema (Figure 2A). The middle thick layer that was found to be isodense on pre-contrast CT was enhanced persistently and strongly during the arterial to delayed phase (Figure 2B - 2D). The outer low density layer, which suggested perilesional edema, showed as isodense on the 3 minutes delayed phase (Figure 2D). An MRI was then performed using dynamic imaging, including imaging in the arterial phase (30 seconds), portal venous phase (60 seconds), and transitional phase (3 minutes), in addition to the hepatobiliary phase (20 minutes), after administration of 0.1 mmol/kg Gd-EOB-DTPA (Primovist®; Bayer Healthcare, Berlin, Germany). The mass showed a low-signal intensity on T1-weighted imaging (Figure 3A). On T2-weighted half-Fourier acquisition turbo spin-echo images, the mass had triple signal intensities such that the central lesion was strongly hyperintense, similar to the signal intensity of cerebrospinal fluid, the middle thick layer was isointense to intermediate hyperintense, and the outer layer was hyperintense (Figure 3B). The middle thick layer of the lesion was persistently strongly enhanced from the arterial to the transitional phase (Figure 3C - 3E). On hepatobiliary phase imaging, the lesion was still visible, but showed less intense enhancement compared with the adjacent normal liver parenchyma (Figure 3F). The middle thick irregular layer showed a decreased value for the apparent diffusion coefficient (ADC), and the central portion showed a high ADC value (Figure 3G). Under US guidance, several target biopsies were performed on both lateral sides of the lesion, and the lesion was finally diagnosed as PH (Figure 4). This patient was treated with a broad spectrum cephalosporin antibiotic (Cefotaxime) for parenteral administration. After 2 month follow up, PH had been reduced from 6.5 cm to 3.5 cm (Figure 2E).
Ultrasonography (US) of a 57-year-old man with a 6.5 cm solitary peliosis hepatis undergoing a large central cystic change. A, Grayscale transabdominal US shows an ill-defined hyperechoic lesion in S4 of the liver. An irregular large anechoic cystic content is noted in the central portion of the lesion; B, Color Doppler US shows no increased vascularity of the lesion.
Multidetector computed tomography (CT) of a 57-year-old man with a 6.5 cm solitary peliosis hepatis undergoing a large central cystic change. A, A pre-contrast axial CT scan shows an ill-defined lesion with a triple layered appearance. The central portion is of low density, and the middle irregular thick layer (*) shows as isodense compared with the adjacent liver parenchyma, while the outer layer shows a hypodense rim similar to perilesional edema; B, C, After contrast medium enhancement, the middle irregular thick layer (*) shows strong enhancement from the arterial to delayed phase; D, A perilesional low density halo disappeared at the delayed phase. The central low density area does not show any enhancement; E, PH has been decreased in size from 6.5 cm to 3.5 cm 2 months after conservative treatment with antibiotics.
Liver magnetic resonance imaging (MRI) of a 57-year-old man with a 6.5 cm solitary peliosis hepatis undergoing a large central cystic change. A, Liver MRI was performed using dynamic imaging, including imaging in the arterial phase (C, 30 seconds), portal venous phase (D, 60 seconds), and transitional phase (E, 3 minutes), as well as the hepatobiliary phase (F, 20 minutes), after administration of 0.1 mmol/kg Gd-EOB-DTPA. The lesion is hypointense on pre-contrast T1-weighted imaging; B, On T2-weighted half-Fourier acquisition turbo spin-echo images, it shows a triple signal intensity. The central area shows as hyperintense, similar to cerebrospinal fluid, and the thick middle layer (*) shows iso- to slight hyperintensity compared with the adjacent liver parenchyma; C - E, The peripheral area shows as a hyperintense halo. In comparison with the CT scans, the thick middle layer (*) surrounding the central cystic lesion shows more intense enhancement compared with the adjacent liver parenchyma from the arterial to the transitional phase (3 minutes); F, On hepatobiliary phase, the thick middle layer (*) has been enhanced, but less strongly than the adjacent liver parenchyma; G, The enhancing peripheral lesion shows decreased diffusivity on diffusion weighted image (b factor, 800) and ADC map (ADC, 1.04 × 10⁻³mm2/s).
3. Discussion
PH is a rare benign disorder characterized by dilatation of the hepatic sinusoids and the presence, along with the hepatic parenchyma, of blood-filled lacunar spaces of various sizes. Although the exact pathogenesis of PH remains unclear, it may result from necrosis of the hepatocytes and a blockage in the hepatic blood outflow at the junction of the sinusoids and centrilobular veins (2).
PH is frequently related to various conditions, such as chronic wasting disease, tuberculosis, malignancies, immunosuppression, diabetes, and chronic alcoholism as well as certain medications such as anabolic steroids, corticosteroids, tamoxifen, or oral contraceptives. Our patient had uncontrolled type II diabetes and chronic severe alcoholism (1, 2).
The diagnosis of PH is difficult because the disease lacks specific radiologic findings (4, 5, 7). On sonography, the echo pattern of PH varies and is inhomogeneous (5). MDCT and MRI are helpful for detecting and diagnosing PH. On pre-contrast CT scans, PH was found to have a low density or isodensity compared with the liver parenchyma. After bolus administration of a contrast material, PH showed a gradual enhancement from the arterial to delayed phases. The lesions may show as a low density area or as central enhanced foci on arterial phase and become more prominently enhanced on portal and delayed phase scans. Centrifugal pattern enhancement and the absence of a mass effect are characteristic imaging findings of PH (3-5). However, PH presenting as a solitary mass is very rare, and only a few case reports have been published to date. A large PH with a prominent central cystic change like our case has not, to our knowledge, been previously reported, and this makes our case more difficult to differentiate from other malignant tumors or abscesses. The PH in our case showed intense enhancement from the arterial phase, and this enhancement was prolonged into the transitional and hepatobiliary phases. There was also no mass effect, even though the lesion was large and abutted into the middle hepatic vein. These imaging findings were similar to previously established PH imaging features (3-5). The large central cystic lesion was thought to be necrosis of a malignant tumor or pus from an abscess. However, it was finally considered to be a hemorrhage resulting from the destruction of the hepatic sinusoids, probably caused by a massive hemorrhage due to the rupture of the PH (8, 9). These imaging features, especially in MR imaging features using the extracellular contrast agent, are nonspecific and similar as other hypervascular hepatic tumors.
Gd-EOB-DTPA has unique characteristic pharmacodynamics during MRI imaging. In the vascular phase, this agent acts as a conventional nonspecific extracellular contrast agent. In the delayed phase at around 20 min, this agent is actively transported from the sinusoidal space into hepatocytes via organic anion transporting polypeptides and causing intense hepatic parenchymal enhancement (10). By this mechanism, uptake by functioning hepatocytes in the delayed phase provides additional information for detection and characterization of various hepatic lesions (11). Among the various hepatic lesions, PH should be differentiated from regenerative or dysplastic nodule, adenoma, hemangioma and focal nodular hyperplasia (FNH) because these lesions show persistent enhancement during the dynamic phase or isointensity in the hepatobiliary phase. Regenerative or dysplastic nodule is commonly encountered in the cirrhotic liver. This lesion is usually isosignal intensity in the hepatobiliary phase and this lesion does not show intense enhancement beyond arterial or portal phases. Adenoma is one of hypervascular tumor thus it shows well enhancement in the arterial phase and isosignal intensity in the portal phase. However, adenoma shows defect in the hepatobiliary phase. Hemangioma is common benign hypervascular mass and its signal intensity on the dynamic MR image is similar as the enhancing vascular signal intensity. But, hemangioma shows pseudo-washout in the hepatobiliary phase. FNH is the second most common benign hepatic tumor. It consists of aggregates of hepatocytes and biliary structures without connection to the adjacent biliary tree. FNH shows marked uniform enhancement in the arterial phase. This enhancement is lessening but persistent during portal and delayed phases, the lesion signal intensity is similar as that of the surrounding hepatic parenchyma. FNH represents as isointense or hyperintense to the normal liver in the hepatobiliary phase. Malignant tumors such as hepatocellular carcinoma, cholangiocarcinoma or metastasis show variable enhancement pattern in the dynamic MR image, however, these lesions represent as hypointense to the normal hepatic parenchyma in the hepatobiliary phase (11). PH consists of normal hepatocytes and dilated sinusoids (2). Theoretically, it will take up the Gd-EOB-DTPA contrast agent and present as a hyperintense lesion on hepatobiliary phase imaging. Kim et al. reported hyperintense HCC on hepatobiliary phase images of Gd-EOB-DTPA MRI and noted that the change in peliosis around the HCC was significant on pathologic analysis (12).
The PH in our case showed strong persistent enhancement from arterial to portal phase, similar as other studies using conventional extracellular contrast agent (11). This enhancement had been maintained to the hepatobiliary phase. Persistent delay enhancement of PH in our case is similar with the enhancement pattern of FNH, because both FNH and PH is consist of the normal hepatocytes. The PH in our case showed persistent, but reduced, enhancement compared with the adjacent liver parenchyma on hepatobiliary phase. We considered that relatively low density of hepatocyte caused by sinusoidal dilatation in PH might be cause of relatively less enhancement of the PH compared with the adjacent normal liver parenchyma on hepatobiliary phase imaging. Thus, we suggest that this persistent enhancement feature of PH on hepatobiliary phase imaging should be considered as an important differential point because this imaging feature results from normal functioning hepatocytes, in addition to the characteristic centrifugal enhancement pattern and lack of a mass effect.
In conclusion, we reported a rare case of a large solitary PH with a large central cystic area, which showed persistent enhancement on Gd-EOB-DTPA MRI. Persistent enhancement on hepatobiliary phase imaging as well as ongoing intense enhancement during the dynamic phase, in addition to the absence of a mass effect, are considered to be the characteristic imaging features of PH.


