1. Background
Proximal femoral geometry has gained so much attention during the last two decades (1-3). Variable radiological measures have been introduced to help radiologists and orthopedic surgeons to diagnose diseases, evaluate surgeries, and plan for surgical interventions (2-4). By introduction of picture archiving and communication systems (PACS) which became widespread and the standard radiological viewing tool in many orthopedic clinics, radiologists and orthopedic surgeons became more able to measure angles and distances even in a more precise manner (5, 6).
Many studies in the literature focused on the proximal geometry of the femur using cadaveric samples, X-rays or computed tomography, demonstrated substantial differences in the proximal femoral geometry in different patient groups. Many radiological parameters have been introduced in the literature to aid in diagnosis and surgical interventions (4, 7, 8).
Few studies focused on the anatomical location of the fovea capitis in the femoral heads, while other researchers studied the anatomical variations of the ligamentum teres and its artery which has its terminal branches piercing the fovea capitis (9-13). However, it is strange that searching the literature did not reveal any study focusing on the fovea capitis variant configurations and size changes related to the aging process.
2. Objectives
The main purpose of this radiological study was two-fold, to assess the diameter of the femoral head fovea capitis in different age groups and genders to determine its size related changes with aging process and to record the different anatomical configurations of the fovea capitis.
3. Patients and Methods
After getting the approval of the local ethics committee with a protocol number of 2070-GOA and decision number 2015/12-34, 600 true pelvis anteroposterior radiographs were obtained for patients between ages 20 and 80 years. The patients were divided into three groups of two hundreds. Group 1 patients were 20 to 39 years old (male, n = 100; female, n = 100), group 2 patients were 40 - 59 years old (male, n = 100; female, n = 100) and group 3 patients were 60 - 80 years old (male, n = 100; female, n = 100).
The inclusion criteria in this study were age between 20 and 80 years, no previous hip surgery, no metabolic bone disease history, no history of hip dysplasia, and no hip associated pathologies. A total of 600 hip pelvis AP views with 1200 hip views were obtained for this study.
To verify the normality assumption for each group associated subgroups of data, the goodness of fit test was used. The subgroups were found normally distributed in each group and there was no statistical significance between the left and the right sided parameters of each subgroup of the three groups with P > 0.05 in all cases.
To compare the values of the parameters between males, females and general values the unpaired t-tests were used, where the significance was set at P <0.05.
3.1. Radiological Measurement
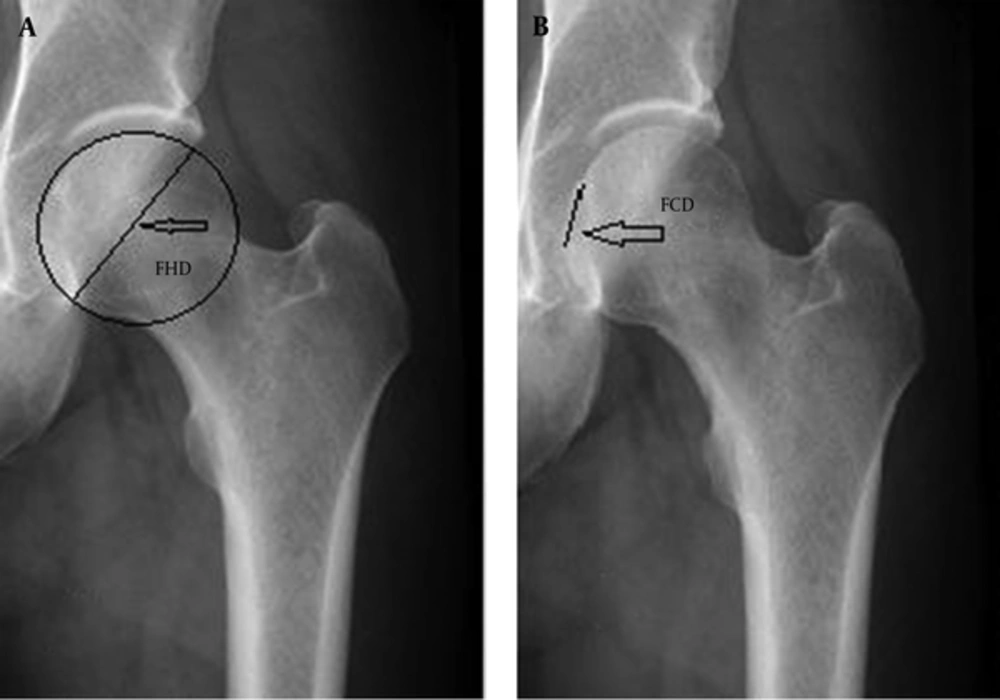
Fovea capitis index was introduced to eliminate the minimal magnification differences between the obtained true AP pelvis views. Fovea capitis index (Acar’s index) was determined by measuring the diameter of the fovea capitis on true AP hip view from the upper border to the lower border of fovea capitis multiplied by 100 and divided by the femoral head diameter at its widest points; fovea capitis index (Acar’s index) = (fovea capitis diameter (FCD) × 100) ÷ (femoral head diameter) (Figure 1).
Anteroposterior view of the left hip joint A, This image shows the diameter of the femoral head by measuring the diameter of a complete circle around the femoral head. B, This image shows the diameter of fovea capitis by measuring the fovea capitis length from its upper margin to the lower margin. The fovea capitis index equation (FCI) = (fovea capitis diameter (FCD) × 100) ÷ (femoral head diameter).
To make the description of variant fovea capitis configuration easy, the same terminologies used to describe the femoral head pathologies (including coxa magna, and coxa plana) were used to describe fovea capitis variant sizes.
Since the majority (higher than 97% of the measured indexes or 1164 out of 1200) of fovea capitis indexes ranged between 18% and 35%, fovea capitis with fovea capitis indexes smaller than 18% was called fovea capitis brevis; whereas, fovea capitis with fovea capitis indexes larger than 35% were called fovea capitis magna.
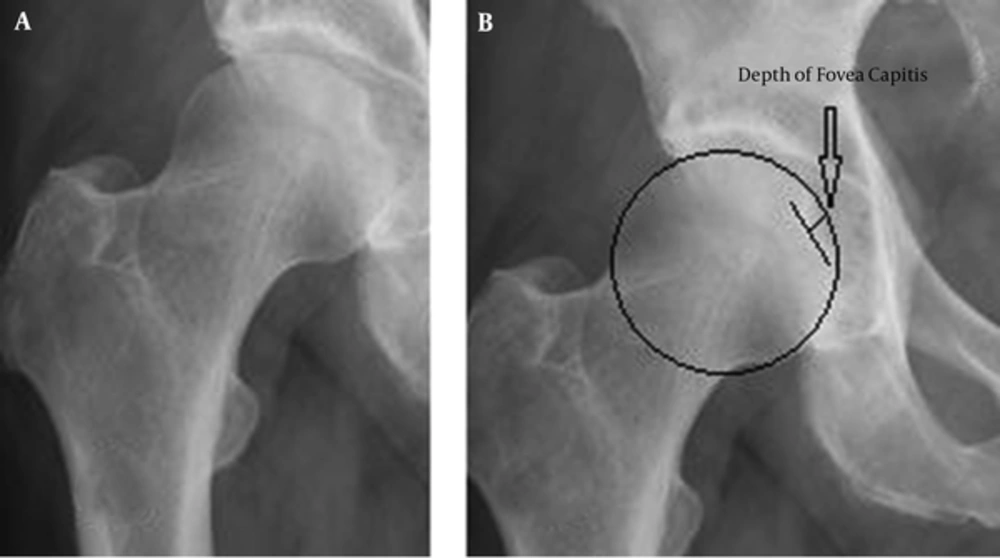
The depth of each fovea capitis was recorded. The depth was measured by completing the head circle and measuring the distance between the deepest point of fovea capitis and the apex of the curve of the head circle passing over fovea capitis (Figure 2). The majority of the depths of fovea capitis (95.75% of the measured fovea capitis depths or 1149 fovea depths), were between 2 - 4 mm. Fovea capitis with fovea capitis depths smaller than 2 mm were called fovea plana; whereas, fovea capitis with fovea capitis depths larger than 4 mm were called fovea profunda.
All pelvis views were obtained with the beam of the X-ray directed toward the midline above the symphysis pubis with both lower extremities in 15° of internal rotation. All radiographs were taken using the same standard radiographic positioning using the same radiographic machine (Philips medical systems, digital diagnost). All measurements were accomplished using the extreme XDS digital program (extreme PACS© company).
4. Results
In group 1 (20 - 39 years of age), the average value of the measured fovea capitis index in the female subgroup in the right hip was 24.58% ± 3.44%; whereas, it was 26.12% ± 4.81% in the left hip. No statistical significance was detected between the fovea capitis index (FCI) average values in the right and left hips. However, in the male subgroup, the average value of the measured FCI in the right hip was 25.29% ± 4.27% and 28.35% ± 5.34% for the left hip. A statistical significance was detected in the FCI between the right and left hips with a P value of 0.028 (Table 1). The general FCI average value in the female population was 25.35% ± 4.12%; whereas, it was 26.82% ± 4.81% in the male population. No statistical significance was detected between the two general average values of groups. The general average value of FCI of both sides in both genders was 26.08% ± 4.46% (Table 1).
| Parameters | Female | Male | Female General Value | Male General Value | General Value | ||
|---|---|---|---|---|---|---|---|
| right | left | right | left | ||||
| FCI %, age (20 - 39 ), y | |||||||
| Mean ± SD | 24.58± 3.44 | 26.12 ± 4.18 | 25.29 ± 4.27 | 28.35 ± 5.34 | 25.35 ± 4.12 | 26.82 ± 4.81 | 26.08 ± 4.46 |
| Min | 17.3 | 20.7 | 17.8 | 20.1 | 17.3 | 20.1 | 17.3 |
| Max | 28.5 | 31.2 | 32.6 | 34.3 | 31.2 | 34.3 | 34.3 |
| P Value | 0.69 | 0.028 | 0.08 | ||||
| FCI %, age (40 - 59 ), y | |||||||
| Mean ± SD | 25.73 ± 4.82 | 27.66 ± 5.37 | 25.08 ± 3.92 | 28.69 ± 5.63 | 26.69 ± 5.27 | 26.88 ± 4.77 | 26.78 ± 4.93 |
| Min | 20.4 | 22.5 | 18.3 | 23.6 | 20.4 | 18.3 | 20.4 |
| Max | 32.1 | 35.9 | 33.8 | 36.5 | 35.9 | 36.5 | 35.1 |
| P Value | 0.17 | 0.02 | 0.43 | ||||
| FCI %, age (60 - 80 ), y | |||||||
| Mean ± SD | 27.66 ± 4.67 | 29.71 ± 5.29 | 27.72 ± 4.16 | 30.65 ± 3.49 | 28.68 ± 4.98 | 29.16 ± 3.82 | 28.93 ± 4.40 |
| Min | 21.4 | 25.2 | 22.8 | 23.6 | 21.4 | 22.8 | 22.5 |
| Max | 34.7 | 38.6 | 36.2 | 36.3 | 38.6 | 36.3 | 37.4 |
| P Value | 0.25 | 0.041 | 0.27 | ||||
Abbreviation: FCI, fovea capitis index
In group 2, (40 - 59 years of age), the average value of the measured fovea capitis index in the female subgroup in the right hip was 25.73% ± 4.82%; whereas, it was 27.66% ± 5.37% in the left hip. No statistical significance was detected between the FCI average values in the right and left hips. However, in the male subgroup, the average FCI value in the right hip was 25.08% ± 3.92% and 28.35% ± 5.63% for the left hip. A statistical significance was detected in the FCI average values between the right and left hips with a P value of 0.02. The general average FCI value in the female population was 26.69% ± 5.27%, while it was 26.88% ± 4.77% in the male population. No statistical significance was detected between the two groups. The general average FCI value of both sides in both genders was 26.78% ± 4.93%.
In group 3 (60 - 80 years of age), the average measured fovea capitis index value in the female subgroup in the right hip was 27.66% ± 4.67%, while it was 29.71% ± 5.29% in the left hip. No statistical significance was detected between the FCI average values in the right and left hips. However, in the male subgroup, the average FCI value in the right hip was 27.72% ± 4.16% and 30.65% ± 3.49% for the left hip. A statistical significance was detected in the FCI average values between the right and left hips with a P value of 0.041. The general FCI average value in the female population was 28.68% ± 4.98%, while it is 29.16% ± 3.82% in the male population. No statistical significance was detected between the two groups. The general average value of both sides in both genders was 28.93% ± 4.40%.
Analyzing the 1200 hip joints revealed a different four configuration of fovea capitis. During this study, the values of 97% of the FCI values (1164 out of 1200 hip values) were between 18% and 35%. Whereas, the majority of fovea capitis depths (95.75% of the measured fovea depths or 1149 fovea depths) ranged between 2 mm and 4 mm.
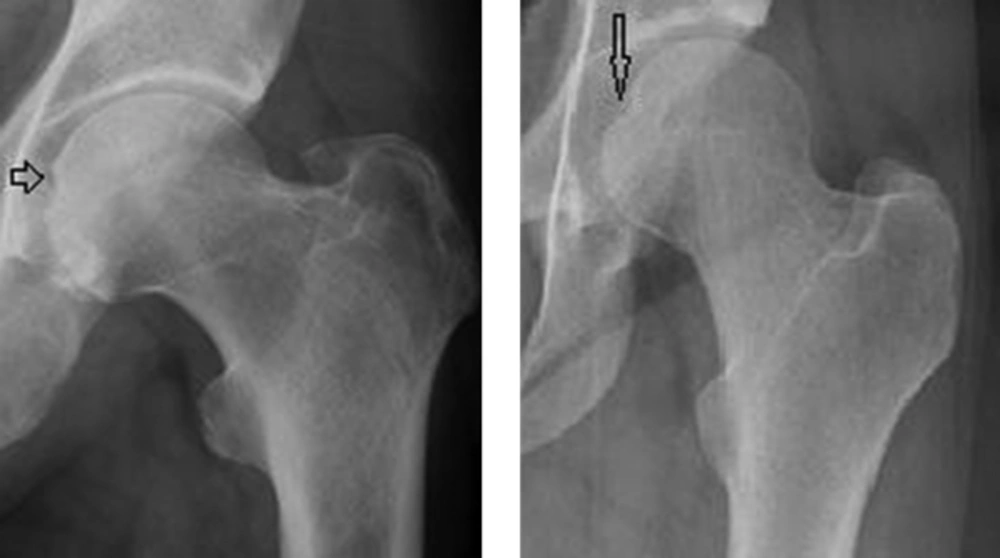
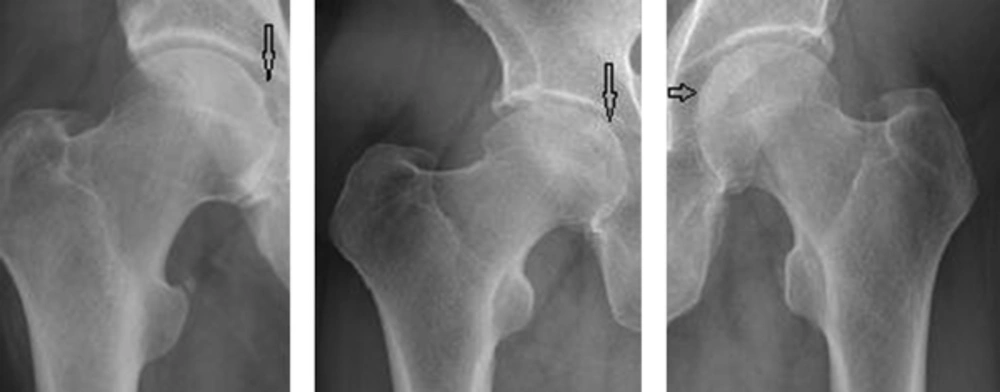
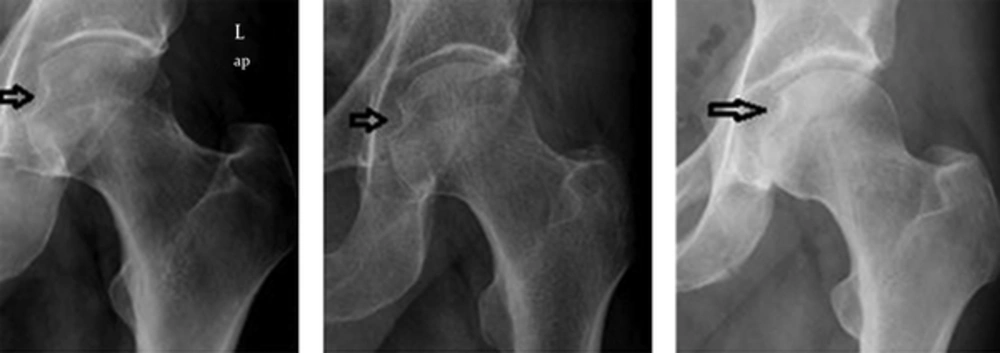
The small sized fovea capitis, with a FCI less than 18%, were called fovea brevis. They were discovered in six hips, composing 0.5% of all foveas (Figure 3). Whereas, 2.5% of the involved hips, 30 hips, had FCI values higher than 35%, and were called fovea magna (Figure 4).
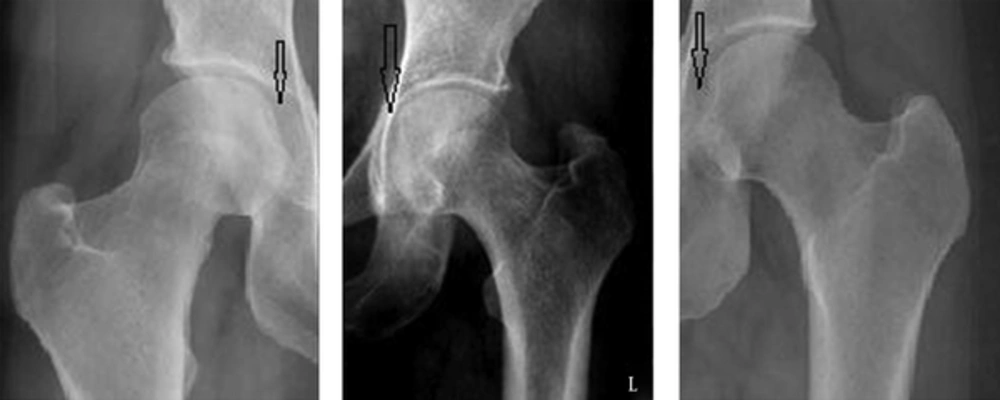
The shallow form of fovea capitis, where the depth is less than 2 mm, is called fovea plana. These were discovered in 38 patients, composing 3.2% of foveas (Figure 5).
The notched deepened form of fovea capitis, where the depth is more than 4 mm, is called fovea profunda, discovered in 13 hips, composing 2.1% of foveas (Figure 6).
5. Discussion
The head of the femur is covered by articular cartilage, except for a small ovoid depression situated slightly inferior and posterior to the center of the head called fovea capitis, it serves as a site of attachment of ligamentum teres (9, 10).
Some studies have focused on the high location of fovea capitis. Nötzli et al. (11) has suggested that the abnormal superior position of the fovea capitis (fovea alta) is a radiological marker of hip dysplasia. He has demonstrated that fovea alta, which can be assessed by measurement of the delta angle, may be a predisposing factor for early acetabular perifoveal articular cartilage damage and may lead to an early osteoarthritis by diminishing the contact area of the femoral head with the superior weight-bearing articular surface of the acetabulum.
Another MRI study conducted by Beltran et al. (14) investigated the association between high fovea capitis (fovea alta) and hip dysplasia in young adults. They found a significant association between fovea alta and hip dysplasia.
Tucker et al. (15) conducted an apprehensive anatomical study on forty-four femora obtained from fresh cadavers by injecting the vessels piercing the fovea capitis by barium sulphate. They examined all specimens by obtaining a femoral head X-ray after decalcification.
They concluded that the foveolar vessels that arise either from the obturator or medial femoral circumflex arteries, or both, are present in every ligament examined, but the size varied considerably. In children, they recognized that the vessels were small and varied from one to five in number. Sometimes they form a network in the fovea capitis similar to the fingers of an outstretched hand. However, in adults, he noticed that the size alteration was strikingly larger than that of the pediatric vessels by 80%. The foveolar vessels penetrated the osseous head through the fovea capitis, forming different anastomosis in more than 70% of specimens.
Fovea capitis contains the ligamentum teres (LT). Tan et al. (12) in his anatomical study concluded that LT has variable lengths and sometimes consists of multiple bundles. They also found that it is absent in 10% of individuals.
The exact function of LT is still not well understood. However, in a recent study performed by Martin et al. (13), they reported that LT is composed of a variant bundle number and it has a stabilizing role in internal and external rotations and tractions of the hip joint.
This study was conducted to assess the diameter changes of fovea capitis between both genders in different age groups. The design of the measurement, which was used in this study, is stemmed from our extensive clinical experience in hip surgery. It is strange not to find any anatomical or radiological well-designed studies in the literature focusing on the fovea capitis diameter changes in both genders with aging process.
The fovea capitis index (FCI) equation = (fovea capitis diameter (FCD) × 100) ÷ (femoral head diameter) is valid, since it is suggested to avoid errors related to minimal magnification variations between pelvis views.
Although there was no statistical significance between the 1st and 2nd groups, the 2nd group FCI average value was larger than that of the 1st group. The 3rd group demonstrated the highest FCI average value when compared to the 1st and 2nd group’s average values with a significant statistical difference, (P = 0. 016, and 0.032 respectively).
Statistical analysis of fovea capitis index of the femoral head revealed that the fovea capitis diameter increases with aging process. The process of fovea capitis enlargement with aging process can be explained by degeneration of the perifoveal thin cartilage rim around fovea capitis.
The average values of FCI of the left hip were obviously larger than the average values of the FCI of the right hip, with a statistical significant difference between the resulted values. This can be explained mostly by the smaller left femoral head diameter compared to the right ones as demonstrated before by many researchers (16-18).
Many pathologies may affect the femoral head which is the crucial part of the hip joint. The femoral head contains very few radiological landmarks, one of which is the fovea capitis. The clinical significance of such anatomical variation of fovea capitis configurations has not been researched before. However, some inquiries have been produced by this study worthy to be investigated.
Further clinical and radiological studies should be conducted to correlate the association of fovea capitis different configurations with some well-known anatomical features and pathologies of the femoral head including absent, short or hypertrophied ligamentum teres, ischemic or trauma-related avascular necrosis (AVN) and absent or active ligamentum teres blood supply.
However, we acknowledge the presence of some limitations in this study. X-ray views were used while computerized tomography (CT) can be more sensitive and accurate for measurements. However, CT is more expensive and exposes patients to more radiation than traditional X-ray. Despite the fact that this radiological study does not carry meaningful clinical results, it opens the field for investigations to further assess these anatomical variations and to reveal their impact on clinical practice.
In conclusion, fovea capitis size increases with aging process, it has four configurations, the clinical significance of such variant figures should be investigated clinically to detect their association with femoral head pathologies.
