1. Background
Nowadays, cone beam computed tomography (CBCT) has become of great interest in dental diagnostic imaging because it produces imaging with higher resolution compared to multi slice detector computed tomography (MDCT) with lower radiation dose (1, 2). CBCT provides accurate linear measurement of dentomaxillofacial structures (3, 4). However, CBCT like MDCT, is prone to producing artifacts by dental materials (5, 6). Artifacts caused by dental materials can degrade quality of CBCT image significantly and reduce their value as an important diagnostic tool. Several confounding factors influence the incidence of artifacts, including the conditions of exposure (KVP and mA), pixel size and size of the selected field of view (7). Many studies have assessed the artifacts produced by metals in the CBCT imaging system (8-10). Presently, various softwares have been introduced to reduce metal artifacts in CBCT imaging (11-13). However, this software has unwanted effects and may cause loss of effective signals for generating images, beside elimination of artifacts. Thus, if images could be obtained with lesser artifacts just by changing the exposure conditions, the quality of images would improve (14, 15).
Radiographic noise is a random change in image density. The lesser noise, the better the radiographic image as it improves the contrast resolution of images. Gray value of a homogeneous mass must be a number; any variation above or below that number, considered as a mean, is regarded as noise of system. Remarkable changes in pixel value are considered as high-pitched noise. In mathematical calculation, noise is called standard deviation therefore both are calculated with the same formula (16)

In which xi is each gray value;
x is mean gray value;
n is the number of mean gray values;
SD is standard deviation
α is noise
Signal, in a radiologic image is the x-rays that make up the image. Noise sources distort the image therefore, the ratio of these two means; signal difference to noise ratio (SDNR) is important for each imaging system. Each radiologist tries to reach higher SDNR by selecting the best imaging technique according to the laws of as low as reasonably achievable (ALARA) (16). Some studies have examined various artifacts found in CBCT and possible solutions to reducing them (17). One of these controllable conditions is the tube current. Some studies have assessed the effect of current on the accuracy of linear measurement (18), quality of images before the implant surgery (19), quality of CBCT sialography (20), and detection of occlusal caries (21) but no data were available on the impact of the tube current on the amount of artifacts caused by dental materials in these studies. Jadv et al. (2011) conducted a series of studies in search of a protocol for CBCT sialography. To achieve mA and KVP for generating images with the best quality and the lowest absorption dose, they used a mandibular corpse. The samples were scanned at eight different conditions including combination of four KVP and two tubes current. The election of a region of interest (ROI) in each block and comparison was done in adjacent areas without artifacts to assess SDNR sought at different exposure. To compare all the conditions, SDNR was used (20). Wang et al. (2011) reported that CBCT sensitivity decreases for the diagnosis of root fracture in the presence of root canal filling materials (22). Ibrahim et al. (2013) concluded that image artifacts significantly affect the visibility of trabecular structures and suggested further studies to investigate the effect of scanning conditions and image artifacts on visibility of microstructures of trabecules in CBCT images (23). Esmaili et al. (2013) compared the artifacts caused by the implant in two systems, CBCT and Multi-Slice CT (MSCT). The authors also proposed that more studies be done in the future to review the impact of exposure conditions (mA and KVP) on artifacts (6). The purpose of this study was to evaluate the impact of tube current on incident of artifacts caused by dental materials in CBCT images. In addition, the amount of diagnostic information loss due to artifacts can be assessed at different distances of dental materials and be used in clinical judgment.
2. Materials and Methods
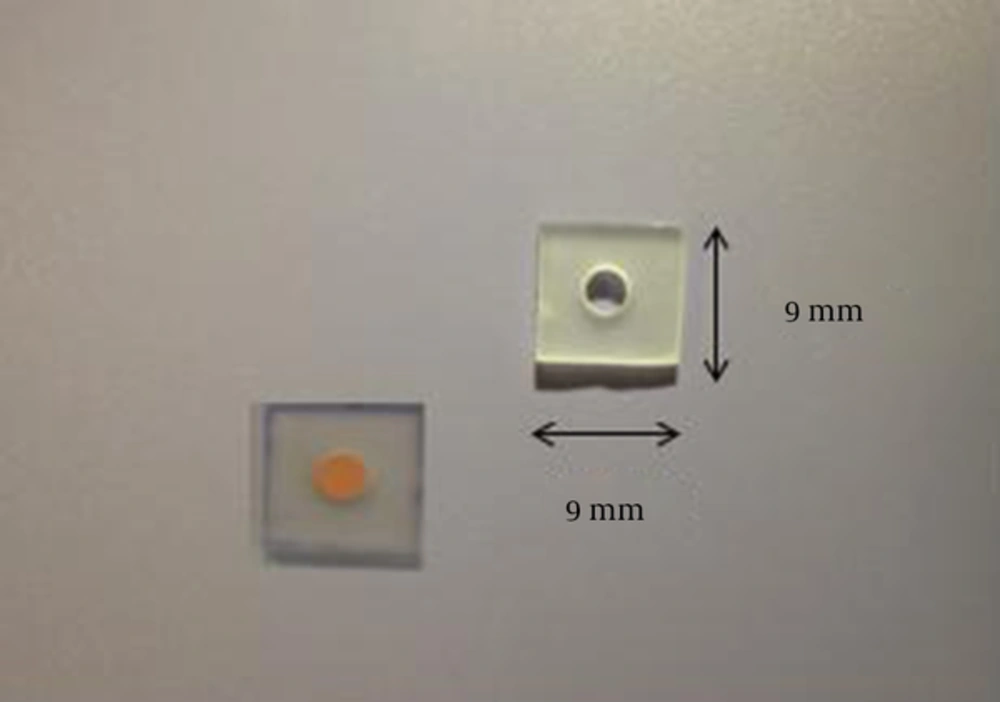
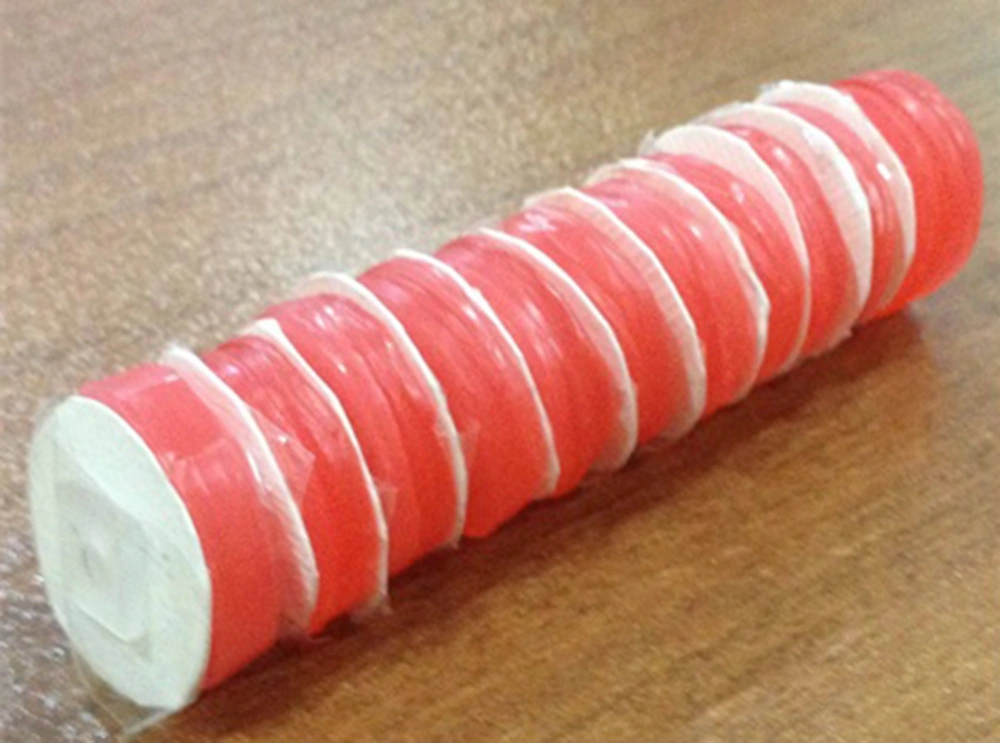
In this experimental (intervention) study, 20 of the most widely used dental materials were considered as an independent variable (Table 1). In this study, a total of 21 pieces of polyester made of polymethyl metacrylate (PMMA) in the form of a square with dimensions of 9 × 9 mm and 1.5 mm thickness were prepared. In the center of the plates, holes of 3 mm diameter and 1.5 mm thickness were prepared and then each of the holes was completely filled with the desired material (Figure 1). In order to stabilize these plates during scanning, each of the pieces was fixed on a sheet of cardboard. Control samples included a polyester plate without any dental material fixed on the same cardboard. The cardboard plates were then placed horizontally into a cylindrical vessel. Between each of the two samples, 3 millimeters of red wax was placed as a separator (Figure 2). This cylindrical vessel was fixed in a plastic container filled with water to simulate soft tissue. Plastic containers full of water were placed on the Chin Rest, so that the samples were in the center of the field of view (FOV).
| Number | Material |
|---|---|
| 1 | Control sample |
| 2 | Composite (point4, kerr, Orange, CA; Esthet-x, Densply / Caulk, Milford, USA) |
| 3 | Composite (z100,3M ESPE, Seefeld, Germany) |
| 4 | ZOE paste (Zonalin, Kemdent, Purton, Swindon, Wiltshire, UK) |
| 5 | Glass Inomer Fuji ΙΙ (LC, GC, international Corp, Tokio, Japan) |
| 6 | Root canal sealer (AH26, Dentsply De Trey GmbH, Konstanz, Germany) |
| 7 | Root canal filling guttapercha (Ariadent, Tehran, Iran) |
| 8 | Temporary cement (CavitTempband, Kerr, Orange, CA, USA) |
| 9 | Calcium hydroxide (Dycal, Dentsply Caulk, Milford, DE, USA) |
| 10 | MTA (Dentsply, Tulsa Dental, Tulsa, OK, USA) |
| 11 | Zinc phosphate cement (Harvard, Richter & Halffmann, Berlin, Germany) |
| 12 | Polycarboxylate cement (Harvard dental international, GmbH, Germany) |
| 13 | Opaque porcelain (Noritake Porcelain, Nortikate Dental Supply Co, Ltd, Japan) |
| 14 | Enamel or dentin porcelain (Vitadur Alpha, VITA Zahnfabrik, Germany) |
| 15 | Calcium-enriched mixture (CEM) cement (Tehran, Iran) |
| 16 | Root canal guttapercha (Gapadent, JIAFA Co, Ltd, South Korea) |
| 17 | Glass inomerchemfil superior (dentsply De Trey, Konstanz, Germany) |
| 18 | Cavit (Coltosol, Ariadent, Tehran, Iran) |
| 19 | Supreme Cast V (TalladiumInc, Valencia, CA, USA) |
| 20 | Neocast V (Dental Ceramic Alloy, Nickel-chromium, USA) |
| 21 | Amalgam (SDI, Victoria, Australia) |
Scans were performed by CBCT, Soredex SCANORA 3D. Samples were scanned at two different tube current of 5 and 10 mA while all other conditions remained constant (cylindrical field of view with dimensions of 13 m height and 14.5 mm diameter, 250 microns voxel size and 90 KVP). The position of material between the two imaging scans remained unchanged.
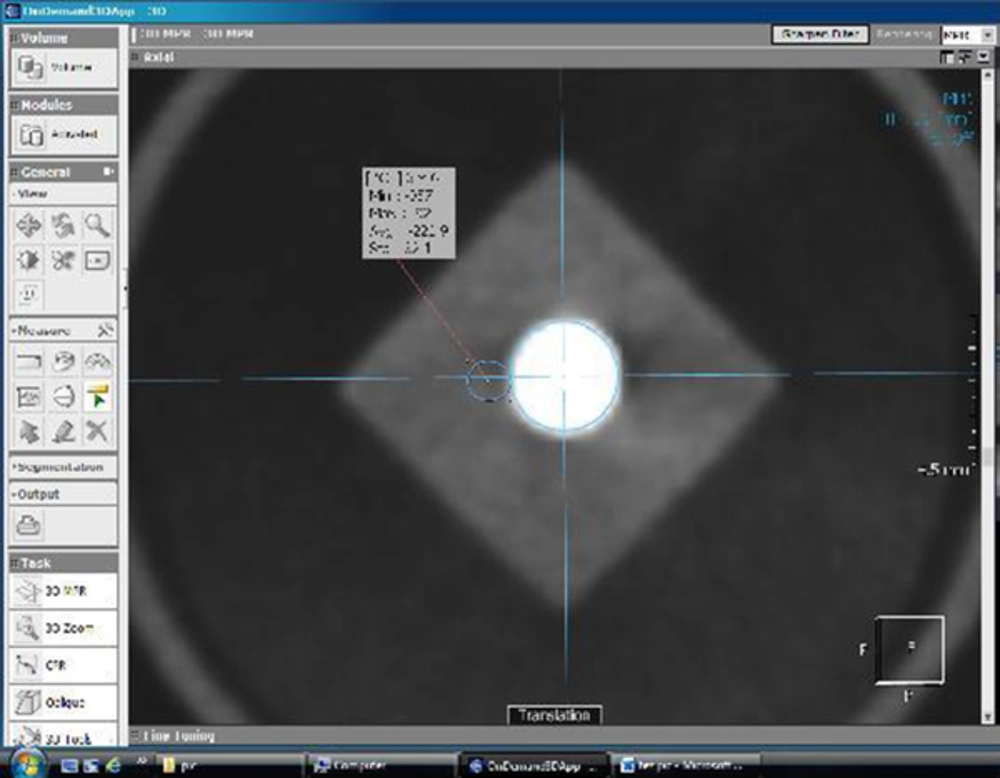
On the obtained images, circles with a diameter of 1 mm and thickness of 1.5 mm were selected on the thickness of the dental material scanned as a ROI at distances of 1, 2, and 4 mm at the edge of the dental material image tested in three regions and four directions with the OnDemand 3D application software. The image of the object was considered at the center of an imaginary circle with a diameter of 3 mm (equivalent to the actual diameter of the material) and two perpendicular lines were drawn from this point. ROI 1 was considered tangent to this circle, ROI 2 tangent to ROI 1, and ROI 3 a circle data distance of 1 mm from ROI 2. Evaluation was performed on axial images. Mean gray value was calculated for each relevant area (Figure 3).
For each area, mean gray value number corresponding to the control sample was calibrated (being subtracted from each other); then the obtained number was divided by the standard deviation of the corresponding control samples. Signal Difference to Noise Ratio (SDNR) was obtained for each ROI in each of the scanning conditions.

Using the SPSS software VS.18.0, quantitative variables were described as the mean values of the variables in terms of distribution (SDNR). To examine any statistically significant difference at various distances, One-Sample Kolomogorov-Smirnov test, and analysis of non-parametric Wilcoxon were used because of the abnormality of data distribution. The study was performed on samples of dental materials in vitro without any moral issue.
3. Results
SDNR for any distance regardless of direction and the type of material in 5 mA scan at a distance of 1, 2 and 4 mm were +3.6797, -1.2901, and -2.8608, respectively. SDNR of 10 mA scan at a distance of 1, 2 and 4 mm were +3.2363, -1.1889, and -1.1844, respectively (Table 2). SDNR comparison between different situations at 1 and 2 mm distance showed no significant difference (P values of 0.053, and 0.312 respectively). SDNR at a distance of 4 mm changed significantly by changing the scanning conditions from 5 to 10 mA (P value = 0.000) (Table 3). SDNR for all data, regardless of type of material, direction and distance was -0.1570 in 5 mA scan and 0.2877 in 10 mA scan. Generally SDNR changed significantly by changing the scanning conditions from 5 to 10 mA (P Value = 0.026).
| Distance | Mean | Std. Error Mean | |
|---|---|---|---|
| 1 mm | SDNR5 | 3.6797 | 1.09548 |
| SDNR10 | 3.2363 | 1.09902 | |
| 2 mm | SDNR5 | -1.2901 | 0.64478 |
| SDNR10 | -1.1889 | 0.63531 | |
| 4 mm | SDNR5 | -2.8608 | 0.51693 |
| SDNR10 | -1.1844 | 0.49525 | |
Abbreviation: SDNR, signal difference to noise ratio.
| Distance | SDNR10 - SDNR5 |
|---|---|
| 1 mm | Z = -1.933 |
| P = 0.053 | |
| 2 mm | Z = -1.011 |
| P = 0.312 | |
| 4 mm | Z = -4.866 |
| P = 0.000 |
Abbreviation: SDNR, signal difference to noise ratio.
4. Discussion
SDNR indicator was established within each of the three selected distances. Although no significant differences were seen at 1 and 2 mm distances, a significant increase was obtained at 4 mm distance by changing the scanning condition from 5 to 10 mA. This means that by increasing the scanning current from 5 to 10 mA, the image quality improved quantitatively at 4 mm distance. Incomparability of the image quality at 1 mm distance can be assigned to numerous artifacts at small distance of materials. There are as many confounding factors that the reduction of noise due to increasing tube current cannot improve the image quality. The other factor is the presence of some metallic material between the studied samples that produces distorted images and create cupping artifact. This distortion causes entry of some part of the image into adjacent ROI 1 and distorts the comparison.
At 2 mm distance, no significant differences were seen in comparison to this index. Incomparability of quality at this distance may be due to insufficiency in changes in the tube current and probably requires a greater change in the current by more than 5 units. Also changing mA in other ranges, for example from 10 to 15 may improve image quality at this distance.
Increase in SDNR at the 4 mm distance indicates an improvement in image quality at this distance and reduction in the effective factors of artifacts due to different dental materials, following an increase in tube current.
Other notably achieved result analyzing all 240 data was that different scanning conditions could make a significant difference on acquired SDNR. By increasing the current from 5 to 10 mA, SDNR increased significantly. This finding shows the improvement in image quality in the presence of different materials and the subsequent artifacts by changing the scanning condition. Therefore, in the present study, the hypothesis that changing the amount of different material artifacts can be changed by different tube current is confirmed. In particular, the increase in the tube current caused an upsurge in SDNR that indicates higher quality of images. This increase in quality can be the result of the reduction in artifacts made by different dental materials.
Ritter et al. (2009) examined the factors that affected the quality of CBCT images and concluded that artifacts caused by dental restoration reduce image quality (15). Their study was based on the visual judgment of 4 clinicians. Change in exposure factor and comparison of the quality of different scenarios was not performed in this study. Jaideep et al. (2010) assessed the influence of current on the quality of CBCT images before an implant surgery. According to this study, the quality of the images was affected by the current. The interesting point is that in the range of low currents, such as a change from 4 to 2 mA, this reduction had a greater impact on decreasing quality and had no effect at higher intensities, such as a change from 8 to 4 mA. The quality of images with a current of 1 mA had always been poor (19). We also propose that one of the reasons that the change in current had no effect at 2 mm distance, was the selected range which was from 5 to 10 mA. Probably, a 10 to 15 mA change in current ranges might be effective on image quality. In a study by Jadv et al. (2011), change in tube current from low to high caused SDNR upsurge, but this increase was not significant at 80 and 100 KVP but significant at 60 and 120 KVP (20). In thus study, which was conducted at a fixed kilovoltage of 90 KVP, SDNR increased by changing the current from 5 to 10 mA. Panmekiate and colleagues (2012) concluded that tube current change had no effect on accuracy of linear measurement of CBCT and due to lower radiation dose, they recommended the use of low current (18). However, these researchers did not mention the effect of tube current change on the amount of artifact or image quality as their study was based on assessing the accuracy of linear measurement rather than image quality.
Due to limitations to measure the artifacts in 360 degree, it was measured in four axis and three distances in each. Additionally, for more accuracy instead of point, the ROI and mean gray value were used.
In conclusion, according to increased SDNR index at 4 mm distance of the image, the amount of material artifacts decreased by increasing tube current. Increase in SDNR, generally and regardless of the type of material, distance and direction results in a decrease in artifacts and increase in image quality of CBCT following tube current increase.


