1. Background
Adenocarcinomas of the lung consist of preinvasive lesions [atypical adenomatous hyperplasia (AAH) and adenocarcinoma in situ (AIS)], minimally invasive adenocarcinoma (MIA) and invasive adenocarcinomas (IAC), according to the most recently published classification system of lung adenocarcinoma by American thoracic society, European Respiratory society and international association for the study of lung cancer (1).
Ground-glass nodule (GGN) is a common computed tomography (CT) finding. It cannot be seen on mediastinal windows, but appears as slight focal opacities on lung windows. It could be present on a variety of diseases, such as AAH, AIS, MIA, IAC, focal fibrosis and organizing pneumonia. AIS is defined as a localized adenocarcinoma 3 cm or smaller that exhibits a lepidic growth pattern of neoplastic cells along alveolar structures without stromal, vascular, or pleural invasion. AAH and AIS typically present as a persistent pure or part-solid GGN with small solid parts on CT imaging (2, 3). It is well known that GGN containing a solid portion (part-solid GGNs) is more likely to be a malignant lesion, compared to pure GGN or solid nodules (4, 5). Many studies (6-8) have also investigated the characteristics of the solid components of mixed GGNs.
It is recommended that part-solid GGNs, especially those with a solid component that is larger than 5 mm, should be considered malignant until proven otherwise (4). On the other hand, over a third of part-solid GGNs are preinvasive lesions, i.e. AIS or AAHs, and can be managed with follow-up alone or limited surgical resection (9-11). Therefore, it is important to accurately differentiate these preinvasive lesions that appear as part-solid GGNs from more advanced ones such as MIA and IAC. However, it is sometimes hard to differentiate the three groups through morphological characteristics on CT imaging because of the considerable overlaps in features among AAH, AIS, and IAC (12-14). No large-scale study has determined the imaging and morphological features that differentiate between AAH, AIS and MIA lesions that appear as part-solid GGNs.
2. Objectives
In this study, we aim to retrospectively review the preoperative CT imaging of 230 patients with part-solid GGNs with their histopathological results and investigate the value of CT features in differentiating preinvasive, minimally-invasive and invasive adenocarcinomas of the lung.
3. Patients and Methods
3.1. Patients and Nodule Selection
Chest CT results of consecutive patients with part-solid GGNs who had pathological diagnoses between January and December 2015 were retrospectively reviewed. The nodules included met the following criteria: (a) unenhanced GGNs with a solid portion detected on chest CT and (b) available pathological results for the lesions. Part-solid GGN is defined as a slight focal dense lesion with homogeneous attenuation on the lung window, with a solid portion within the lesion on the mediastinal window. All patients underwent confirmative chest CT scan because lung nodules were detected on their low-dose CT scans. The institutional review board in our unit approved this retrospective study with a waiver of informed consent.
3.2. CT Scanning
CT scans were performed without contrast material by two CT scanners (Sensation 64, Siemens or Brilliance 40, Philips) with the following parameters: section thickness of 1 or 2 mm, tube current of 150 - 200 mA and tube voltage of 120 kVp. The lung window width was 1,500 Hounsfield units (HU) with the level of -700 HU. The mediastinal window width was 400 HU with the level of 20 HU. In all patients, CT images were obtained in the supine position at full inspiration. For more than one available CT result, we selected the most up-to-date CT images for morphologic analysis.
3.3. CT Image Analysis
The chest CT results were independently reviewed by two experienced radiologists who were blinded to the pathological results. Discrepancies were solved through discussion until a consensus was reached. Demographic and imaginary characteristics of the patients, including age, gender, size of the GGN and the maximum diameter of its solid part, the CT values of GGNs, as well as morphological characteristics (including margins, border and internal characteristics, e.g. lobulation, spiculation, bubble-lucency, vascular convergence, air bronchograms, pleural retraction, calcification, and cavitation) were documented. The two radiologists who were blinded to patient data and pathologic diagnosis independently measured the maximum diameter on the transverse lung window image, with the CT parameters of each nodule measured at the same layer. Discrepancies were solved by consensus after discussion. Morphological characteristics are defined as follows: The border between the GGN lesion and the adjacent normal tissue is classified as ill defined or well defined with smooth or rough margins (15). Spiculation is defined as linear strands extending out of the lesion that appear on unenhanced CT. An air bronchogram is defined as bubble-like lucency (size of 1 - 2 mm) within or running through the lesion or a lucency along a regular bronchial wall running through the lesion. Vascular convergence and pleural retraction refer to changes in the adjacent structures.
3.4. Statistical Analysis
Statistical analyses were performed using the IBM SPSS Statistics for Windows, version 21.0 (IBM Corp., Armonk, N.Y., USA). Distribution normality of all the interval data were checked with the Shapiro-Wilk test. Baseline characteristics and CT results among AIS, MIA and IAC groups were compared by using one-way analysis of variance (ANOVA) if they were normally distributed, in which differences between each two variables were compared with the Dunnett t test. Morphological characteristics on CT images, such as lobulation, spiculation, vascular convergence, bubble-lucency, air bronchograms, pleural retraction, calcification and cavitation) were compared using Pearson χ2 test Fisher exact test. P values < 0.05 indicate statistically significant differences. Receiver operating characteristic (ROC) curves were plotted for the maximum diameter of the solid part and CT values of the whole lesion, the GGN part and the solid part to confirm the optimal cut-off that differentiated the three groups.
4. Results
4.1. General Characteristics of the Lesion
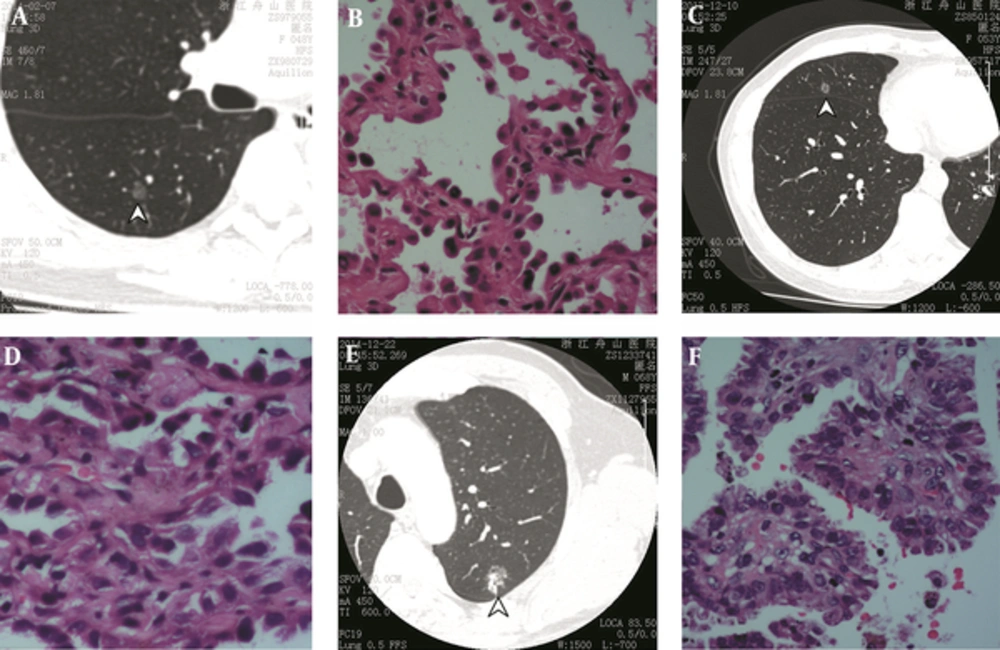
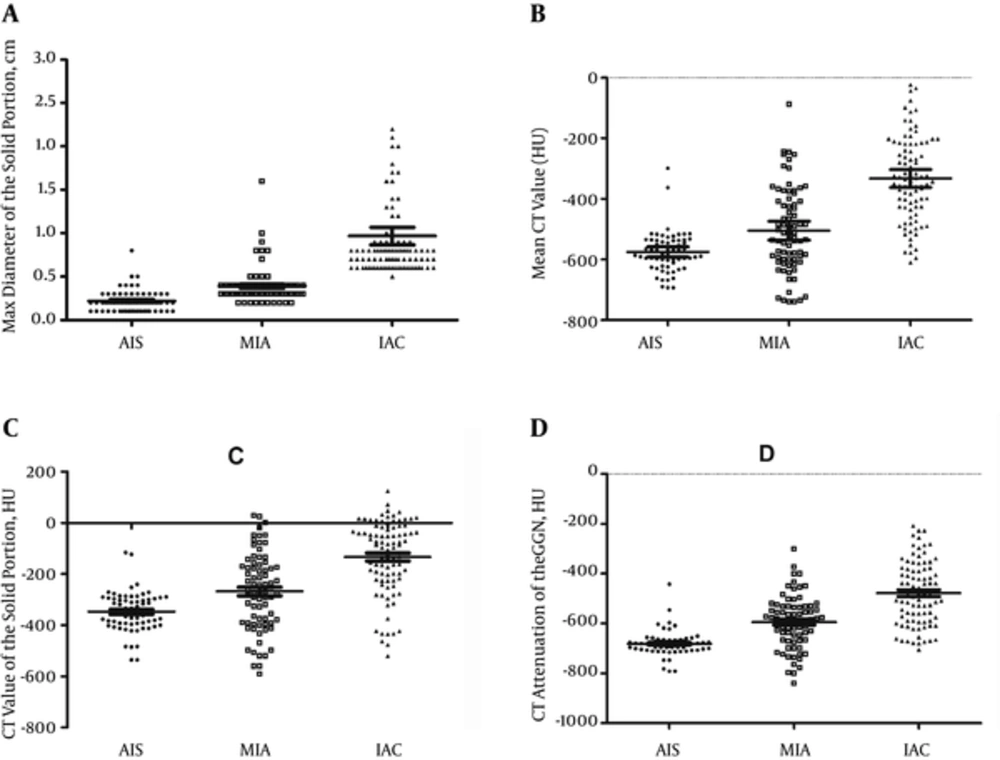
In total, we selected 230 patients with solitary part-solid GGN lesions based on the inclusion criteria. There were 134 female patients and 96 male patients with a mean age of 58.3 years (ranging between 33 and 86 years). The GGNs lesions consisted of 64 AISs, 77 MIAs, and 89 IACs. Typical CT images and histologic results of the included patients from the three groups are shown in Figure 1. The distributions of parameters of interest among the three groups are illustrated in Figure 2. The mean diameters of the GGN were 10.3, 12.1 and 16.4 mm, respectively in the AIS, MIA and IAC groups, which were significantly different among the three groups (P < 0.001). There were significant differences between each two groups as well (all Ps < 0.05). The diameters of lesions with different pathologic diagnoses increased as the potential towards invasive lesion became higher. The imaging characteristics of the lesions are listed in Table 1. The majority of lesions in all three groups had smooth margins and well-defined borders. Other features, such as lobulation, spiculation, bubble-lucency, air-bronchogram, pleural retraction and vessel convergence, were compared among all groups (Table 2). The presence of lobulation significantly differed between the MIA and IAC groups (P < 0.001) and between the AIS and IAC groups (P = 0.043), but not between the AIS and MIA groups. Spiculation was more frequently seen in MIA group compared with the preinvasive group (P = 0.013) and in the IAC group compared with the preinvasive group (P = 0.002). No significant difference was found between the MIA and IAC groups. Bubble-lucency was more likely to present in IAC group compared with MIA group (P = 0.007). Air-bronchogram was also more frequently seen in IAC group, compared with AIS group (P = 0.001) and MIA group (P = 0.020). The results indicated that a lesion with features like lobulation, spiculation, bubble-lucency and air-bronchogram was more likely to be malignant and invasive (MIA) than those without those features.
| Characteristics | AIS | MIA | IAC | P value |
|---|---|---|---|---|
| Total number (n) | 64 | 77 | 89 | - |
| Gender (n) | ||||
| Male | 28 | 29 | 39 | 0.42 |
| Female | 36 | 48 | 50 | |
| Age (Mean ± SD) | 59.7 ± 10.3 | 57.0 ± 10.2 | 57.5 ± 11.0 | 0.30 |
| Lesion Location (n) | ||||
| LU | 24 | 16 | 18 | 0.51 |
| LL | 12 | 22 | 22 | |
| RU | 8 | 20 | 27 | |
| RM | 8 | 8 | 12 | |
| RL | 12 | 11 | 10 | |
| Lesion diameter (Mean ± SD, cm) | 1.03 ± 0.31 | 1.21 ± 0.51 | 1.64 ± 0.58 | < 0.001 |
| Max diameter of the solid portion (cm) | 0.22 ± 0.13 | 0.39 ± 0.21 | 0.97 ± 0.94 | < 0.001 |
| Mean CT attenuation (HU) | -575.44 ± 116.47 | -505.03 ± 137.83 | -332.90 ± 138.93 | < 0.001 |
| CT attenuation of the solid portion (HU) | -347.58 ± 117.65 | -268.39 ± 149.80 | -133.94 ± 145.34 | < 0.001 |
| CT attenuation of the GGN (HU) | -680.76 ± 96.78 | -594.18 ± 104.44 | -478.37 ± 125.70 | < 0.001 |
Abbreviations: AIS, Adenocarcinoma in situ; GGN, ground-glass nodule; HU, Hounsfield unit; IAC, Invasive Adenocarcinoma; LL, Left Lower Lobe; LU, Left Upper Lobe; MIA, Minimally Invasive Adenocarcinoma; RL, Right Lower Lobe; RM, Right Middle Lobe; RU, Right Upper Lobe; SD, Standard Deviation.
| Imaging Features | AIS | MIA | IAC |
|---|---|---|---|
| Margin | |||
| Smooth | 40 (62.5) | 69 (89.6) | 72 (80.9) |
| Rough | 24 (37.5) | 8 (10.4) | 17 (19.1) |
| Border | |||
| Well-defined | 44 (68.8) | 65 (84.4) | 63 (70.8) |
| Ill-defined | 20 (31.2) | 12 (15.6) | 26 (29.2) |
| Internal characteristics | |||
| Lobulation | 32 (50.0) | 28 (36.4) | 59 (66.3) |
| Spiculation | 0 | 7 (9.1) | 12 (13.5) |
| Air-bronchogram | 8 (12.5) | 12 (15.6) | 32 (36.0) |
| Pleural retraction | 0 | 3 (3.9) | 32 (36.0) |
| Vessel convergence | 0 | 3 (3.9) | 13 (14.6) |
| Calcification | 0 | 0 | 1 (1.1) |
| Cavitation | 0 | 0 | 0 |
Abbreviations: AIS, Adenocarcinoma in situ; IAC, Invasive adenocarcinoma; MIA, Minimally invasive adenocarcinoma.
aValues are expressed as No. (%).
CT image and pathological results of typical adenocarcinoma in situ (AIS), minimally invasive adenocarcinoma (MIA) and invasive adenocarcinoma (IAC) lesions in three patients. A, CT image shows an AIS lesion appearing as a part-solid ground-glass nodule (GGN) (arrowhead) in a 48-year-old female. B, Hematoxylin-eosin staining showing lepidic growth pattern along with the intact alveolar structures without signs of invasion (original magnification × 20). C, CT image shows an MIA lesion appearing as a part-solid GGN (arrowhead) in a 53-year-old female patient. D, Hematoxylin-eosin staining showing predominant lepidic growth with minimum (less than 5 mm) stromal invasion (original magnification × 20). E, CT image showing an IAC lesion appearing as a part-solid GGN (arrowhead) in a 68-year-old male patient. F, Hematoxylin-eosin staining showing non-mucinous lesions with significant (> 5mm) invasion (original magnification × 20).
Scattergrams of distributions of the maximum diameters of the solid part (A), mean CT value (B), CT value of the solid part (C), and CT value of the ground-glass part (D) among the adenocarcinoma in situ (AIS), minimally invasive adenocarcinoma (MIA) and invasive adenocarcinomas (IAC) groups. Bars indicate mean and 95% confidence interval.
4.2. Maximum Diameter of the Solid Portion
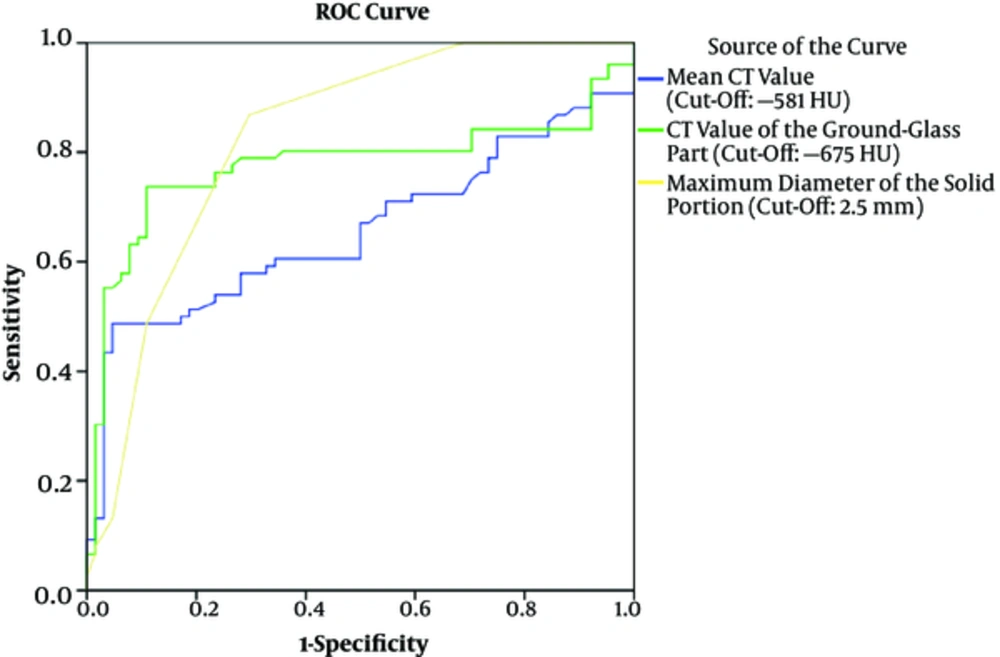
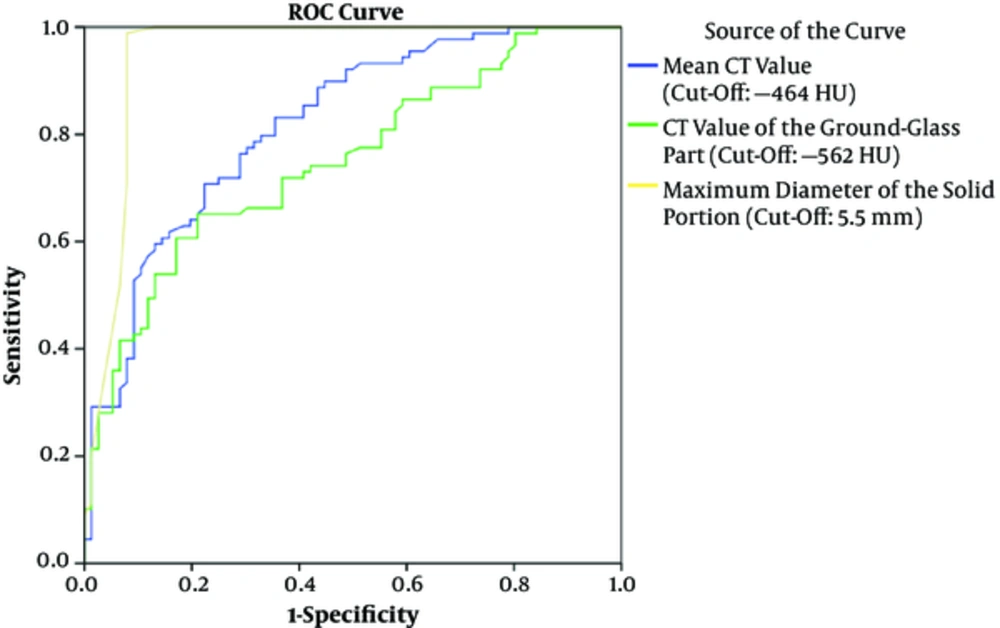
The maximum diameters of the solid portion were significantly different among the AIS, MIA and IAC groups (P < 0.001). There were significant differences between each two groups (all Ps < 0.05). The diameters of the solid portion with different pathologic diagnoses increased as the potential towards invasive lesion became higher. This indicates that the chance of a GGN lesion to be a preinvasive or invasive gradually increases with the increasing size of the solid portion. ROC curves for diameters of the solid part were plotted between the AIS and the MIA groups (Figure 3), and between the MIA and IAC groups (Figure 4). The optimal cut-off value of maximum solid portion diameter for distinguishing between AIS and MIA was 2.5 mm [area under the curve (AUC) 0.828; 95% confidence interval (CI) 0.757 - 0.899] with sensitivity and specificity of 86.8% and 70.3%, respectively. Meanwhile, the optimal cut-off value of maximum solid portion diameter for distinguishing between MIA and IAC was 5.5 mm (AUC 0.949; 95% CI 0.908 - 0.990) with sensitivity and specificity of 98.9% and 92.1%, respectively. Thus, GGN nodules with a solid portion <2.5 mm were likely to be preinvasive lesions, while nodules with a solid portion ≥ 5.5 mm could be invasive lesions. GGNs with a solid part with a diameter between 2.5 and 5.5 mm were likely to be minimally invasive.
Receiver operating characteristic (ROC) curves for mean CT value, CT value of the ground-glass part and maximum diameters of the solid part between the adenocarcinoma in situ (AIS) and the minimally invasive adenocarcinoma (MIA) groups. Area under the curve (AUC) for maximum solid portion diameter: 0.828 (95% CI 0.757, 0.899); AUC for mean CT value: 0.657 (95% CI 0.565, 0.749); AUC for CT value of the ground glass part: 0.776 (95% CI 0.692, 0.861).
4.3. Mean CT Value
The mean CT values of the GGN were significantly different among the AIS, MIA and IAC groups (P < 0.001). There were significant differences between each two groups (all Ps < 0.05). ROC curves were plotted between the AIS and the MIA groups (Figure 3) and between the MIA and the IAC groups. The optimal cut-off mean CT value for distinguishing between AIS and MIA was -581 HU (sensitivity, 67.1%; specificity, 50%; AUC, 0.657, 95% CI 0.565 - 0.749). The optimal cut-off mean CT value for distinguishing between MIA and IAC groups was -464 HU (sensitivity, 79.8%; specificity, 67.1%; AUC, 0.818, 95% CI 0.754 - 0.882). The results suggest that GGN nodules with mean CT value less than -581 HU were likely to be preinvasive lesions, while nodules with a mean CT value greater than -464 HU could be invasive lesions. GGNs with mean CT value between -581 and -464 HU were likely to be minimally invasive.
4.4. CT Value of the Ground Glass Part
The CT values of the ground glass part of the lesion were all significantly different among the AIS, MIA and IAC groups (all Ps < 0.001). There were significant differences between each two groups (all Ps < 0.05). ROC curves were plotted between the AIS and the MIA groups (Figure 3) and between the MIA and the IAC groups. The optimal cut-off CT value of the ground glass part for distinguishing between AIS and MIA was -675 HU (sensitivity, 80.3%; specificity, 64.1%; AUC, 0.776, 95% CI 0.692 - 0.861). The optimal cut-off CT value of the ground glass part for distinguishing between MIA and IAC groups was -562 HU (sensitivity, 71.9%; specificity, 61.2%; AUC, 0.750, 95% CI 0.676 - 0.823). The results suggest that GGN nodules with mean CT value less than -675 HU were likely to be preinvasive lesions, while nodules with a mean CT value greater than -562 HU could be invasive lesions. GGNs with mean CT value between -675 and -562 HU were likely to be minimally invasive.
Receiver operating characteristic (ROC) curves for mean CT value, CT value of the ground-glass part and maximum diameters of the solid part between the minimally invasive adenocarcinoma (MIA) and the invasive adenocarcinomas (IAC) groups. Area under the curve (AUC) for maximum solid portion diameter: 0.949 (95% CI 0.908, 0.990); AUC for mean CT value: 0.818 (95% CI 0.754, 0.882); AUC for CT value of the ground glass part: 0.750 (95% CI 0.676, 0.823).
5. Discussion
In the present study, we find that part-solid GGN with a maximum solid part diameter ≥ 2.5 mm, a mean CT value ≥ -581 HU and a CT value of the ground glass part ≥ -675 HU are helpful markers to indicate an MIA from AIS. Meanwhile, those with a maximum solid part diameter ≥ 5.5 mm, a mean CT value ≥ -464 HU and a CT value of the ground glass part ≥ -562 HU are helpful markers to indicate IAC from MIA; air bronchograms differentiated MIA from AIS; and a mean CT value less than -520 HU differentiated AIS from MIA. Moreover, we also find that a GGN with certain imaging features, such as lobulation, spiculation, bubble-lucency and air-bronchogram, is more likely to be malignant and invasive (MIA) than those without those features.
The evaluation of GGNs, particularly the assessment and differentiation of part-solid GGNs by using imaging and morphologic features, is sometimes very challenging because of substantial overlaps among the characteristics of AIS, MIA and invasive pulmonary adenocarcinoma (IPA). Some investigators (16) have found that peak CT attenuation value is useful in differentiating AIS from bronchioloalveolar carcinomas by using two-dimensional section images and histogram analysis of CT pixel numbers. They suggested that a GGN diameter of ≤ 10 mm and a peak CT attenuation value of less than -650 HU are likely to be bronchioloalveolar carcinomas rather than AIS, which is consistent to our finding that CT value of the ground glass part ≥ -675 HU are likely to be MIA rather than AIS. But our finding may help to detect earlier malignancies since we isolated MIA as an intermediate stage between pre-invasive and invasive lesions. Others have reported that mean CT number is an optimal imaging marker for differentiating between AIS and bronchioloalveolar carcinoma (BAC) with an optimal cutoff value of -584 Hounsfield units (HU) (17).
Many previous studies have reported that greater extent of the solid component in part-solid GGNs may indicate a higher likelihood of being invasive adenocarcinomas and poorer prognosis (4, 16, 18). Our study has found a maximum diameter of the solid part over 5.5 mm to be an indicator for invasive carcinomas. The cut-off value of 5.5 mm shows good pathologic-radiologic correlation, as pathologists have the consent that 5 mm is a reasonable criterion for differentiating microinvasive from invasive nodules (19). AISs are typically smaller in size and have weaker internal attenuation or a smaller solid component within GGNs compared with IACs, which can be interpreted as preinvasive lesions having a smaller tumor burden than IACs. Actually, it has been reported that preinvasive lesions are able to be distinguished from IPAs with smaller lesion size and smaller solid proportion (20). We also found that GGNs with a solid portion diameter less than 2.5 mm are more likely to be AISs. This adds to the previous findings that smaller solid portions are likely to be preinvasive lesions by providing an optimal cut-off value (20).
In the present study, we also investigated the morphological features of GGNs on CT imaging, such as lobulation, spiculation, bubble-lucency, air-bronchogram, pleural retraction and vessel convergence. Lobulation is more likely to occur in IAC lesions (66.3%), compared with MIA (36.4%) and AIS (50%) lesions. Similarly, spiculation is also more commonly seen in MIA (9.1%) and IAC (13.5%) lesions, compared with AIS (0%). These findings are consistent with previous studies showing that lobulation, spiculation and pleural tag are more prevalent in more advanced lung cancers (21). Air bronchogram on thin-section CT is thought to be a characteristic feature of solid adenocarcinoma of the lung. We found that air bronchograms were likely to be seen in IAC lesions (14.6%), compared with AIS group (3.9%) and MIA group (0%), which supports the previous finding that air bronchograms are present in most malignant tumors (22). Air bronchograms may reflect tumor cell invasion in the bronchial or bronchiolar, which leads to the changes of other tissues such as the cartilage and elastic layer, causing tortuosity of the airway and ectasis (23, 24).
Our study has several limitations. First, the retrospective design and single-center site may have hindered our ability to identify more optimal factors to differentiate preinvasive lesions to invasive lung adenocarcinomas. Second, we only investigated AIS as a representation of preinvasive lesion and did not include patients with AAH, mainly due to the fact that the structure of the two lesions were very similar. The thickened alveolar septa in AAH may sometimes resemble the less thick alveolar septa in AIS. Thus, only trivial difference would exist in the mean CT values of the two lesions (17). Second, the mean CT values in this study were measured using two different CT scanners and represents the average attenuation, instead of the density of the nodule as a whole, which may hamper the accuracy of the CT parameters. Meanwhile, we did not calculate the inter-observer reliability between the two radiologists who analyzed the CT features of patients. In case discrepancy occurred, only one data was included in the final analysis after consensus was reached.
In conclusion, part-solid GGNs with a maximum solid-part diameter < 2.5 mm, a mean CT value < -581 HU and a CT value of the ground glass part < -675 HU indicate AIS. While lesions with a maximum solid-part diameter ≥ 5.5 mm, a mean CT value ≥ -464 HU and a CT value of the ground glass part ≥ -562 HU indicate IAC. Lesions with parameters in-between these values indicate MIA. Lobulation, spiculation and air bronchograms can help to identify more invasive lesions.
