1. Background
Acute myocardial infarction (AMI) is the main cause of death throughout the world despite diagnostic developments and therapeutic improvements (1). Patients with AMI have high mortality. Local left ventricular function is altered during and after AMI. Most studies describe changes in the infarcted myocardium. These changes occur in the infarcted, ischemic and adjacent regions of the myocardium (2, 3). There is less information about changes in the remote region of AMI in the myocardium. It is still argumentative whether remote myocardium after AMI is hypo-functioning or hyper functioning (4-6). This has not been well studied by cardiac imaging.
Cardiac magnetic resonance imaging (CMRI) is a powerful diagnostic tool that can provide more accurate measurements of cardiac chambers, volumes, dimensions (7), local cardiac wall function (8), and infarct area extent (9). It has been considered as the gold standard for evaluating systolic wall thickening (6). Studies have shown that regional wall function can be assessed using CMR strain analysis (10). Strain is a measure of the change in size and shape of an object and can be derived from CMR by using grid-tagging (11), displacement encoding with stimulated echoes (DENSE) (12) or velocity-encoded (VE) imaging (13). Studies conducted by Kroeker et al. and Garot et al. found that myocardial infarction decrease left ventricular (LV) thickness and twist (rotation of heart muscle during contraction) during LV contraction (14, 15). Therefore, to obtain the corresponding point in the next frame and to assess function of the myocardium, point tracking methods have been used.
Heart wall motion tracking methods can be divided into two groups: local point tracking and image registration. In local point tracking, the first selected points are tracked from diastole to systole. Subsequently, dense motion field is estimated. Reconstruction dense motion field from a sparse set of control points is an ill-posed problem. Therefore, to have a unique solution, we need additional constraints. These limitations have previously been suggested in the literature (16). The other method for motion tracking is whole image registration or feature point registration (17). Dinan et al. used block matching to track the end diastole selected points over all frames (18). Kermani et al. proposed correlation based 3D block matching to track sparse point during cardiac cycle (19). They used Sobel based gradient operator that works on edges. Gradient based methods do not contain information about the region, so they may cause miss tracking. Therefore, a method that carries information from the region is required. Some methods such as mutual information (MI) and normalized mutual information (NMI) could give useful information from the determined region in order to compute the similarities by extracting some nonlinear feathers (20-23). NMI is a powerful method to measure the similarities of two images (8, 20, 24). Tahan et al. used NMI as a similarity metric in the registration of two sequential cardiac tagged MRIs. In tagged MRI, tag lines vanish during the cardiac contraction cycle (25). Zhang et al. applied NMI as a similarity metric in order to track coronary artery motion based on non-rigid registration method in 4D cardiac CT angiogram data sets (24, 26). Beache et al. used NMI in cardiac perfusion data to evaluate myocardium functionality by affine-based registration. They demonstrated that this method could assess the cardiac wall properly (27). Most of these methods have used MI or NMI in order to measure whole image similarities. In the present study, similarities were calculates in small sub images, so subtle alteration in density and shape caused considerable alteration in similarity measurements. Another similarity metric tool is correlation coefficient, which is only able to take into account linear relationships. Correlation coefficient is a good measure in a case of similar subject and modality (28). Because of using the same modalities in the tracking method, we proposed correlation coefficient based weighted-NMI, in order to improve the result accuracy by considering both linear and nonlinear features. Therefore, this study was constructed to assess local myocardial wall function by measuring path-length and fractional wall thickening by tracking some points in the LV wall from end-diastole to end-systole using weighted-NMI. Obtained features of acute myocardial infarct patients compared with healthy individuals by quantizing wall motion.
This paper is organized as follows: first CMRI images were segmented over all slices in end-diastole frame, and then selected boundary points were tracked by weighted-NMI to extract the local dynamic and functional LV parameters. Then measured fractional thickening and path-length of healthy and infarct regions were visualized. We have also validated our method with real data acquired from patients and the infarct regions were successfully located with outstanding reliability and accuracy.
2. Patients and Methods
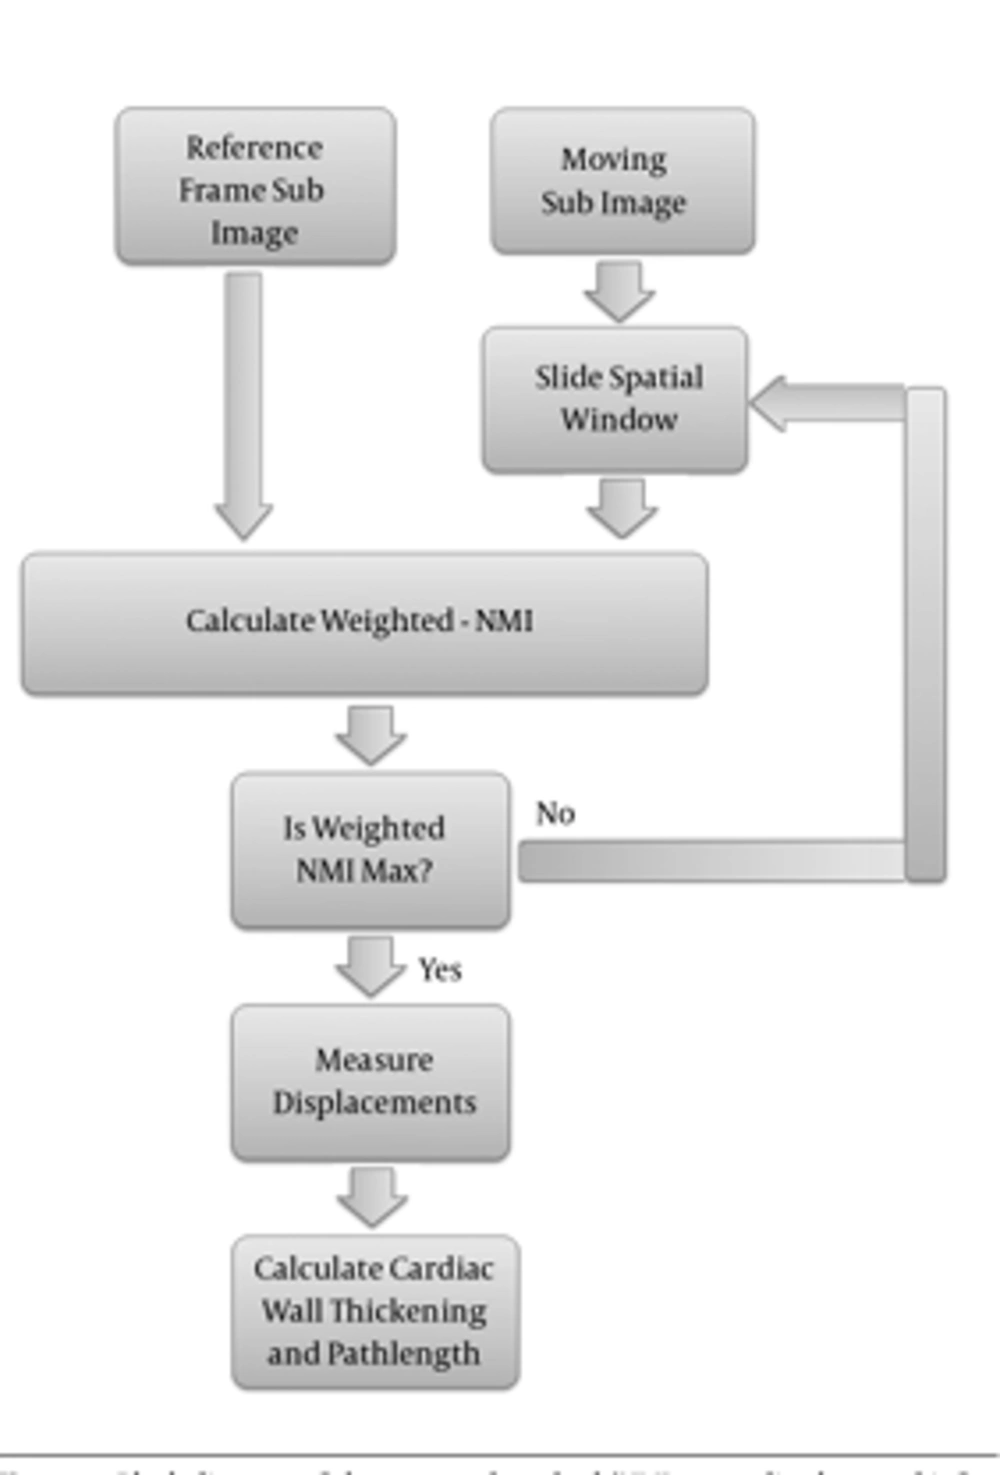
An overview of the proposed method is demonstrated in Figure 1.
2.1. CMRI Imaging
Real patient geometric data with myocardial infarct was selected from three cine MRI databases. Eleven gradient-echo images were performed on a 1.5 T scanner (Symphony Siemens, Germany) in Isfahan MRI Center, Isfahan, Iran (19). Twenty of the images were obtained from Sunnybrook health sciences centre, Toronto, Canada (29) and 20 of them were obtained from cardiac atlas project (30). The implemented MATLAB program runs in a computer with dual core 2.53 GHz CPU and 16G of RAM. Information of patient has brought in Table 1.
| Type of Data | Number | Age | Sex | Scanner | Resolution | MRI Protocols | ||||
|---|---|---|---|---|---|---|---|---|---|---|
| Healthy /Patient | Mean | Std | M/F | GE/Siemens/Philips | Pixel | #Slice | # Time Frame | |||
| Isfahan MRI Center | Healthy | 6 | 50.00 | 14.73 | M & F | Siemens | 256 × 256 | 20 | 21 | MRSSFP |
| Infarct | 5 | 65.00 | NA | M & F | Siemens | 256 × 256 | 20 | 21 | MRSSFP | |
| Sunnybrook | Healthy | 10 | 60.66 | 17.95 | M & F | GE | 256 × 256 | 10.56 ± 1.8 | 20 | MRSSFP |
| Infarct | 10 | 61.16 | 12.35 | M | GE | 256 × 256 | 10.18 ± 1.7 | 20 | MRSSFP | |
| Cardiac Atlas Project | Infarct | 20 | NA | NA | NA | Philips | 256 × 256 | 11 ± 2.21 | 20 | MRSSFP |
Cardiac MRI Dataa
2.2. Myocardium Segmentation
Epi/Endocardial of all slices in all frames, are segmented exactly based on the algorithm introduced by Heiberg et al. (31). This method is developed on the concept of deformable models but extended with an enhanced and fast edge detection scheme that includes temporal information and anatomical priori knowledge. In this method, LV model is a time-resolved mesh representation of the LV as an open cone, sliced along the cone’s long axis with 80 numbers of points in each slice. Results of this algorithm are not accurate among all slices and frames, so all segmentations were refined by an expert until contours coincided to the epi/endocardium.
2.3. Sparse Point Tracking
To obtain the sparse field of displacement, the point on the epi/endocardial surfaces were used. To track the point displacement and determination of the initial sparse motion field, efficient weighted-NMI algorithm was used. This approach was implemented on two sequential frames of a 3D sequence image. First, 3D reference mask with center of selected points in end diastole frame was constructed. Then, a moving mask with the same size as the generated mask with a close center to the reference mask was constructed in the next frame. The moving mask moves in all directions and weighted-NMI of the moving mask and reference mask was calculated. Then, the center points of the two masks with high weighted-NMI were considered as the corresponding points. The center point of the moving mask with high weighted-NMI was considered as the reference mask, and the moving mask is transferred to the next frame. This procedure continued until the moving mask reached the end systole frame. Finally, the tracking process was repeated for all selected points in end diastole frame to measure their displacements during the cardiac cycle.
2.4. Weighted-NMI
One way to measure the similarities of two images is MI. It uses joint entropy and marginal entropy to calculate the common information between the two images based on Equation 1:
Where H (X) and H (Y) are marginal entropy, and H (X, Y) is joint (Shannon) entropy, which is obtained as Equations 2-4.
Where Px (x), Py (y), and Pxy (x, y) are marginal probability density function and joint probability density function, respectively and obtained as Equations 5 and 6.
In MI, joint entropy and marginal entropy of the moving image vary with changing overlap, so it is not appropriate for tracking a point. In order to provide overlap invariance, we need a measure independent of changes in the marginal entropies H (X) and H (Y) of the two images in their region of overlap. A direct approach is normalization, which was used in this paper to evaluate the ratio of the joint and marginal entropies. On the other hand, since correlation coefficient is a better measure of similarity in the case of similar subject and modality, it is used to detect changes in intensity or the shape of a structure. Correlation coefficient metric was computed pixel-wise and misalignment between the images resulted in small measure values. We used correlation coefficient to weight the NMI as Equation 7. Weighted-NMI needs both linear and non-linear properties of two compared images so the accuracy of tracking can be improved.
Where CC is the correlation coefficient as a weight (Equation 8).
Where, I1 and I2 are the reference frame mask and moving mask in the adjacent frame, respectively, and N is the number of voxels.
Correspondent point in the next frame obtained by maximizing the weighted-NMI as Equation 9:
Finally, by subtracting two points – reference point and its correspondent point in the next frame – the displacements were obtained as Equation 10:
Where PR stands for reference points, and CPNF stands for the correspondent point in the next frame. After calculating the displacements from systole to diastole, useful parameters for infarct region detection are extracted.
2.5. Wall Thickening
For assessment of local wall thickening from the short-axis cine MRI images, cardiac wall thickness, wall thickening, and fractional wall thickening were computed after manual refining of the endo/epicardial borders. The left ventricle was divided into eight sectors in each slice. For result improvement, papillary muscles were excluded from the myocardium segmentation. Basal slice in short axis is the first slice of cardiac cine MRI that contains all LV wall in the end diastole frame. To measure LV wall thickness, Euclidian distance between endocardium and epicardium points is calculated as Equation 11:
In a healthy heart during ventricular contraction, the LV wall begins to thicken. LV wall thickening rate is defined as difference between LV wall thicknesses in two successive frames (Equation 12):
Since LV wall thickness differs in different direction of slices, LV wall thickening is normalized. Fractional wall thickening defined as wall thickening is divided by end diastolic wall thickness as Equation 13:
2.6. Path Length Measurement
Path length is defined as the total distance a points moves. Unlike displacement, which is the total distance a point moves from the end diastole frame to the end systole frame, path length is the total distance travelled, regardless of where it moved (Equation 14).
Dji is the distance between nodes in frames i and j. Polar map representation of path length for patients has been presented in 17-segment bulls-eye.
3. Results
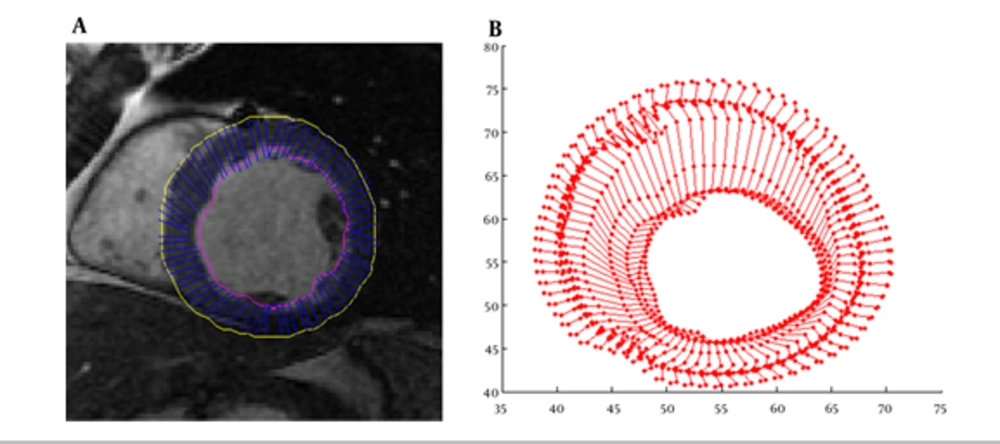
As illustrated above for myocardium functionality evaluation we measured several local parameters including cardiac wall thickening, fractional thickening and path-length of boundary points. In the first step, cardiac wall in the end diastole frame was segmented then boundary points were tracked using weighted-NMI. Segmentation results and trajectory of boundary points are demonstrated in Figure 2.
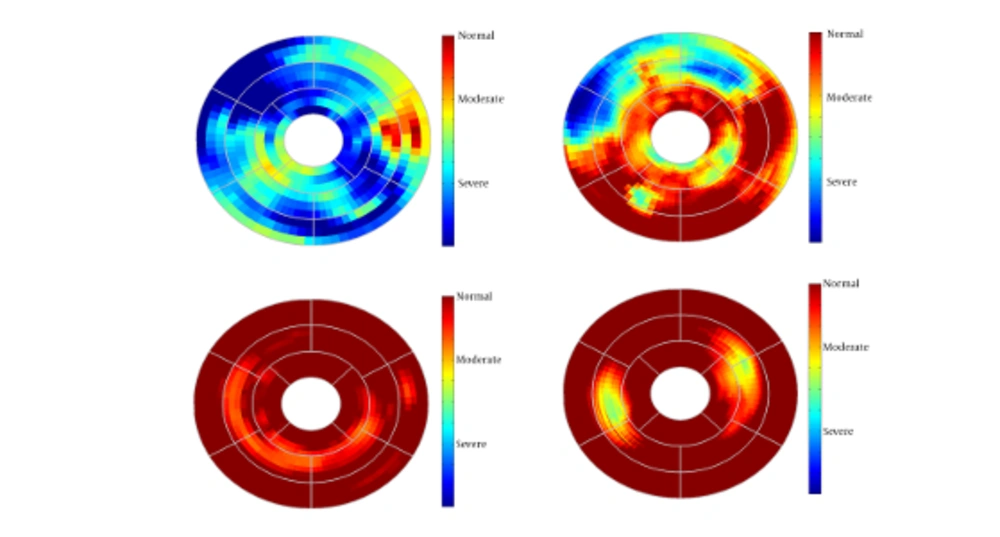
Since this method generates 3-D path-length fields for all 3-D points, for better evaluation we divided the entire LV wall into three sections: the basal layer, the mid-ventricular layer, and the apical layer. Furthermore, the apical layer was divided into four regions: anterior, lateral, inferior, and septal. The mid-ventricular layer was divided into six regions: antero-septal, anterior, lateral, posterior, inferior, and infero-septal. Finally, the basal layer was divided into antero-septal, anterior, lateral, posterior, inferior, and infero-septal regions. The normalized path-lengths of LV wall over each of the 16 segmented regions were plotted in standard bull’s-eye format. Normalized path-length of LV wall in standard bull’s eye format is demonstrated in Figure 3.
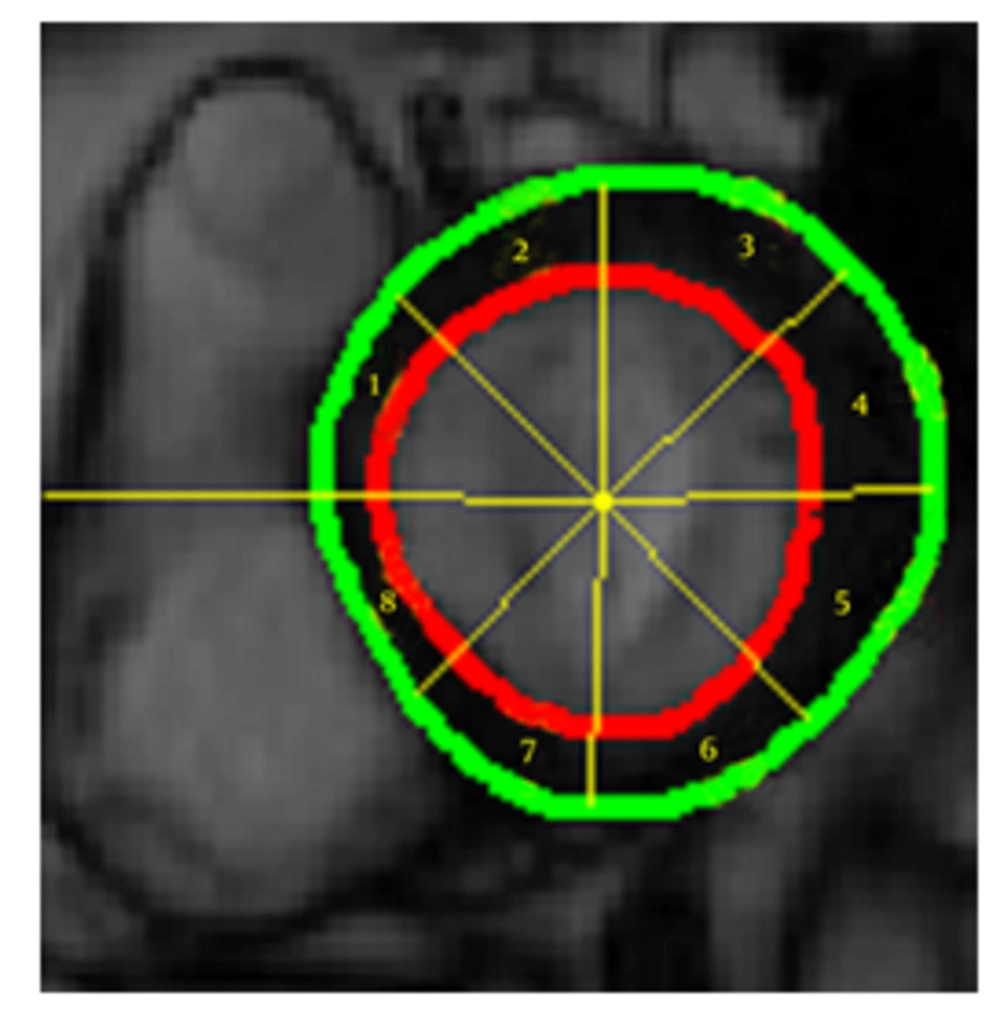
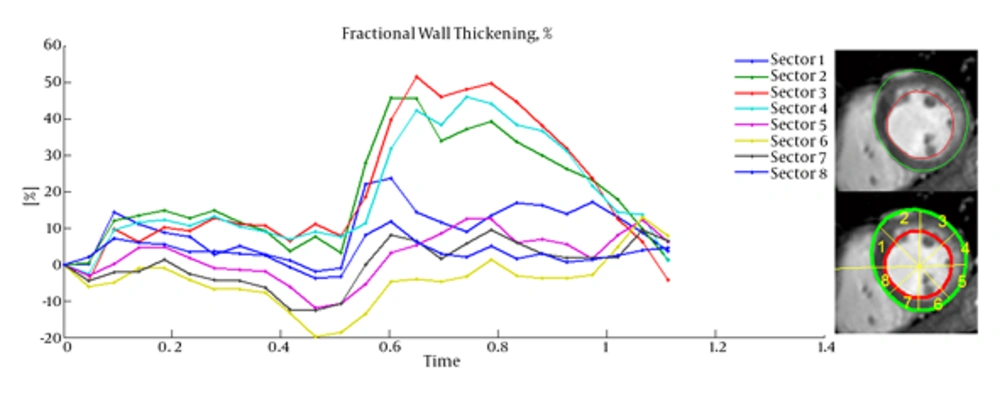
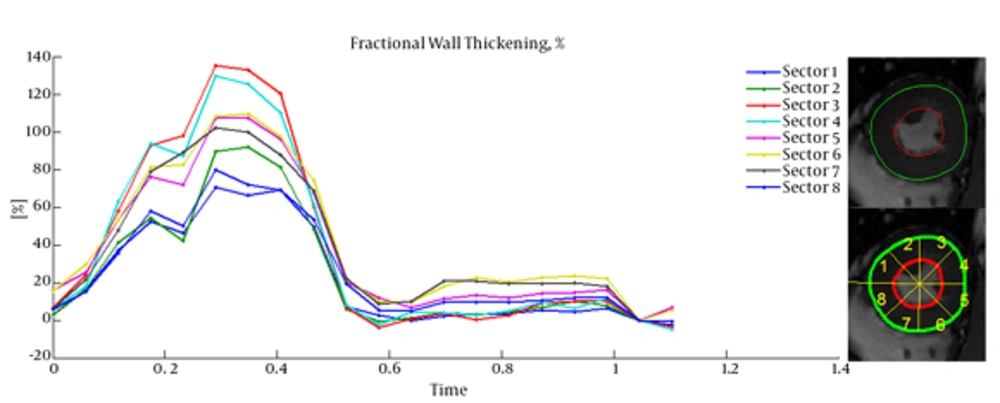
Cardiac wall fractional thickening was evaluated as a measure of myocardium performance. Fractional thickening was calculated for all data points over time (cardiac cycle time). Cardiac wall in short axis was considered as a circle and divided into eight sectors as shown in Figure 4, then fractional thickening of the cardiac wall was computed in each sector.
Because the fractional thickening was computed over all frames, we plotted it as a function of time. For all plots, end-diastole was considered as the reference frame for calculating fractional thickening. The magnitude of fractional thickening values generally increases as the left ventricle contracts during systole. In infarct regions, the magnitude of fractional thickening is less than normal regions as showed in Figures 5 and 6.
4. Discussion
Current study was performed to evaluate myocardial functionality using weighted normalized mutual information for cardiac wall boundary point tracking. Myocardial function was assessed by measuring normalized path-length of boundary points and fractional wall thickening calculation. We investigated the problem of detecting and localizing myocardium abnormality. The 3D motion of LV was tracked throughout the entire cardiac cycle, and a quantitative analysis was performed. The results of fractional wall thickening showed that wall thickness increases from diastole to systole phase of the cardiac cycle. In patients with infarction, wall thickening in the infarct region of the myocardium is less than the healthy region as illustrated in figures 5 and 6. This finding is well matched with clinical findings caused when an infarction occurs; the myocardial muscle loses its elasticity and function. The infarct region of the myocardial muscle does not contract. Subsequently, the wall thickness is less subject to change. For better visualization and interpretation, results of normalized path-length have been sketched in 17 bull’s-eye format, which maps 3D cardiac wall to 2D circle. As mentioned before, each segment in bull’s-eye belongs to a specific region of the heart. So by plotting normalized path-length in bull’-eye format, the infarct region could be determined. In addition, the extent and severity of the infarction could be determined. As shown in figure 3, one patient has infarction on all sides of the wall and the other patient has extensive infarction from basal to mid ventricular LV but with more severity in the basal region, which is consistent with clinical findings. Unfortunately, the researchers failed to get access to CMRI sequences with implanted markers for comparison between marker trajectories and trajectories which have been derived from the proposed algorithm.
In conclusion, our proposed method is capable of producing comprehensive myocardial fractional wall thickening and path-length calculations for assessing myocardial functionality by measuring displacement fields based on tracking procedure. The novelty of the method is that at the conclusion of point tracking, cardiac wall boundary point displacements, myocardium boundary point path-length and fractional thickenings of the myocardium are immediately available. We illustrated these with results from 51 real human cardiac MRIs. The resulting path-length values were normalized across studies and were shown in standard bull’-eye format and the fractional wall thickening of the heart was plotted over the systolic phase of the cardiac cycle. Results demonstrated that this method could be used for fast evaluation of myocardium functionality.
