1. Background
Chronic hepatitis B virus (HBV) infection affects about 400 million patients worldwide and has a particularly high prevalence in China. It establishes the common histo-pathological finding of fibrosis, and if the damage continues, portal hypertension, cirrhosis, and even hepatocellular carcinoma could develop. Long-term suppression of HBV with antiviral or antifibrotic therapies has proved to be effective in reversing advanced fibrosis or cirrhosis (1-3). Therefore, accurate evaluation of the degree of fibrosis and cirrhosis is crucial for determining treatment strategies, surveillance, and prognosis in chronic hepatitis B patients (CHB). Liver biopsy is considered as the gold standard for staging liver fibrosis. However, it is invasive (4). In addition, because of interobserver variations and sampling errors, the reproducibility of liver biopsy is limited (5, 6). Many studies have indicated that acoustic radiation force impulse (ARFI) technology could be applied for assessing liver fibrosis arising from various etiologies and especially chronic hepatitis C (7-12). However, when liver fibrosis progresses into cirrhosis, the current pathological staging standard cannot further distinguish the degree of cirrhosis. For patients with cirrhosis, portal hypertension can lead to a major complications. Hepatic vein pressure gradient (HVPG) is the most recommended prognostic method in patients with cirrhosis. Complications of cirrhosis are usually observed when HVPG ≥ 10 mm Hg, which is defined as clinically significant portal hypertension (CSPH) (13). Accordingly, HVPG has been proved to be an excellent predictor of clinical decompensation (14). HVPG ≥ 12 mm Hg (severe portal hypertension, SPH) is closely related with increased risk of variceal bleeding and death (15). Previous evidence indicated that liver or spleen stiffness measured by ultrasound elastography was highly correlated with HVPG, and liver stiffness value increased as the extent of HVPG progressed (16-20). However, the efficiency of ARFI imaging for assessing the degree of portal hypertension among CHB patients with cirrhosis has been slightly investigated.
2. Objectives
The present study aimed to investigate the value of ARFI elastography in evaluating not only the stage of liver fibrosis but more importantly, the feasibility of estimating the severity of cirrhosis based on portal hypertension in CHB patients.
3. Patients and Methods
3.1. Patients
Our study was performed in accordance with the principles of the Declaration of Helsinki and its appendices. Approval was obtained from the ethics committee in our institute and informed consent was obtained from all patients. From February 2012 to September 2015, two hundred and three patients with liver neoplasm who were referred for surgery and 64 liver cirrhosis patients who would undergo HVPG measurement were included. One hundred and fifty-one (74.4%) of 203 patients with liver neoplasm in our study group were hepatocellular carcinoma, and five patients (2.5%) were cholangiocellular carcinoma. However, there were also liver hemangioma (27 patients; 13.3%), hepatic focal nodular hyperplasia (eight patients; 3.9%), hepatic adenoma (seven patients; 3.4%) and inflammatory pseudotumor (three patients; 1.5%), and cirrhotic nodule or dysplastic nodule (two patients; 1.0%) patients. Sixty-four patients with advanced cirrhosis without tumors who would undergo HVPG measurement in our hospital at the same time were also recruited. All of these patients had chronic liver disease due to viral hepatitis B, verified with serologic testing. The diagnosis of advanced cirrhosis was established on progressive chronic liver disease due to hepatitis B with laboratory and sonographic evidence of portal hypertension or the presence of portal hypertension complications such as ascites and variceal bleeding. Patients with other forms of chronic liver diseases or patients who had ever undergone antiviral treatments were excluded. For patients with focal liver lesions, strict exclusion criteria were made to eliminate potential effects of tumors on the values of LSMs of liver parenchyma adjacent to them, which included a maximum tumor diameter greater than 4 cm, cholestasis, hilar cholangiocarcinoma, portal vein thrombosis diagnosed by computed tomography or magnetic resonance imaging, a history of transjugular intrahepatic portosystemic shunts and patients with necroinflammatory activity grade 4. Liver function was confirmed to be normal or almost normal (within the normal range or increased no more than twice the normal value) in all patients.
3.2. Ultrasound Examination and ARFI Procedure
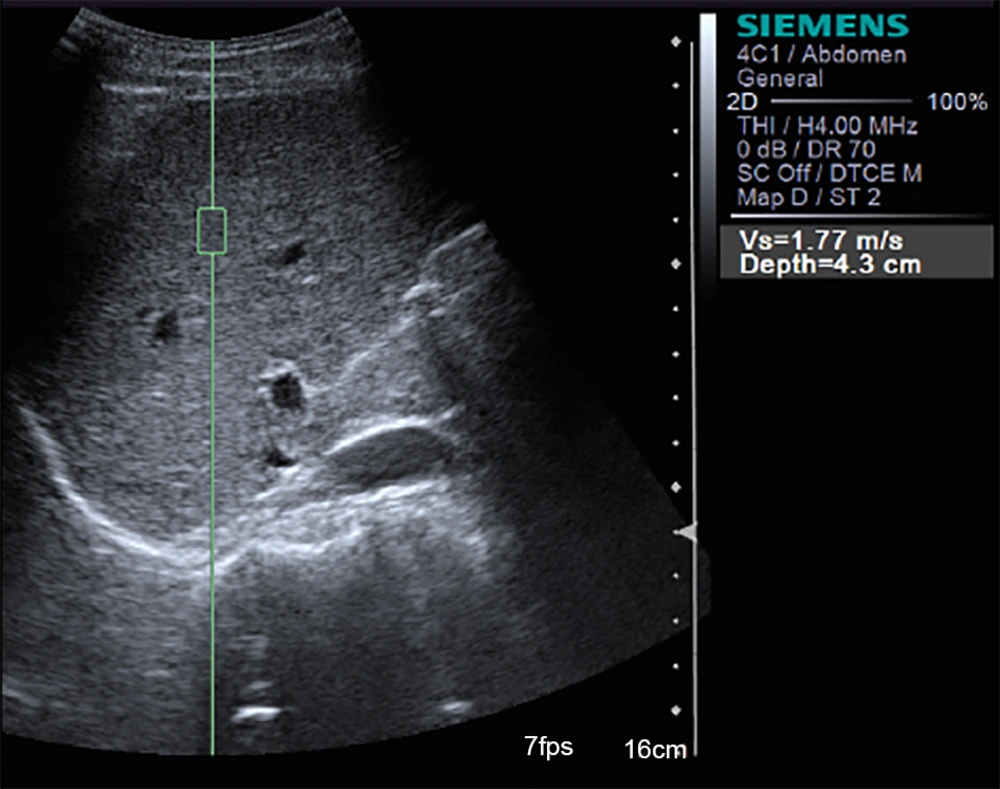
Ultrasonography including hepatocellular carcinoma (HCC) screening was performed in all patients. The sonographic signs of portal hypertension were evaluated according to the European federation of societies for ultrasound in medicine and biology (EFSUMB) recommendations: dilatation of the portal vein ≥ 13 mm, reduction of portal vein velocity < 13 cm/s, dilatation of the splenic vein and superior mesenteric vein ≥ 11 mm, splenomegaly > 12 cm, increased resistive index of the hepatic artery > 0.78, and presence of portosystemic shunts (21). ARFI measurement was performed in virtual tissue quantification mode using Siemens Acuson S2000 ultrasound system with a broadband convex probe (4C1; 1.5 - 4.0 MHz) within no more than a week before partial hepatectomy or HVPG measurement. Patients were tested in supine position after an overnight fast by two radiologists (with 3 years and 25 years of ultrasound experience) who were blind to clinical, serological, and histological data. Each one of them independently assessed part of the patients and the data were combined together. Liver stiffness assessment was performed on the right lobe (the seventh to the tenth intercostal space) of the liver. The region of interest (ROI) was a hepatic area no less than 2 cm from the margin of liver tumors without visible bile ducts and vessels that was 4 - 5 cm beneath the transducer surface (Figure 1). Spleen stiffness measured by placing the probe in the left intercostal spaces was also conducted on those patients who would undergo HVPG. While ARFI measurements were being made, patients held their breath. The ROI was perpendicular to the center of the probe surface, and 10 valid measurements were performed in the same location on the liver or spleen in each patient. The mean value of 10 measurements was considered as the liver stiffness measurement (LSM) or the spleen stiffness measurement (SSM).
3.3. Measurement of HVPG and Spleen Index
Patients who underwent HVPG measurement were CHB patients with a diagnosis of advanced cirrhosis in the gastroenterology department in our hospital. HVPG was measured by an experienced interventional radiologist within 1 week of the ARFI measurement. A 6-F venous introducer was inserted into the right internal jugular vein by using the Seldinger technique. A 4-F catheter was inserted into the right hepatic vein with fluoroscopic control. HVPG was calculated as the difference between hepatic venous pressure and the free hepatic venous pressure. The HVPG value was calculated as the mean of three measurements. The spleen index was also measured in the advanced cirrhosis group. The index was calculated as the largest diameter of the spleen, measured at the level of the spleen hilum in the coronal plane, multiplied by the thickness of the spleen, measured as the shortest distance between the spleen hilum to the opposite spleen capsule. The value of spleen index was indicated as square centimeters.
3.4. Histo-Pathological Analysis
After partial hepatectomy, the liver parenchyma of resected liver specimens at least than 2 cm from the margin of the tumor were fixed in formalin, embedded in paraffin, and stained with hematoxylin-eosin. All specimens were analyzed according to the Scheuer scoring system by two pathologists by consensus, each of them with 20 and 10 years of experience. According to Scheuer scoring system, fibrosis was staged on a scale from 0 to 4 (22): stage 0 (S0) defined as the absence of fibrosis; stage 1 (S1) defined as fibrous portal expansion; stage 2 (S2) defined as periportal or rare portal-portal septa; stage 3 (S3) defined as fibrous septa with architectural distortion; and stage 4 (S4) defined as cirrhosis. As for necroinflammatory activity: no portal/periportal and lobular necroinflammatory activity was defined as grade 0 (G0); portal/periportal inflammation and minimal, occasionally spotty lobular inflammation was defined as grade 1 (G1); mild piecemeal portal/periportal necrosis and mild or focal lobular necrosis was defined as grade 2 (G2); moderate piecemeal portal/periportal necrosis and moderate or noticeable hepatocellular change inside the lobule was defined as grade 3 (G3); and severe piecemeal portal/periportal necrosis and severe hepatocellular damage inside the lobule was defined as grade 4 (G4).
3.5. Statistical Analysis
Data were first tested for normality by using one-sample Kolmogorov-Smirnov test. Continuous quantitative variables were summarized as the mean ± standard deviation or the median (the first quartile - the third quartile) as appropriate; whereas, categorical variables were presented as counts (percentages). Correlations among different variables were estimated by the Spearman correlation coefficient. Performance of ARFI imaging in estimating the degree of fibrosis and portal pressure was determined with area under receiver operating characteristic curve (AUROC) and the optimal cutoff values were identified from the highest Youden index. Statistical analysis was performed with SPSS (version 21.0; SPSS Inc, Chicago, IL, USA). For all tests, a p-value of less than 0.05 indicated a significant difference or correlation.
4. Results
4.1. Patient Characteristics
Three patients were excluded because of right hepatic lobe atrophy. ARFI measurements were performed on 264 patients and the measurements were invalid in four patients (2.0%) because of extreme obesity or inability to hold breath. So, the successful rate of ARFI measurements was 98.5%. In total, 260 patients enrolled successfully underwent ARFI measurements and were divided to S0 - S4 groups, among which the cirrhosis group included patients identified as S4 and 64 patients in the advanced cirrhosis group. The characteristics of the patients are shown in Table 1.
| Characteristics | All patients (n = 260) | Advanced cirrhosis patients (n = 64) |
|---|---|---|
| Gender (male/female) | 189/71 | 42/22 |
| Age (years) | 53.9 ± 11.6 | 55.8 ± 11.2 |
| ALT (IU/L) | 31 (21 - 48) | 45 (32 - 64) |
| AST (IU/L) | 30 (22 - 47) | 50 (42 - 85) |
| PLT × 109/L | 144 (104 - 181) | 159 (109 - 250) |
| INR | 1.01 (0.97 - 1.05) | 1.02 (0.81 - 1.24) |
| LSM (m/s) | 1.48 (1.26 - 1.82) | 1.99 (1.74 - 2.47) |
| HVPG (mm Hg) | - | 12.75 ± 5.53 |
| Fibrosis stage, No. (%) | ||
| S0 | 15 (5.8) | 0 |
| S1 | 23 (8.8) | 0 |
| S2 | 37 (14.2) | 0 |
| S3 | 40 (15.4) | 0 |
| S4 | 145 (55.7) | 64 |
| Inflammatory activity grade, No. (%) | ||
| G0 | 10 (5.1) | - |
| G1 | 51 (26.0) | - |
| G2 | 106 (54.1) | - |
| G3 | 29 (14.8) | - |
| G4 | 0 | - |
Abbreviations: ALT, alanine aminotransferase; AST, aspartate aminotransferase; HVPG, hepatic vein pressure gradient; INR, international normalized ratio; LSM, liver stiffness measurement; PLT, platelet count
aData were represented as the mean ± standard deviation or the median (the first quartile - the third quartile), depending on whether there was a normal or non-normal distribution of variables; unless otherwise indicated.
4.2. Relationship Between LSM and Liver Histologic Findings
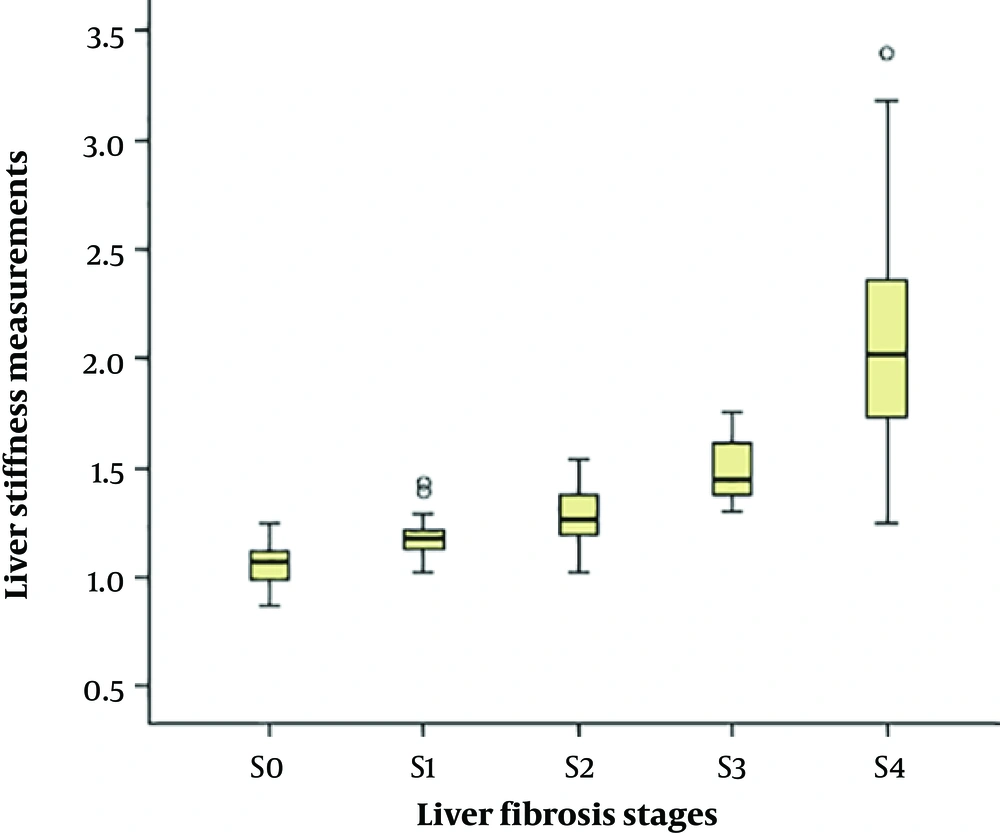
Distribution of LSM compared with different hepatic fibrosis stages are shown in Figure 2. Shear-wave velocities of ARFI measured in the study ranged from 0.87 m/s to 3.40 m/s. A high correlation was observed between LSM and progressing stage of fibrosis (Table 2). The correlation coefficient for the association between LSM and different fibrosis stages and necroinflammatory grades were 0.817 and 0.427, respectively (P < 0.001).
Box and whisker plots of liver stiffness by acoustic radiation force impulse (ARFI) elastography at each fibrosis stage (S0 - S4). The box plot shows the interquartile range (central box), median (thick line) and range (thin lines) of liver stiffness assessed with ARFI (O = outside values, * = outliers).
| Parameters | Liver stiffness measurements | ||
|---|---|---|---|
| Median (m/s) | ρ value | P value | |
| Necroinflammatory activity grade | 0.427 | < 0.001 | |
| Liver fibrosis stage | 0.817 | < 0.001 | |
| S0 | 1.07 (0.98 - 1.13) | - | - |
| S1 | 1.18 (1.13 - 1.21) | - | - |
| S2 | 1.27 (1.19 - 1.39) | - | - |
| S3 | 1.45 (1.38 - 1.63) | - | - |
| S4 | 2.08 (1.72 - 2.47) | - | - |
Abbreviation: LSM, liver stiffness measurements
aData were represented as the median (the first quartile - the third quartile).
The diagnostic value of LSM for different histological fibrosis stages was assessed by AUROC. AUROC values were 0.952 for predicting fibrosis of S2 or higher and 0.976 for cirrhosis. The optimal cutoff values were 1.26 m/s and 1.58 m/s, respectively (Table 3). When LSM was more than 1.40 m/s, the sensitivity of predicting cirrhosis was 100%, and when LSM was more than 1.82 m/s, the specificity was 100%.
| AUROC [95% CI] | Cutoff value (m/s) | Se (%) [95% CI] | Sp (%) [95% CI] | PPV (%) [95% CI] | NPV (%) [95% CI] | Accuracy (%) [95% CI] | |
|---|---|---|---|---|---|---|---|
| Liver fibrosis stage (n = 196) | |||||||
| S0, 1 vs. S2-4 | 0.952 [0.948 - 0.987] | 1.26 | 89.9 [72.4 - 99.9] | 92.1 [83.1 - 99.9] | 97.9 [90.6 - 99.9] | 68.6 [56.8 - 80.4] | 90.3 [79.6 - 99.8] |
| S0-3 vs. S4 | 0.976 [0.960 - 0.993] | 1.58 | 95.1 [88.1 - 99.9] | 91.3 [81.5 - 99.9] | 88.5 [77.9 - 99.1] | 96.3 [89.9 - 99.9] | 92.9 [85.1 - 99.9] |
| HVPG in advanced cirrhosis group (n = 64) | |||||||
| HVPG ≥ 10 mm Hg | 0.665 [0.510 - 0.821] | 1.79 | 79.4 [62.8 - 91.8] | 55.6 [40.8 - 70.4] | 73.8 [57.9 - 89.7] | 63.6 [49.1 - 78.1] | 70.3 [55.8 - 84.8] |
| HVPG ≥ 12 mm Hg | 0.859 [0.675 - 0.900] | 1.90 | 87.9 [76.2 - 99.6] | 64.5 [51.4 - 77.6] | 72.5 [59.4 - 85.6] | 83.3 [68.6 - 98.0] | 76.6 [58.5 - 94.7] |
Abbreviations: AUROC, area under the receiver operating characteristics curve; HVPG, hepatic vein pressure gradient; NPV, negative predictive value; PPV, positive predictive value; Se, sensitivity; Sp, specificity; 95% CI, 95% confidence interval
4.3. Association of LSM, SSM, and Spleen Index with HVPG Among Patients with Advanced Cirrhosis
The value of HVPG ranged from 1 mm Hg to 23 mm Hg, with an average of 12.75 ± 5.53 mm Hg. Spearman correlation test indicated a positive relationship between LSM and HVPG (ρ = 0.637, P < 0.001) (Table 4). The spleen index value ranged from 23.1 cm2 to 137.3 cm2. The results showed no relationship between HVPG and the value of SSM or spleen index (P > 0.05). However, Spearman test indicated significant correlations between the value of SSM and spleen index (ρ = 0.604, P < 0.05).
| Parameter (n = 64) | Measured values | Correlation with HVPG | |
|---|---|---|---|
| ρ value | P value | ||
| †LSM (m/s) | 1.99 (1.74 - 2.47) | 0.637 | < 0.001 |
| ‡SSM (m/s) | 3.43 (3.11 - 3.74) | 0.120 | 0.456 |
| †Spleen index (cm2) | 92.13 (80.46 - 100.51) | 0.092 | 0.574 |
Abbreviations: HVPG, hepatic vein pressure gradient; LSM, liver stiffness measurement; SSM, spleen stiffness measurement
4.4. Performance of ARFI Elastography in Predicting Portal Hypertension Among Patients with Advanced Cirrhosis
To determine the utility of ARFI imaging in evaluating portal hypertension among CHB patients with advanced cirrhosis, we used the receiver operating characteristic (ROC)
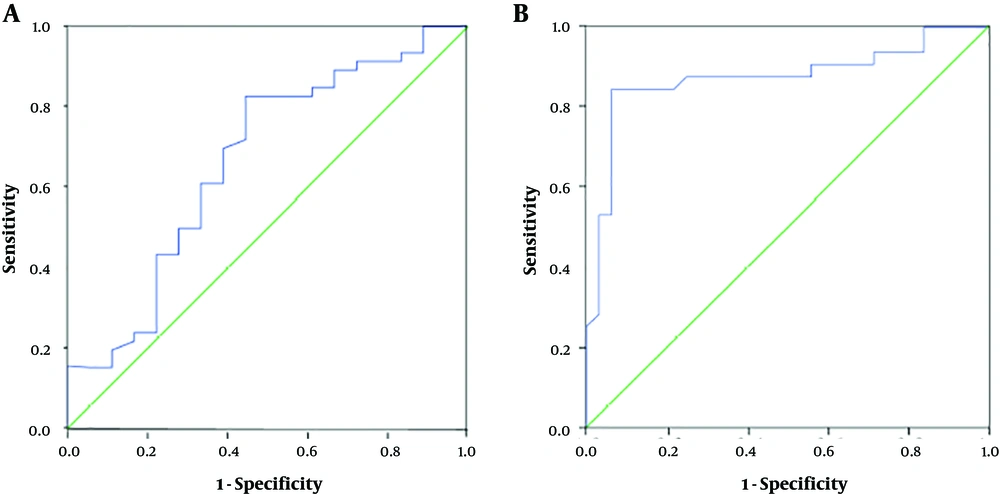
ROC method (Figure 3). The results showed that ARFI elastography could predict HVPG ≥ 10 mm Hg with AUROC 0.665. The optimal cutoff point was 1.79 m/s, with accuracy, sensitivity and specificity of 70.3%, 79.4% and 55.6%, respectively. ARFI elastography predicted HVPG ≥ 12 mm Hg with AUROC 0.859. The cutoff value was 1.90 m/s, with accuracy, sensitivity and specificity of 76.6%, 87.9% and 64.5%, respectively (Table 3). When LSM was more than 1.41 m/s, the sensitivity of predicting HVPG ≥ 12 mm was 100%, and when LSM was more than 2.41 m/s, the specificity was 100%.
Receiver operating characteristic (ROC) curves based on liver stiffness measured with acoustic radiation force impulse (ARFI) imaging for predicting portal hypertension in cirrhosis patients. Areas under the receiver operating characteristic curve (AUROC) was 0.665 for diagnosing hepatic vein pressure gradient (HVPG) ≥ 10 mm Hg (A) and 0.859 for diagnosing HVPG ≥ 12 mm Hg (B).
5. Discussion
Antifibrogenic therapy decisions and prognosis for CHB patients are highly dependent on the extent of liver fibrosis (23). Research has focused on noninvasive approaches based on imaging techniques and biomedical tests for staging liver fibrosis. Biochemical tests consist of sophisticated models such as aminotransferase/platelet ratio index, Forns index, King’s score, fibrosis index (24, 25). However, the value of the biomedical diagnostic methods may be affected by factors that are unrelated to the liver and thus lead to the unreliable results.
One of the imaging alternatives is to measure the tissue elasticity by using various techniques, including transient elastography (TE), point shear wave speed measurement, and 2-D shear wave elastography (10, 26-30). At present, TE is the most commonly recommended method and widely accepted as related to the degree of fibrosis (10, 11, 26, 31, 32). However, TE is measured without image guiding. ARFI is one point shear wave speed measurement technique that has been incorporated into conventional ultrasound devices. Several researches have investigated the performance of ARFI in staging liver fibrosis in CHB patients (9, 33, 34). Our study confirmed the high success rate and the excellent predictive value of ARFI elastography in estimating significant fibrosis and cirrhosis (AUROC = 0.952 and 0.976), higher than the previous reports. The corresponding cutoff values (1.26 m/s and 1.58 m/s) were lower than the previous reported by Friedrich-Rust et al. (9), Sporea et al. (33) and by Zhang et al. (34) with the population for whom alanine transaminase (ALT) levels were evaluated and higher than the results by Zhang et al. (34) in patients with normal ALT levels. The discrepancies could be a result of the different liver ALT values and different histology assessment systems (METAVIR scoring system). Since many patients enrolled in our study had hepatocarcinomas, mostly of which develop in cirrhosis background, the percentage of fibrosis S4 group is much more than the previous studies.
As liver fibrosis gradually develops into cirrhosis, the extent of cirrhosis cannot be precisely estimated by the present histo-pathological staging system. In clinical practice, the degree of cirrhosis is defined as Scheuer scoring S4, METAVIR stage F4, ISHAK S5-S6 or generally by the presence of cirrhotic nodules. However, since cirrhosis is a heterogeneous disease that varies widely in severity, the existing definitions fail to distinguish a fibrogenic process that is potentially reversible from one that is irreversible. Hence, there is a pressing need to better characterize cirrhosis and recognize its underlying relationship between portal hypertension and tissue stiffness. Our study found that liver stiffness measured by ARFI was significantly related to HVPG in advanced cirrhosis group (ρ = 0.637, P < 0.001). Nevertheless, there was no significant correlation that was demonstrated between HVPG and the spleen index value or SSM, which conflicted with reports suggesting that spleen stiffness measured by sonoelastography might reflect portal hypertension (17, 20). However, these reports only recruited people with compensated cirrhosis, while our study included cirrhosis patients at a later stage. The result of our study agreed with the previous study conducted by Elkrief et al. (35), which indicated that spleen stiffness assessed by real-time shear wave elastography did not correlate with HVPG in patients with advanced cirrhosis. Our study further found that SSM significantly correlated with spleen index value (ρ = 0.604, P < 0.001). The preceding results might indicate that spleen stiffness measured by the ARFI correlates with the spleen index value rather than the value of HVPG in CHB patients with advanced cirrhosis.
The limitation of our study is that most enrolled patients had focal hepatic lesions, the results of this study could be non-generalizable to all chronic liver disease cases. To eliminate or decrease the influence of liver tumors on the value of LSMs with ARFI imaging, strict inclusion and exclusion criteria were made. Second, inclusion of a high proportion of patients with advanced cirrhosis limited the application of our study. Another limitation of our study is that owing to the potential risks and high cost of HVPG measurement, the sample of patients was not large enough to reach definitive conclusions.
Overall, ARFI elastography proved useful in the clinical estimation of the extent of liver fibrosis, as well as portal hypertension in patients with advanced cirrhosis. Even though it cannot replace liver biopsy and HVPG measurement, it would narrow the group who require invasive liver biopsy and HVPG measurement.


