1. Background
Pulmonary embolism (PE) is an obstruction in pulmonary arteries and their branches. It ranks third in the most common cardiovascular diseases with about 100 - 200 in 10 million in morbidity (1). Pulmonary angiography has been regarded as the gold standard for the diagnosis or exclusion of pulmonary embolism for decades, but non-invasive CT pulmonary angiography (CTPA) provides similar diagnostic accuracy. According to the PIOPED II (prospective study of PE diagnosis) test, the sensitivity was 83% and the specificity was 96% for CTPA with multi-slice CT (MSCT) (1). The observer confidence was up to 100% for PE diagnosis (2). CTPA has become the preferred method in the diagnosis or exclusion of patients with suspected pulmonary embolism (3-5).
Contrast medium (CM) is required in CTPA, and the CM may cause negative effects for the patients, among which contrast-induced nephropathy (CIN) is particularly prominent (6). If concurrent with diabetes and renal insufficiency, the morbidity of CIN could reach 19% or more (7), which is associated with mortality of patients and the third primary cause of hospital acquired renal failure (8). CM is almost completely excreted by the kidneys; therefore, higher contrast volume is associated with higher rates of CIN and mortality (9). The key is to reduce the occurrence of CM-induced adverse effects and healthcare costs by improving examination techniques to reduce CM dosage (10).
However, reducing CM dosage will have a negative impact on the pulmonary artery enhancement in conventional CTPA, and may impair the diagnostic tasks. Therefore, CM should be used as least as possible under the condition of meeting diagnostic requirements (11). On the other hand, imaging techniques have been improved constantly to provide better images with less radiation and contrast doses. The recently introduced dual-energy spectral CT provides monochromatic images with energy levels from 40 keV to 140 keV that could be used to improve the contrast-noise-ratio (CNR) in target vessels. CT values of the blood vessel in dual-energy spectral CTPA were significantly increased at low energy levels to provide the possibility of using low CM dosage in CTPA. However, the monochromatic energy levels in dual-energy spectral CTPA used by researchers were not consistent (2, 5, 7).
2. Objectives
The purpose of this study was to investigate the feasibility of using low CM volume in dual-energy spectral CTPA, and to determine the optimal monochromatic energy levels of displaying pulmonary arteries by quantitively and qualitatively analyzing the images with low CM volume, under the premise of ensuring diagnosis of PE.
3. Patients and Methods
3.1. Patients Group
This single-site prospective study was approved by our Institutional Review Board (the approval document no.: SZFYIEC-PF-2015 no. [08]), and written informed consents were received from all patients before CTPA examination. Thirty patients who were suspected of PE and underwent CTPA were collected from November 2015 to May 2016, 17 were males and 13 were females, the average age was 67.40 ± 9.15 years. Exclusion criteria were allergy to iodine CM, hyperthyroidism, severe liver and kidney dysfunction, severe non-compensatory cardiac insufficiency, pregnancy, and less than 18 years of age.
3.2. Data Acquisition and Reconstruction
All examinations were performed on a 64-slices dual-energy spectral CT scanner (discovery CT 750 HD, GE Healthcare, USA). Patients were trained to hold their breath after inspiration before the examination. Patients were scanned in supine position and craniocaudal direction, with both forearms raised to the head. The scanning range was from the apex to the costophrenic angle and completed while holding breath. The dual-energy spectral CT scanning protocol: GSI-36 (with tube current of 260 mA) was chosen. Scanning and reconstruction parameters are shown in Table 1. The scanning delay time was determined by using the timing bolus technique with the region of interest (ROI) placed in the pulmonary trunk at the aortic arch level. A 8 mL non-ionic iodinated CM (Ioversol, 350 mgI/mL; Jiangsu Hengrui Medicine Co. Ltd., China) was injected at a rate of 4.0 mL/s via the antecubital vein using a high-pressure syringe (Missouri XD2001, Ulrich medical, Buchbrunnenweg, Ulm, Germany) for test bolus (TB). The dynamic monitoring scanning, each monitoring point interval was set at 1s to generate the time-density curve, and to determine the best delay time from injection to peak enhancement. Subsequently, 25 mL CM of the same concentration was injected at the same rate and the scan started using the determined delay time +2 seconds for CTPA data acquisition. After the CM injection, 40ml of normal saline was injected. After scanning, monochromatic images with photon energies of 60 – 80 keV (at energy incremental of 5 keV) using the 50% adaptive statistical iterative reconstruction (50% ASiR) algorithm were retrospectively reconstructed and transferred to AW4.6 post processing workstation (GE Healthcare) for analysis.
| Scanning parameters | Values |
|---|---|
| Scanning protocol | GSI-36: 260 mA |
| Pitch | 1.375:1 |
| Rotation rate | 0.8 s/r |
| CM volume | 25 mL (350 mgI/mL, 4.0 mL/s) |
| Monitoring method | timing bolus (8 mL) |
| Reconstruction parameters | |
| Thickness | 1.25 mm |
| Algorithm | 50% ASiR |
| Reconstructed images | Virtual monochromatic images with 60 - 80 keV (5 keV incremental) |
Abbreviations: CM, contrast medium; CTPA, CT pulmonary angiography.
3.3. Data Measurement and Calculation
3.3.1. Objective Parameters
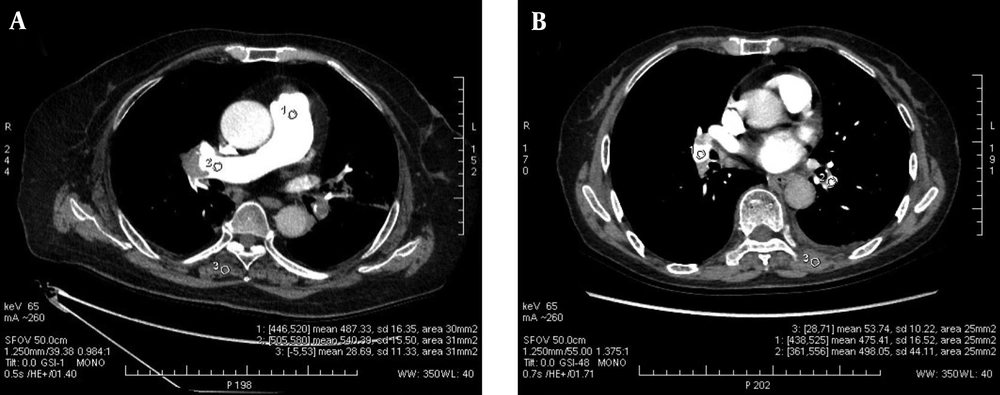
The region-of-interest (ROI) was placed in the lumen of the main pulmonary artery (MPA), the right pulmonary artery (RPA), the left pulmonary artery (LPA), the right lower pulmonary artery (RLPA) and the left lower pulmonary artery (LLPA) as well as the back muscle at the same level of the measured pulmonary artery on the axial sectional images of the five energy levels in each patient by a radiologist with 8 years of experience in cardiovascular diagnosis. CT values and standard deviation (SD), which was used as the noise of images in the ROI were measured. The edge of blood vessels and embolus in vessels were avoided when placing ROI, and measurements were carried out three times on three consecutive levels to obtain an average value, shown in Figure 1.
The signal-to-noise ratio (SNR) and CNR of each pulmonary artery was calculated using the following formulas:
SNR = CT value (pulmonary artery)/SD (pulmonary artery)
CNR = (CT value (pulmonary artery) - CT value (back muscle))/SD (back muscle)
The volumetric CT dose index (CTDIvol) and dose length product (DLP) of each patient were recorded in the dose report, and the effective dose (ED) was calculated using the following formula:
ED = DLP × K (K = 0.014) (12)
3.3.2. Subjective Evaluation
Image quality was evaluated by two experienced radiologists using blind method and 5-point scoring system for the five image groups independently. The two radiologists were not informed about the scan methods of these patients, and the image parameters were not displayed before evaluation. The evaluation criteria are shown in Table 2.
| Score level | Evaluation criterion |
|---|---|
| 5 | Excellent image quality, no obvious noise and artifacts, fully diagnostic. |
| 4 | Good image quality, minor noise and artifacts, fully diagnostic. |
| 3 | Limited image quality, moderate noise and artifacts, still diagnostic. |
| 2 | Suboptimal image quality, obvious noise and artifacts, affecting the diagnosis. |
| 1 | Poor image quality, high noise and severe artifacts, non-diagnostic. |
Abbreviation: CTPA, CT pulmonary angiography.
3.4. Statistical Analysis
The measurements were analyzed by using IBM SPSS® statistics version 25.0. (New York, IBM Corp.), with P < 0.05 indicating statistically significant difference. Continuous variables were expressed as mean ± standard deviation, the subjective score was expressed as median (Q1, Q3). The single sample K-S and Levene’s tests were used to test the goodness of fit and homogeneity of variance of the measurements respectively. The one-way repeated measure ANOVA was used to test the parameters of the five-energy level monochromatic image groups which were consistent with normal distribution and homogeneity of variance, and the parameters that do not satisfy Mauchly’s spherical test were corrected by Greenhouse-Geisser method. The intraclass correlation efficient (ICC) was used to test the repeatability of quantitative data measurements. Weighted-Kappa test was used to evaluate the consistency of subjective scores by the two radiologists, the Kappa or ICC values were defined as follows: > 0.75, excellent agreement; 0.60 - 0.74, good agreement; 0.40 - 0.59, fair agreement; and < 0.40, poor agreement. The subjective scores of the 5-energy level groups were compared by Friedman M non-parametric test. Cochran's Q test was used to compare the frequency of subjective scores greater than 3 in five groups. Correlation analysis was performed by using Pearson or Spearman correlation analysis. Bonferroni method was used to calibrate all variables in the two comparisons.
4. Results
4.1. General Information of Patients and Effective Dose
The average height, weight and body mass index (BMI) of the 30 patients was 1.66 ± 0.08 m, 62.87 ± 10.52 kg and 22.93 ± 3.79 kg.m-2, respectively. The average CTDIvol, DLP and ED was 9.12 ± 3.03 mGy, 264.65 ± 74.81 mGy.cm, and 3.70 ± 1.05 mSv, respectively.
4.2. Objective Parameters of the Monochromatic Images
4.2.1. Comparison of CT Value of Different Energy Levels in Pulmonary Arteries
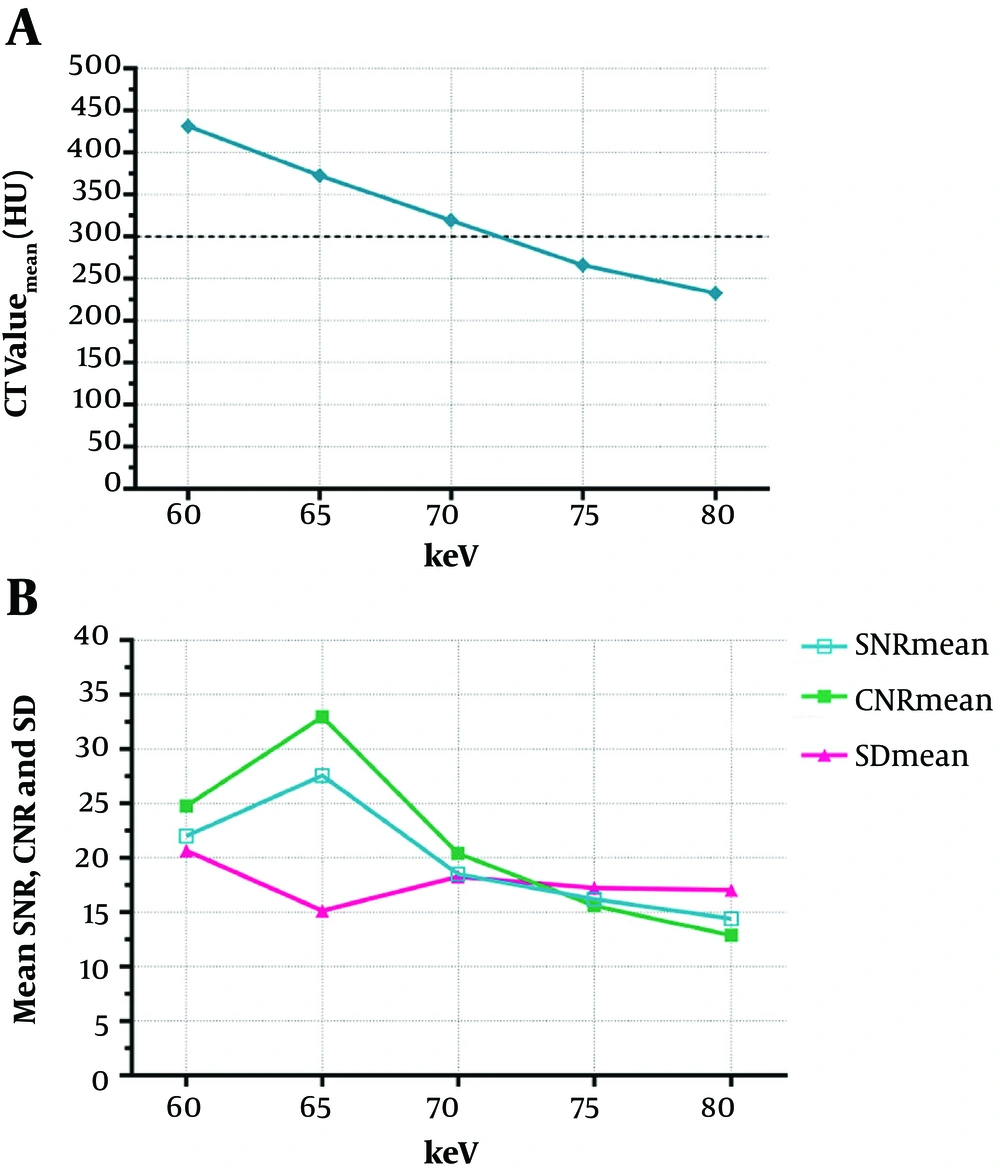
The ICC of the three measurements of pulmonary arteries was 0.985 ± 0.009, all P < 0.001. The CT attenuation values of the pulmonary arteries decreased with the increase of energy level in the five monochromatic image groups from 60 keV to 80 keV, as shown in Figure 2. The mean CT attenuation values of pulmonary arteries at these five energy levels were 431.41 ± 129.04 hounsfield unit (HU), 372.59 ± 112.42 HU, 319.26 ± 92.67 HU, 265.96 ± 75.34 HU and 232.87 ± 65.34 HU, respectively. The difference was statistically significant (F = 180.62, P < 0.001). Among them, the CT attenuation values of 60 keV, 65 keV, and 70 keV images were higher than 300HU, as shown in Table 3.
A, The CT attenuation values of the pulmonary arteries decreased with the increase of energy level in the five monochromatic image groups from 60 keV to 80 keV, and the CT attenuation values of the 60 keV, 65 keV, and 70 keV images were higher than 300 HU; B, The mean SNR and CNR values of the 65 keV monochromatic image were the highest, while the SD value was the lowest among the 5 image groups.(SNR, signal-to-noise ratio; CNR, contrast-to-noise ratio; and SD, standard deviation).
| Pulmonary arteries | 60 keV | 65 keV | 70 keV | 75 keV | 80 keV | F | P |
|---|---|---|---|---|---|---|---|
| MPA, HU | 401.66 ± 133.16 | 346.60 ± 118.21 | 298.69 ± 97.55 | 240.61 ± 90.21 | 213.24 ± 70.82 | 145.90 | < 0.001 |
| RPA, HU | 442.34 ± 139.11 | 390.83 ± 120.59 | 327.68 ± 94.01 | 281.94 ± 79.97 | 246.37 ± 67.15 | 128.29 | < 0.001 |
| LPA, HU | 438.49 ± 142.17 | 380.89 ± 120.41 | 332.51 ± 101.63 | 273.39 ± 76.28 | 239.04 ± 66.95 | 118.01 | < 0.001 |
| RLPA, HU | 432.45 ± 129.50 | 367.17 ± 117.54 | 307.76 ± 94.63 | 259.62 ± 74.38 | 225.16 ± 73.76 | 147.11 | < 0.001 |
| LLPA, HU | 442.12 ± 122.13 | 377.48 ± 107.04 | 329.64 ± 88.70 | 274.25 ± 74.89 | 240.54 ± 66.30 | 197.95 | < 0.001 |
| Mean, HU | 431.41 ± 129.04 | 372.59 ± 112.42 | 319.26 ± 92.67 | 265.96 ± 75.34 | 232.87 ± 65.34 | 180.62 | < 0.001 |
Abbreviations: HU, Hounsfield unit; LLPA, left lower pulmonary artery; LPA, left pulmonary artery; MPA, main pulmonary artery; RLPA, right lower pulmonary artery; RPA, right pulmonary artery; SD, standard deviation.
aValues are expressed as mean ± SD.
b65 keV vs. other keV (adjusted by Bonferroni test): all adjust-P < 0.001 [all differences between 65 keV vs. 60, 70, 75, and 80 keV were statistically significant; P < 0.001].
4.2.2. Comparison of SNR, CNR, and SD
ICC of the three measurements of image noise was 0.847 ± 0.136 (all P < 0.001).
In the five monochromatic image groups from 60 keV to 80 keV, the mean SNR values were 22.02 ± 7.04 HU, 27.57 ± 10.05 HU, 18.52 ± 5.96 HU, 16.21 ± 5.03 HU, and 14.43 ± 4.94 HU respectively, and the differences were statistically significant (F = 62.93, P < 0.001). The mean CNR values were 24.79 ± 11.08 HU, 32.97 ± 14.07 HU, 20.41 ± 8.13 HU, 15.63 ± 5.56 HU, and 12.88 ± 4.81 HU, respectively, and the differences were statistically significant (F = 93.07, P < 0.001). The mean SD values were 20.68 ± 4.78, 15.14 ± 6.06, 18.29 ± 4.94, 17.25 ± 3.66, and 17.03 ± 3.82, respectively, and the differences were also statistically significant (F = 18.20, P < 0.001).
The SNR and CNR values of the 65 keV monochromatic image were the highest, while the SD value was the lowest among the five image groups, paired comparisons are shown in Table 4, which had statistically significant difference (all P < 0.01), as shown in Figures 2 and 3.
| Pulmonary arteries | 60 keV | 65 keV | 70 keV | 75 keV | 80 keV | F | P |
|---|---|---|---|---|---|---|---|
| SNR | |||||||
| MPA | 21.79 ± 8.46b | 26.34 ± 11.58 | 18.50 ± 7.59c | 16.40 ± 7.72c | 14.02 ± 6.10c | 31.99 | < 0.001 |
| RPA | 22.96 ± 8.45d | 28.46 ± 12.22 | 18.29 ± 6.28c | 16.54 ± 5.86c | 14.78 ± 4.44c | 38.98 | < 0.001 |
| LPA | 22.54 ± 9.00d | 27.51 ± 12.27 | 18.93 ± 7.43c | 16.05 ± 5.15c | 14.60 ± 6.62c | 31.04 | < 0.001 |
| RLPA | 20.39 ± 6.38c | 27.20 ± 10.46 | 18.51 ± 6.70c | 15.92 ± 5.00c | 14.24 ± 5.97c | 40.73 | < 0.001 |
| LLPA | 22.43 ± 7.44d | 28.35 ± 11.13 | 18.37 ± 5.65c | 16.12 ± 5.64c | 14.51 ± 4.37c | 41.48 | < 0.001 |
| Mean | 22.02 ± 7.04d | 27.57 ± 10.05 | 18.52 ± 5.96c | 16.21 ± 5.03c | 14.43 ± 4.94c | 62.93 | < 0.001 |
| CNR | |||||||
| MPA | 23.11 ± 10.41c | 29.36 ± 12.48 | 18.22 ± 7.80c | 13.53 ± 6.25c | 10.72 ± 3.94c | 95.04 | < 0.001 |
| RPA | 26.48 ± 12.03c | 35.00 ± 15.61 | 20.93 ± 7.73c | 16.56 ± 5.84c | 13.26 ± 4.37c | 68.49 | < 0.001 |
| LPA | 24.58 ± 12.45c | 33.59 ± 14.80 | 21.54 ± 9.27c | 16.30 ± 5.78c | 14.28 ± 5.66c | 55.29 | < 0.001 |
| RLPA | 24.25 ± 11.36c | 33.23 ± 15.37 | 20.05 ± 9.02c | 15.28 ± 5.68c | 12.37 ± 6.32c | 82.37 | < 0.001 |
| LLPA | 25.55 ± 11.96c | 33.68 ± 15.39 | 21.29 ± 7.93c | 16.46 ± 5.97c | 13.75 ± 6.04c | 72.11 | < 0.001 |
| Mean | 24.79 ± 11.08c | 32.97 ± 14.07 | 20.41 ± 8.13c | 15.63 ± 5.56c | 12.88 ± 4.81c | 93.07 | < 0.001 |
| SD, HU | 20.68 ± 4.78c | 15.14 ± 6.06 | 18.29 ± 4.94c | 17.25 ± 3.66c | 17.03 ± 3.82d | 18.20 | < 0.001 |
Abbreviations: CNR, contrast-to-noise ratio; HU, Hounsfield unit; LLPA, left lower pulmonary artery; LPA, left pulmonary artery; MPA, main pulmonary artery; RLPA, right lower pulmonary artery; RPA, right pulmonary artery; SNR, signal-to-noise ratio; SD, standard deviation.
aValues are expressed as mean ± SD.
b65 keV vs. other keV (adjusted by Bonferroni test) for adjust-P > 0.05.
c65 keV vs. other keV (adjusted by Bonferroni test) for adjust-P < 0.001.
d65 keV vs. other keV (adjusted by Bonferroni test) for adjust-P < 0.05.
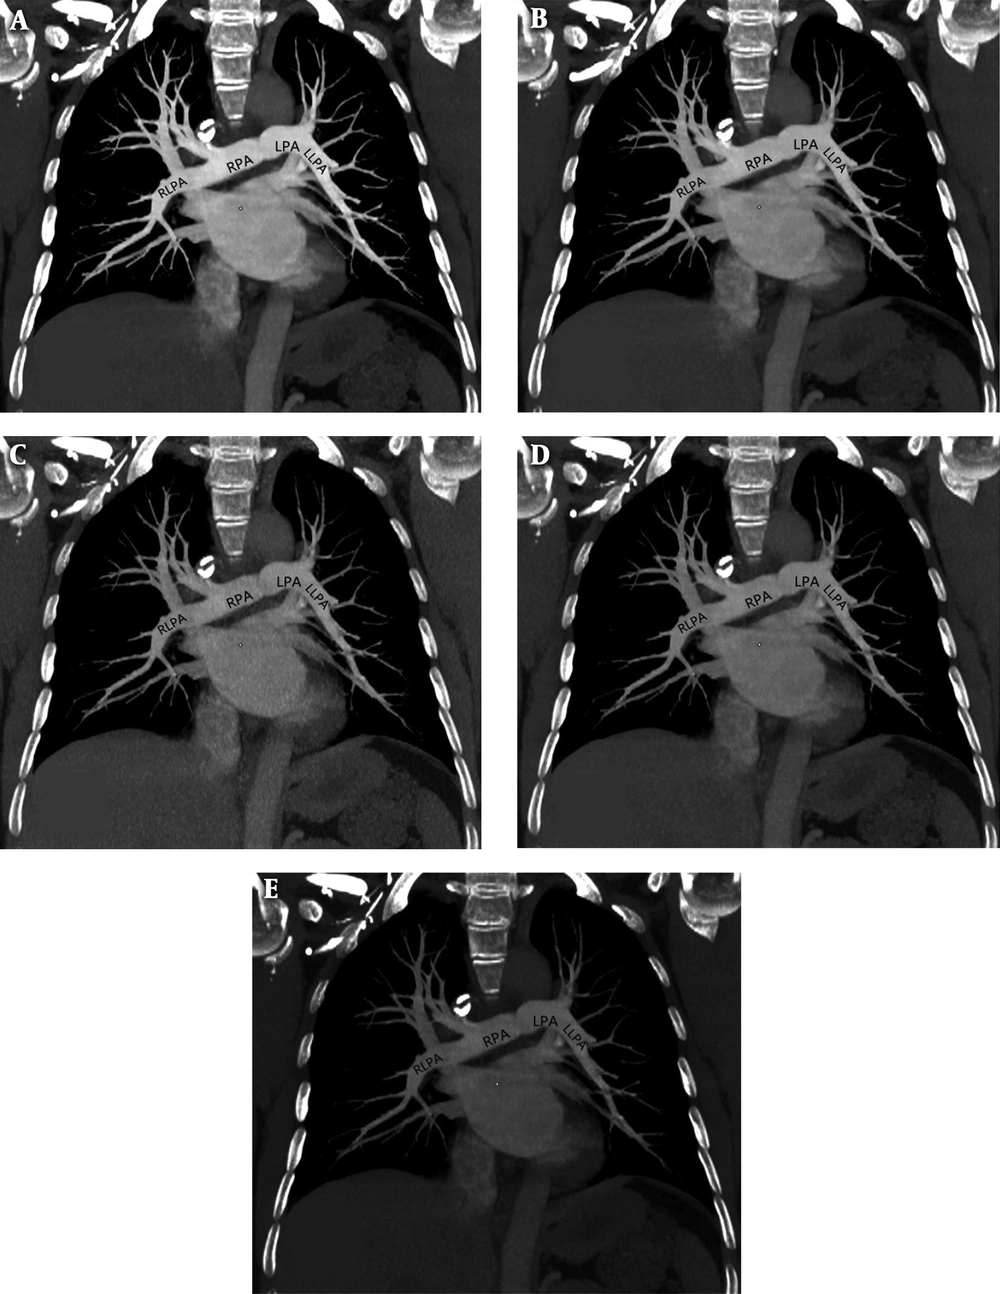
A 48-year-old female, body mass index (BMI) = 21.5 kg.m-2, figures A-E represent 60 keV, 65 keV, 70 keV, 75 keV, and 80 keV monochromatic images, respectively. A, 60 keV: SNR (mean) = 28.71, CNR (mean) = 26.00, SD (mean) = 19.62, subjective score was 5 points; B, 65 keV: SNR (mean) = 31.95, CNR (mean) = 28.77, SD (mean) = 14.32, subjective score was 5 points; C, 70 keV: SNR (mean) = 11.98, CNR (mean) = 10.29, SD (mean) = 28.52, subjective score was 4 points; D, 75 keV: SNR (mean) = 19.53, CNR (mean) = 15.89, SD (mean) = 16.57, subjective score was 4 points; E, 80 keV: SNR (mean) =10.13, CNR (mean) = 7.14, SD (mean) = 15.98, subjective score was 3 points.
4.3. Subjective Evaluation of Each Monochromatic Image
Subjective evaluation of the five monochromatic groups was carried out by two radiologists. The consistency of subjective score was excellent between the two radiologists (Weighted-Kappa = 0.901, P < 0.001), and the subjective score of the 65 keV monochromatic image was higher than the other groups. The percentage of patients with a subjective score more than 3 points was at the highest in the 60 keV and 65 keV images, as shown in Figure 3, Table 5.
aSubjective score is expressed as median (Q1, Q3).
b65 keV vs. other keV (adjusted by Bonferroni test): for adjust-P > 0.05.
c65 keV vs. other keV (adjusted by Bonferroni test): a for adjust-P < 0.001.
dFriedman test statistic.
eCochran’s Q test statistic.
4.4. Correlation Between BMI with CNR and Subjective Score in the 65 keV Monochromatic Image
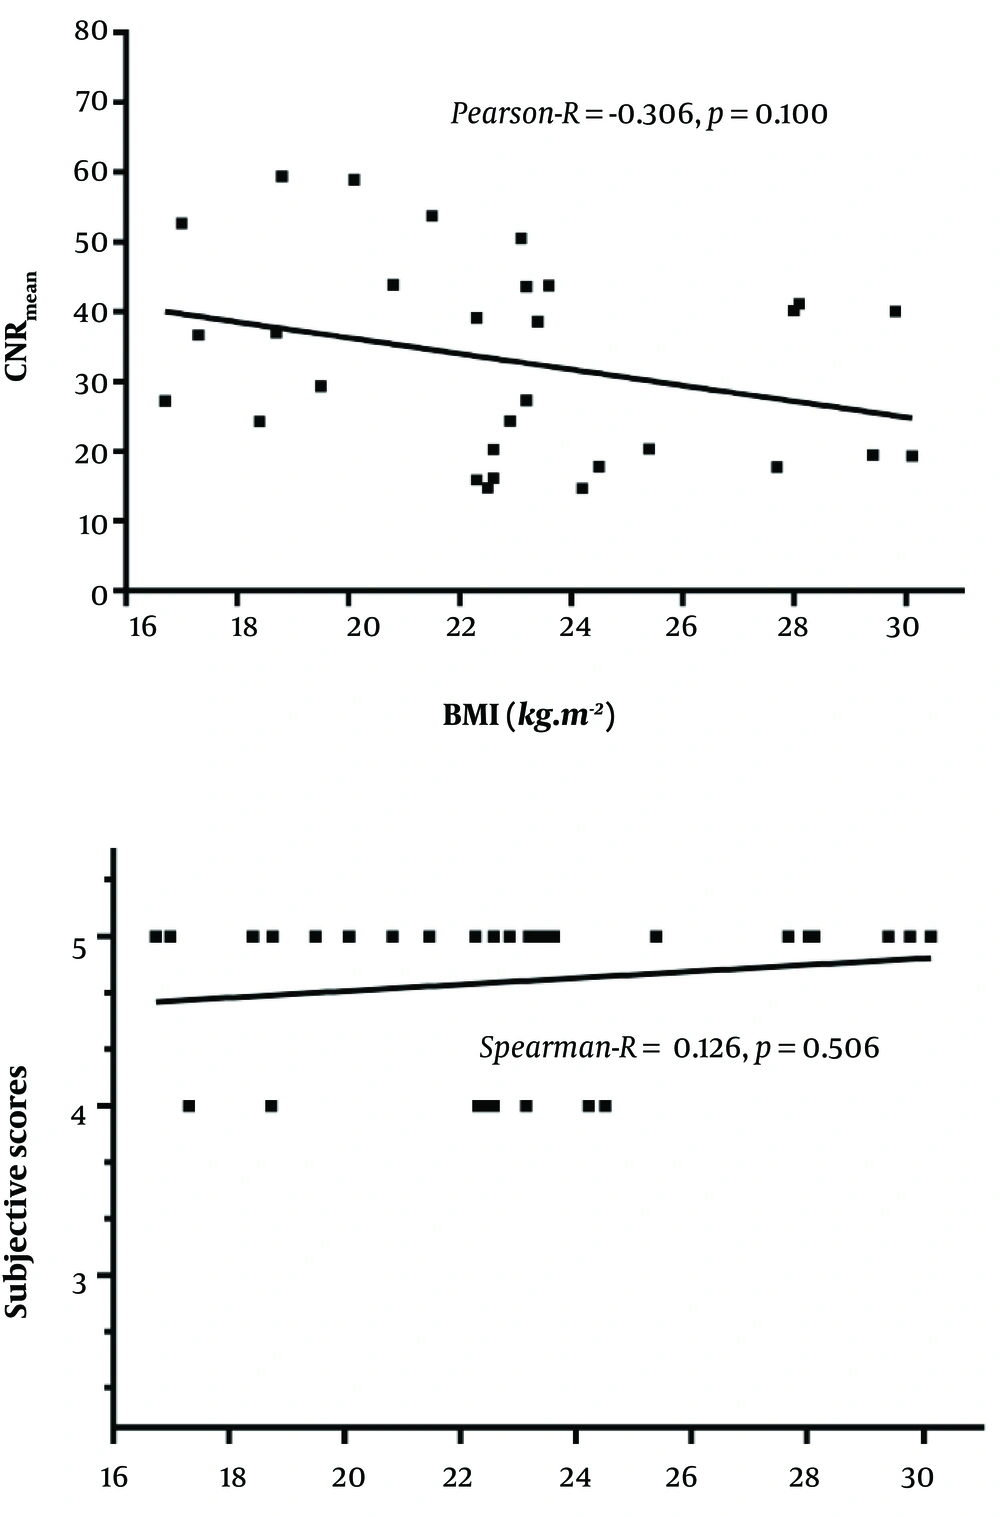
There was no correlation between BMI with CNR and subjective score of the 65 keV monochromatic images, as shown in Figure 4.
BMI vs. CNR (mean), Pearson-R = -0.306, P = 0.100;
BMI vs. subjective scores, Spearman-R = 0.126, P = 0.506.
5. Discussion
The results of our study showed that under the condition of low CM volume (25 mL), CTPA imaging using 65 keV monochromatic images with ASiR algorithm had higher SNR, CNR and lower image noise than other energy levels, providing the best monochromatic level for diagnosing PE.
The researchers are committed to reducing the volume of CM, the purpose of which is to reduce the iodine load of patients and reduce the adverse reaction of CM. Most institutions generally used 80 - 150 mL CM in CTPA in the past (13, 14). However, these CM have not been fully utilized in the contrast enhancement of the pulmonary artery. In recent years, some researchers rely on a variety of progressive techniques and methods, which help to optimize the CM volume (13, 15-19). The research conducted by Wu et al. (20) showed that the CTPA image quality and diagnostic requirements are not affected when using 30 mL CM. Lu et al. (21) even pushed the CM volume down to 20 mL when conducting CTPA researches, and showed that the diagnostic images could also be obtained in the normal weight population.
The dual-energy spectral CT imaging mode in our study uses single source and rapid switching between high and low voltages (140 kVp/80 kVp) in 0.5 milliseconds to provide coherent dual-energy information at similar radiation dose as conventional CT scan modes. The dual-energy spectral CT reconstructs virtual monochromatic images with different energy levels from 40 keV to 140 keV, simulating the imaging under different monochromatic X-ray sources (22, 23). Compared with conventional CT images, the virtual monochromatic images generally have better image quality, higher SNR and CNR (24, 25). The model experimental study conducted by Matsumoto et al. (26) showed that the 70 keV monochromatic images had higher CNR and lower noise compared with the polychromatic 120 kVp images with similar radiation dose. The monochromatic images with lower energy levels can improve the density resolution of the images, which also helps to improve the CT value of the substance being tested, but the image noise increased at the same time, while the high-energy level images have lower CT attenuation values, lower contrast ratio and lower noise. Therefore, selecting an appropriate energy level, to balance the enhancement degree and the image noise of pulmonary arteries is the key to ensure the PE diagnosis and improve the image quality.
Previous studies (27) have indicated that the optimal monochromatic energy levels of observing pulmonary thrombosis with spectral CTPA are 65 – 70 keV, of which the images have the lowest noise and higher CNR. The study conducted by Apfaltrer et al. (28) showed that the optimal monochromatic energy level of pulmonary arteries was 70 keV when using dual-energy CT for CTPA examination. Ohana et al. (29), who studied the influence of iterative reconstruction algorithm on image quality, measured the quantitative parameters of pulmonary artery on 65 keV monochromatic images. However, the authors did not explain the reasons for using 65 keV monochromatic images in the article. All of the above studies were under the conditions of normal CM dosage (80 - 100 mL), and the optimal monochromatic energy level of CTPA in the diagnosis of PE was rarely reported when using low CM volume. Yuan et al. (3) in the case of iodine load decreased by 40.2%, selected the 50 keV virtual monochromatic images to measure the parameters of pulmonary arteries only by the preliminary experience and the manufacturer’s recommendations, which lacked objective basis. The purpose of our study was to investigate the feasibility and the optimal monochromatic energy level in the diagnosis of PE when using dual-energy spectral CTPA with low CM volume (25 mL).
There is no universal standard of pulmonary artery enhancement in the diagnosis of PE at present. Multiple studies (2, 3, 30, 31) showed that the minimum CT value in pulmonary arteries was 290 ± 83 HU and 362 ± 98 HU respectively in the diagnosis of acute and chronic PE. The results of our study showed that the average CT attenuation values of the pulmonary arteries were more than 300 HU on the 60 - 70 keV monochromatic images, which could meet the diagnostic requirements for PE, among which the 65 keV monochromatic images had the highest SNR and CNR as well as the lowest image noise. Therefore, we confirmed that the optimal monochromatic energy level in dual-energy spectral CTPA was 65 keV when using low CM dosage.
In our study, the ASiR algorithm was used in the dual-energy spectral CTPA image reconstructions instead of the more traditional filtered back-projection reconstruction. The study conducted by Ohana et al. (29) showed that the ASiR algorithm provided good image quality in dual-energy spectral CTPA in low radiation dose condition. In our study, we used ASiR to reduce the image noise which was more prominent at the low energy levels to fully take advantage of the improved attenuation at lower energy levels to further optimize image quality.
ASiR provides 0% - 100% weights for different clinical needs, the higher the percentage of ASiR, the lower the image noise, and the smoother the images. At high ASiR percentages the image sharpness, spatial resolution and image quality may be reduced. Previous studies have shown that the spatial resolution and image noise could be balanced at approximately 40% - 50% ASiR (maintain image spatial resolution while reducing noise) (32). We selected the 50% ASiR weights used by other researchers in abdominal low-dose CT scans (33) and portal vein imaging studies (34, 35). This was also the most commonly used weight in our daily work.
CM passes through the superior vena cava into the right heart and then goes directly to the branches of the pulmonary artery from the right heart without systemic circulation in CTPA. Therefore, some authors believe that BMI has little effect on the use of CM dose in patients with CTPA. Our study also did not personalize CM dose based on patient’s BMI. Our results indicated that there was no correlation between BMI with CNR and subjective scores of the 65 keV monochromatic images, similar to the results of Wu et al. (20).
The ideal CTPA scan should collect data when the pulmonary artery is adequately enhanced, while the pulmonary vein is not enhanced, but the time window is very narrow, only 2 - 3 seconds. The bolus tracking (BT) technique commonly used at present is influenced by scanning experience, individual circulatory differences in patients and equipment. There is no uniform standard for the trigger threshold, monitoring point and start scan delay time, and it is more difficult to grasp the scan delay time when the dosage of contrast agent is low. In our study, a test bolus (TB) technique was used. The basic principle is to inject a small dose of contrast agent (8 mL in our study) before the formal scan. The time-density curve of pulmonary arterial enhancement was obtained, and the peak time of pulmonary arterial enhancement was obtained individually and accurately. Then a normal contrast dose (25 mL in our study) for pulmonary artery imaging was injected to trigger the scanning at this time point to optimize pulmonary artery enhancement. The reason for adding 2 seconds to the peak enhancement time of TB in our study was that the peak enhancement time of contrast agent (25 mL) used for pulmonary artery imaging was usually delayed by 2 seconds. The advantage of TB was that it can reliably and accurately predict the peak time of pulmonary artery enhancement and eliminate the influence of individual differences, especially for patients with unstable hemodynamics (36, 37). The downside of TB was that additional small doses of CM and scanning were used before CTPA.
Some researchers compared the effects of the two monitoring methods on CTPA: Moradi and Khalili (38) showed that the two monitoring methods had no effect on the enhancement of pulmonary arteries in both groups (P > 0.05), while the incidence of artifacts in TB group was lower than that in BT group (11.5% vs. 26.9%), but there was no significant difference (P = 0.159), and the results were consistent with the study carried out by Henzler et al. (39) and Johnson et al. (40). However, other studies have shown that pulmonary artery enhancement was higher in TB group (41). For example, Sucklings et al. (42) showed that pulmonary artery enhancement in the TB group was higher than that in the BT group (mean CT value was 396.24 ± 22.34 HU vs. 329.33 ± 20.92 HU, P < 0.01). However, in Suchling’s study, the authors increased the injection rate of contrast agent from 4.0 mL/s to 4.5 mL/s in TB group, and the iodine flow rate increased accordingly, which may be the cause of higher enhancement in TB group. However, the standard deviation and range of CT value of pulmonary artery in TB group were larger, so the authors considered that the enhancement of pulmonary artery by BT technique was more uniform, which was similar to the results of in coronary CTA study performed by Cademartiri et al. (43) Rodrigues et al. (41) further analyzed the data of smaller patients with lower tube voltage (100 kV) and found that there was no significant difference in pulmonary artery enhancement between the two monitoring methods. All the above studies were based on the conventional dosage of CM. Kerl et al. (44) compared two monitoring methods at low CM dosage (50 mL). The results showed that good pulmonary enhancement and high-quality images could be obtained in both TB and BT groups. There was no significant difference in pulmonary enhancement between the two groups (P > 0.05). The reason for choosing TB in our study was to evaluate the peak enhancement of pulmonary artery more accurately.
There were limitations in this study. First, there was only one case of PE in the group. Second, the scanning parameters were not personalized according to BMI of each patient. Third, the lower monochromatic energy images were not reconstructed and the reason was due to the software limitation of our first generation dual-energy CT scanner that the images below 60 keV (such as 40 - 60 keV) could not be reconstructed using ASiR algorithm on our CT system. Finally, even though iodine-based images in the dual-energy spectral CTPA can provide perfusion information in the lung parenchyma, this information was not analyzed since this study was aimed at exploring the feasibility of low CM volume in CTPA.
In conclusion, the 65 keV monochromatic images provide the highest SNR, CNR and subjective score with the lowest image noise in the dual-energy spectral CT pulmonary angiography with low contrast dosage.
