1. Background
Multiple sclerosis (MS) is a chronic inflammatory disease of the nervous system that causes demyelination of the white and grey matter in both the brain and the spinal cord. This is the most common reason of neurological deficit of the nervous system in young people around the world. MS comprises 1.14% of the reported nervous system diseases (1-3).
Lesions in the cervical spine are usually together with brain lesions. In 15 to 20 percent of the cases, without observing brain lesions, the lesion could be seen in the cervical spine. According to McDonald criteria, it is important to observe cervical plaques in MS patients because this rules out other diseases. Besides, there is a direct relationship between cervical lesions and patient disability. Therefore, both for accurate MS detection and prognosis of the disease period, delineation of the cervical lesions is crucial (3, 4).
According to epidemiologic studies were done, in 70% of MS patients, the cervical spine is involved. Spinal (cervical, thoracic or lumbar) MS lesions show low enhancement in MRI with contrast and rarely demonstrate high enhancement compared to brain plaques. Therefore, sequences without contrast have an important role in the diagnosis of these lesions (1, 5).
Magnetic resonance imaging is a valuable tool to provide information about the lesions including number, location, and inflammation. Multiple MRI sequences have been developed to improve visualization of MS lesions (6, 7). Common sequences for detection of plaques in the cervical spine include T2 weighted (T2W) and short tau inversion recovery (STIR) that usually have high sensitivity for delineation of inflammatory lesions. Based on the similarity between MS plaques and other inflammatory lesions, and the fact that artifacts in the cervical are more likely to happen especially due to motion artifact from heart movement, breathing, swallowing and also blood circulation in the large vessels in the neck region. Therefore, using optimized and advanced sequences to increase the conspicuity of images and improve the diagnostic accuracy is necessary (8, 9).
Recent studies that have been carried out on phase sensitive inversion recovery (PSIR) sequence in depicting lesions in the cortex and white brain matter show the impressive role of PSIR sequence in exposing more plaques and brain involvement in MS patients compared to routine sequences (10-12). So far, there have not been many studies that have evaluated the role of PSIR sequence in the assessment of MS lesions of the cervical spine. Regarding the characteristics of PSIR sequence in differentiating between lesions and the normal brain and spine parenchyma (13), it seems that utilizing this sequence may be beneficial in detecting MS plaques in the cervical spine.
2. Objectives
In this study, PSIR sequence was compared with other conventional sequences (T2W, STIR) regarding the number and conspicuity of the lesions. Whether PSIR sequence could improve the diagnostic accuracy for cervical plaques in MS patients was assessed.
3. Patients and Methods
3.1. Study Population
Thirty five (eight male and 27 female) MS patients (age, 18 - 50 years; mean, 35 years) who were randomly introduced by a neurologist to the MRI center for cervical MRI scans were enrolled in the study. Twenty-two of these patients were relapsing-remitting multiple sclerosis (RRMS), 10 were secondary-progressive MS (SPMS) and three were primary-progressive MS (PPMS). We excluded patients with contraindications to MRI examination (e.g., aneurysmal clips and cardiac pacemakers), claustrophobic patients, and patients whom their final diagnosis was not multiple sclerosis. Cases with technical problems in image acquisition that would ruin the whole image quality were excluded from the study.
3.2. Ethics Issues
All steps of the imaging procedure and the role of this complementary and important sequence were explained to the patients. Written informed consent was obtained from all patients. The ethics committee approved the study and we took the institutional review board approval before the study.
3.3. MRI Imaging Acquisition
All MRI studies were performed on a 1.5T MR imaging scanner (symphony; Siemens, Erlangen, Germany). The imaging protocol included sagittal (T2W TSE, STIR, PSIR) and axial (T2W TSE, PSIR) images. Image parameters are demonstrated in Table 1. No contrast injection and sedation or anesthesia was required. The patients were examined in supine, head-first position with a special head-neck coil. In order to prevent movement of the patient’s head and neck, special stabilizer pads were used. First, routine imaging of the cervical spine and then axial and sagittal planes with T2 weighted Turbo spin echo (T2W TSE), STIR and PSIR sequences were performed. All sequence steps were similar and characteristic parameters including field of view (FOV), matrix, voxel size and thickness was done equal slices.
| Sequence | Plane | FOV, mm | Matrix | Thickness, mm | Phase direction | TR, ms | TE, ms | TI, ms | No. of signals acquired | Acquisition time, min:sec |
|---|---|---|---|---|---|---|---|---|---|---|
| PSIR | Sagittal | 240 | 320 × 256 | 3 | A-P | 2200 | 10 | 400 | 2 | 2:53 |
| STIR | Sagittal | 240 | 320 × 256 | 3 | A-P | 3000 | 13 | 150 | 2 | 1:39 |
| T2W TSE | Sagittal | 240 | 320 × 256 | 3 | A-P | 2800 | 120 | - | 3 | 2:03 |
| PSIR | Axial | 220 | 320 × 256 | 4 | A-P | 2900 | 10 | 400 | 2 | 3:40 |
| T2W TSE | Axial | 220 | 320 × 256 | 4 | A-P | 3500 | 120 | - | 3 | 2:37 |
Abbreviations: A, anterior; FOV, field of view; P, posterior; PSIR, phase sensitive inversion recovery; STIR, short tau inversion recovery; TE, echo time; TI, inversion time; TR, repetition time; TSE, turbo spin echo
According to the inherent characteristic of PSIR sequence that is based on sensitivity to phase protons to produce images. As a result, its grayscale criteria has a bigger amplitude. This means that a bigger amplitude of black, white and grey colors is assigned to each pixel according to the received signal intensity. Therefore, differences between the signals of every pixel finally lead to reconstruction of images and increases their resolution and contrast (14).
3.4. Image Analysis
All images were analyzed by a neuroradiologist. The reader was blinded to any image identification, and to the patients’ clinical data. Patients’ names were covered. In addition, we randomly ordered the image assessments; i.e., different sequences of patients were not assessed successively. For example, the reviewer assessed the STIR of patient 10, then assessed the PSIR of patient 16.
In the sagittal plane, T2W TSE, STIR, and PSIR, and in the axial plane, T2W TSE and PSIR were compared. All plaques that existed between vertebrae C2 and T3 were evaluated.
3.4.1. Number of Lesions
In each sequence, the number of plaques were defined for each patient and then the sequences were compared in order to determine which sequence shows a higher plaque count.
3.4.2. Lesion Conspicuity
Assessing the resolution of the lesion is considered as detecting the lesion and differentiating it from the surrounding normal tissue that could be assessed qualitatively by a neuroradiologist. For assessment of sequence imaging quality, we asked the neuroradiologist to rate the conspicuity of each lesion subjectively based on his previous experience in a three level scale of good, moderate and poor. If all the patient’s lesions showed good conspicuity, the imaging conspicuity was rated as good and if at least one lesion was rated as moderate or poor, then the imaging conspicuity was rated as moderate or poor, respectively.
3.5. Statistical Analysis
Non parametric dependent methods (Friedman & Wilcoxon tests) were used for comparing the number of plaques and contrast of the plaques between different sequences. These were calculated separately in both sagittal and axial planes and were expressed as singular-value decomposition (SVD), Mean and Median. The Statistical Package for Social Sciences version 24 (IBM Corp. Released 2016. IBM SPSS Statistics for Windows, Version 24.0. Armonk, NY: IBM Corp) was used for statistical analysis. P value less than 0.05 was considered significant.
4. Results
Totally, 35 patients were enrolled in the study. The mean age of the patients was 35 years (range: 18 - 50) and 30 (85%) were female. For all patients, sagittal and axial views were obtained. The STIR sequence was not conducted in axial view images. To compare the sequences, we performed the analyses in sagittal and axial views separately (in patients with axial view, we had the data on T2W TSE and PSIR sequences and the comparisons were done between these two sequences, but in sagittal view MRIs, all three sequences were compared).
4.1. Sagittal View
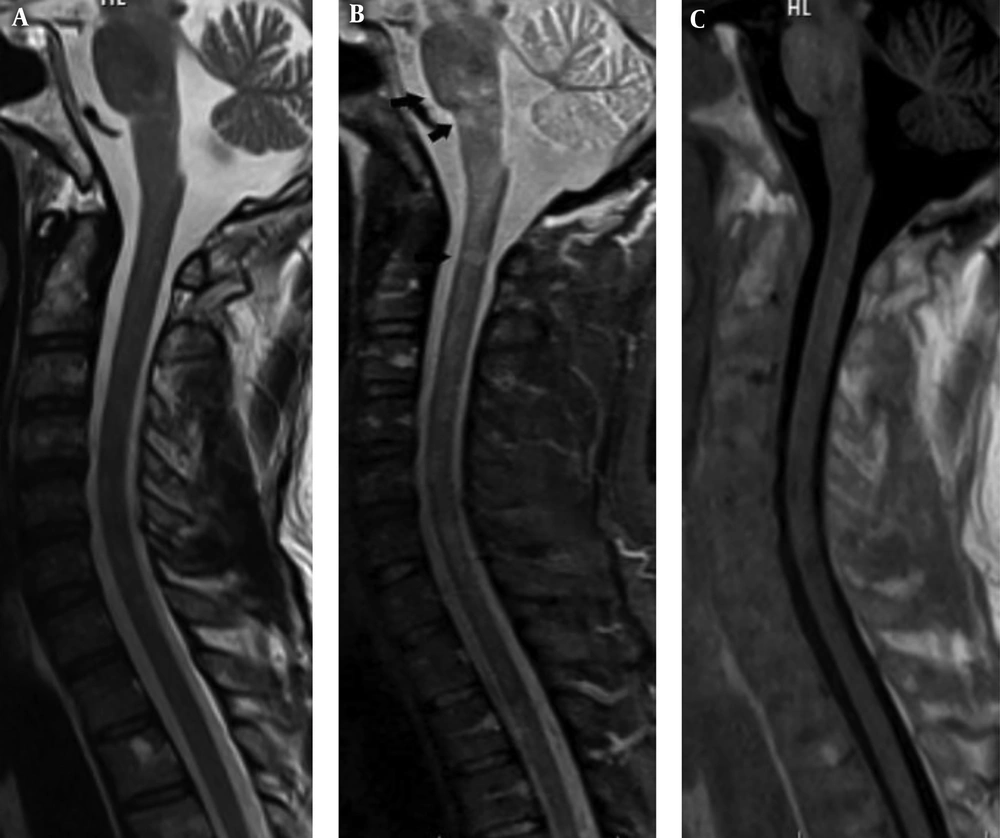
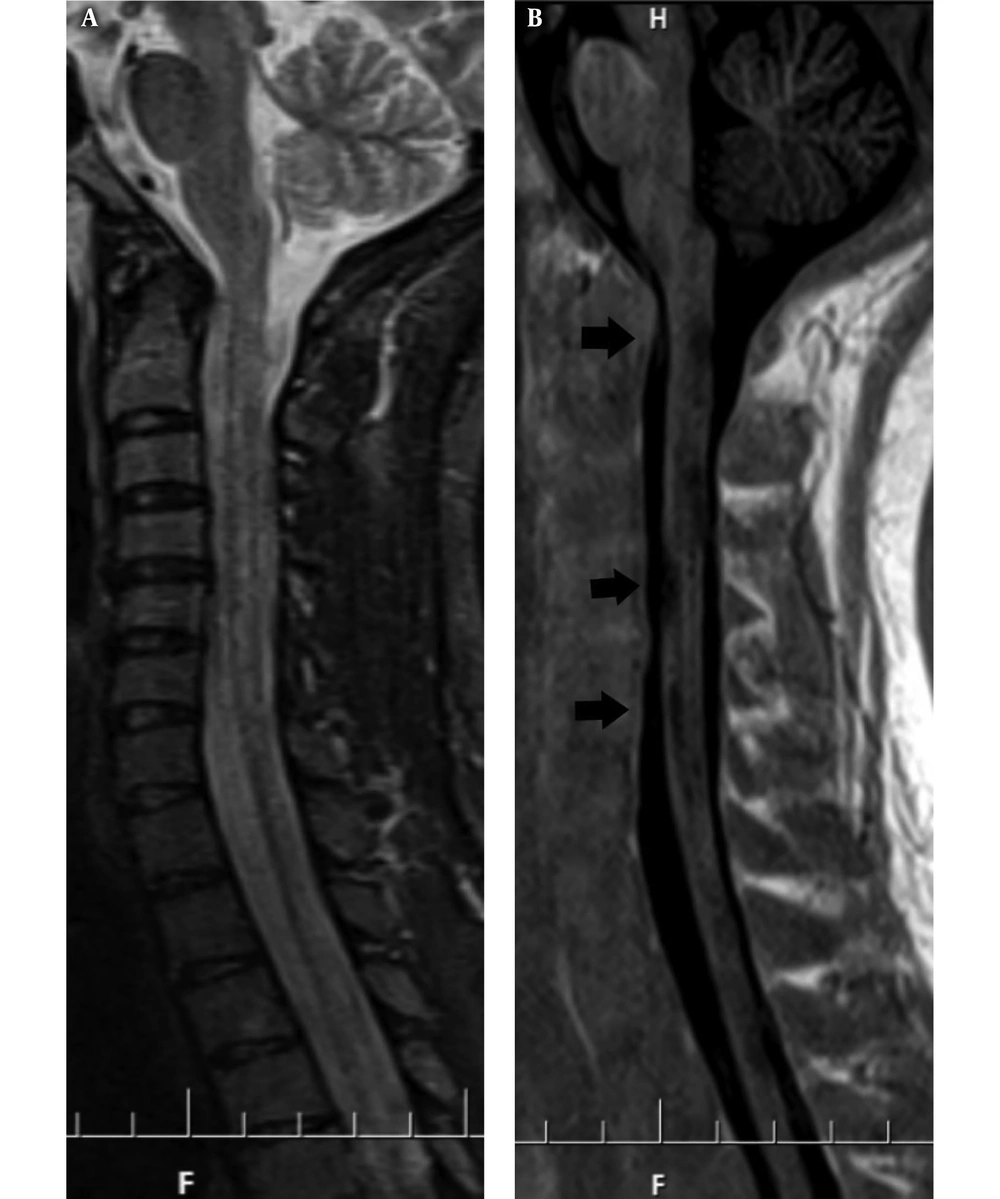
In sagittal view MRIs, the mean plaque number in T2W TSE, STIR and PSIR were 1.7 ± 1.1 (range: 0 - 4), 3.5 ± 1.4 (range: 1 - 8), and 3.4 ± 1.4 (range: 1 - 7), respectively (P < 0.001). Among 35 patients, two had a similar plaque number in PSIR and T2W TSE (5.7%), while the other 33 patients showed more plaques in PSIR compared to T2W TSE (94.3%; mean difference of plaque number, 1.7 ± 08; range, 0 - 3). Comparing STIR and T2W TSE showed a similar profile in which two had a similar plaque number in STIR and T2W TSE (4.7%), while the other 33 patients showed more plaques in STIR compared to T2W TSE (94.3%; mean difference of plaque number, 1.9 ± 1; range, 0 - 5). Comparing two sequences of PSIR and STIR showed 17 patients had an equal plaque number in two sequences (48.6%), 12 showed more plaques in STIR (34.3%) (Figure 1) and six showed more plaques in PSIR (17.1%) (Figure 2). The mean difference of plaque number was 0.2 ± 0.9 (range -2 - 2) (Table 2). Pairwise comparison between these three sequences showed statistically higher plaques in STIR and PSIR sequences in comparison to T2W TSE (both Ps < 0.001), while the difference between PSIR and STIR was not statistically significant (P = 0.3) (Table 2). Intra-class correlation coefficient (ICC) of three sequences for plaque number was 0.89 (95% confidence interval [CI] = 0.81 - 0.94, P < 0.001).
A 32-year-old woman with relapsing remitting multiple sclerosis (RRMS) who had a neurological attack. Sagittal images in T2 weighted turbo spin echo (T2W TSE) (A), short tau inversion recovery (STIR) (B) and phase sensitive inversion recovery (PSIR) (C) sequences have been shown. The patient has plaques in the pons, medulla oblongata and at the level of C2 that are not visible on PSIR and T2W TSE images, while it is delineated in STIR sequence (black arrows). Note the better lesion count in STIR compared to other sequences in this case.
A 28-year-old female patient who is a known case of relapsing remitting multiple sclerosis (RRMS) on follow up. Sagittal short tau inversion recovery (STIR) image shows subtle high signal intensity (dirty white matter) without delineation local lesions at the cord (A). Sagittal phase sensitive inversion recovery (PSIR) shows multiple local hypointense lesions at the level of C2 - T2 (black arrows) (B). The lesions could be seen in a poor conspicuity in STIR, while in PSIR, it is better detected.
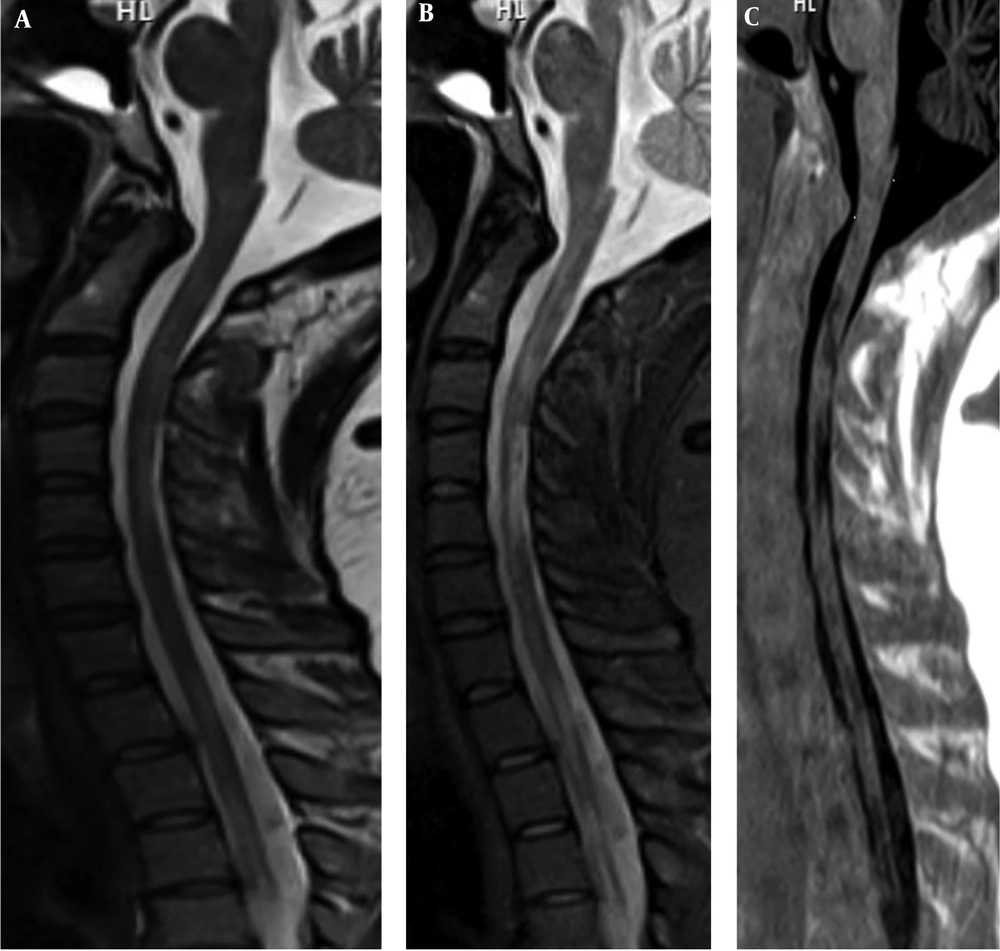
Regarding comparison of imaging conspicuity of plaques between these three sequences in the sagittal view, as we could not show any plaque in T2W TSE in three patients, there were 32 patients to simultaneously compare these three sequences between. We classified the plaque conspicuity in three situations of poor, moderate and good and encoded them as 1 - 3 in an ordinal variable. Statistical analysis of conspicuity showed a significant difference between these three sequences (P < 0.001). Comparing two sequences of PSIR and T2W TSE showed that two patients had similar imaging conspicuity (6.3%). These two patients showed similar plaque number in these two sequences, while the other 30 patients showed better imaging conspicuity in PSIR than T2W TSE (93.7%). Comparing two sequences of STIR and T2W TSE showed one patient had better conspicuity in T2W TSE (3.1%), four patients showed similar imaging conspicuity (12.5%), and 27 patients showed better conspicuity in STIR than T2W TSE (84.4%). Comparing the image conspicuity between PSIR and STIR showed two patients had better conspicuity in STIR (6.3%), 10 patients showed similar conspicuity in both sequences (31.3%), and 20 patients had better conspicuity in PSIR than STIR (62.5%). The best imaging conspicuity was seen in PSIR and the lowest conspicuity was seen in T2W TSE (Figure 3). The imaging conspicuity of STIR sequence was better than T2W TSE, while it was lower than PSIR in all pairwise comparisons. P values were ≤ 0.001 (Table 3).
A 32-year-old male patient with secondary progressive multiple sclerosis (SPMS) who presented with tingling, numbness and weakness of both lower limbs. Sagittal T2 weighted turbo spin echo (T2W TSE) (A), short tau inversion recovery (STIR) (B) and phase sensitive inversion recovery (PSIR) (C) images show multiple MS plaques extending from C2 to T3. They display bright signal intensity (SI) on T2W TSE and STIR and low SI on PSIR. Note that lesions have more conspicuity in PSIR than STIR and T2 W images.
| Plaque number | Mean ± SD of plaque No. | Range | Total plaque counts in all patients | Comparison of plaque number | ||||||
|---|---|---|---|---|---|---|---|---|---|---|
| All three sequences | PSIR vs. T2W TSE | STIR vs. T2W TSE | PSIR vs. STIR | |||||||
| P | Mean difference | P | Mean difference | P | Mean difference | P | ||||
| T2W TSE | 1.7 ± 1.1 | 0 - 4 | 59 | < 0.001 | 1.7 | < 0.001 | 1.9 | < 0.001 | 0.2 | 0.3 |
| STIR | 3.5 ± 1.4 | 1 - 8 | 124 | |||||||
| PSIR | 3.4 ± 1.4 | 1 - 7 | 118 | |||||||
Abbreviations: PSIR, phase sensitive inversion recovery; SD, standard deviation; STIR, short tau inversion recovery; TSE, turbo spin echo.
| Imaging conspicuity | No. (%) | Comparison of plaque imaging conspicuity (P values) | |||
|---|---|---|---|---|---|
| All three sequences | PSIR vs. T2W TSE | STIR vs. T2W TSE | PSIR vs. STIR | ||
| T2W TSE | |||||
| Poor | 29 (90.6) | < 0.001 | < 0.001 | < 0.001 | < 0.001 |
| Moderate | 3 (9.4) | ||||
| Good | 0 | ||||
| STIR | |||||
| Poor | 3 (9.4) | ||||
| Moderate | 23 (71.9) | ||||
| Good | 6 (18.8) | ||||
| PSIR | |||||
| Poor | 1 (3.1) | ||||
| Moderate | 7 (21.9) | ||||
| Good | 24 (75) | ||||
Abbreviations: PSIR, phase sensitive inversion recovery; SD, standard deviation; STIR, short tau inversion recovery; TSE, turbo spin echo.
aPSIR conspicuity better than STIR and T2W TSE, STIR conspicuity better than T2W TSE
4.2. Axial View
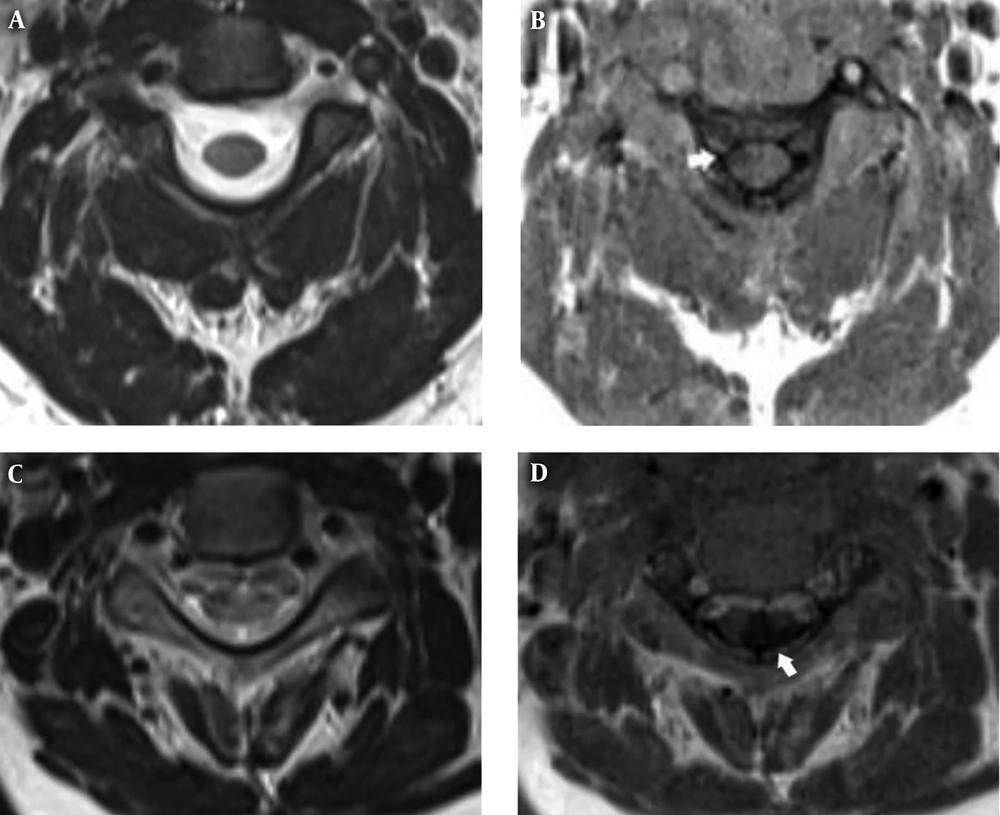
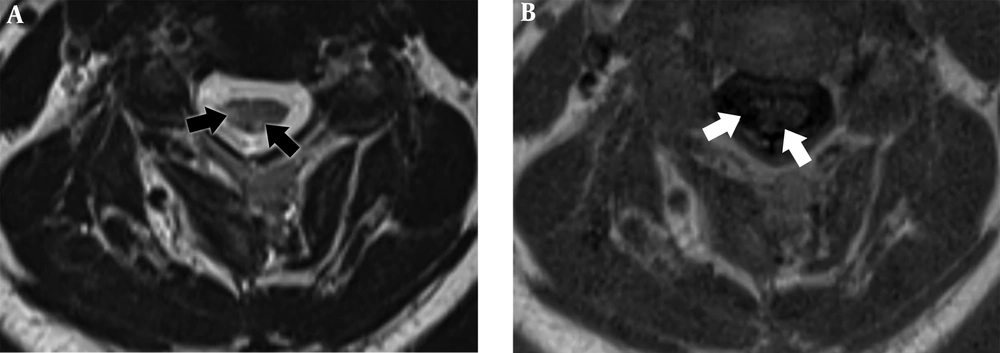
In axial view MRIs, the mean plaque number in T2W TSE and PSIR were 2.4 ± 2.1 (range: 1 - 10) and 3.7 ± 2.5 (range: 1 - 12) respectively (P < 0.001). Totally, 26 patients showed more plaque in PSIR than T2w TSE (74.3%) (Figure 4) while the other 9 patients showed similar plaques in T2w TSE and PSIR sequences (25.7%) (mean difference of plaque number was 1.3 ± 1; range 0 - 3). Regarding comparison of image conspicuity between these two sequences, the conspicuity of PSIR was better than T2w TSE (P < 0.001) (Figure 5) and in fact, in 30 patients the conspicuity of PSIR was better (85.7%) while in 5 patients, qualities were similar in both sequences (14.3%) (Table 4). Intra-class correlation coefficient (ICC) of two sequences for plaque number was -0.14 (95% CI = -1.3 - 0.42, P = 0.65).
A 36-year-old woman with relapsing-remitting multiple sclerosis (RRMS) and upper extremity weakness (A and B). A 32-year-old man with secondary-progressive MS (SPMS) and upper and lower extremity paresthesia (C and D). Axial T2 weighted turbo spin echo (T2W TSE) (A and C). Axial phase sensitive inversion recovery (PSIR) (B and D). MS plaques are seen in PSIR sequence (white arrows) (B and D). No sign of plaques is detected in T2W TSE (A and C).
A 42-year-old patient with relapsing remitting multiple sclerosis (RRMS). Axial T2 weighted turbo spin echo (T2W TSE) (A). Axial phase sensitive inversion recovery (PSIR) (B). In both images, two plaques are seen in the cervical/spine. The lesion is clearer, the border is clear and differentiation between the lesion and the normal tissue is better in the PSIR sequence (white arrows) compared to T2W TSE (black arrows).
| Plaque number | Imaging conspicuity, No. (%) | ||||||||
|---|---|---|---|---|---|---|---|---|---|
| Mean ± SD | Range | Total plaque counts in all patients | Mean difference | P value | Poor | Moderate | Good | P value | |
| T2W TSE | 2.4 ± 2.1 | 1 - 10 | 83 | 1.3 ± 1 | 0.004 | 23 (65.7) | 12 (34.3) | 0 | < 0.001a |
| PSIR | 3.7 ± 2.5 | 1 - 12 | 126 | 0 | 13 (37.1) | 22 (62.9) | |||
Abbreviations: PSIR, phase sensitive inversion recovery; SD, standard deviation; TSE, turbo spin echo.
aPSIR conspicuity better than T2W TSE.
All statistical analyses were repeated in RR and SP MS subtypes. There were no differences in the statistical difference pattern in various MS subtypes. Analysis in PP subgroup was not performed because the sample size in this subgroup was three, which was too small for statistical analysis.
5. Discussion
Nowadays, despite development of MRI diagnostic techniques including magnetic resonance spectroscopy (MRS) and diffusion tensor imaging (DTI) in MS patients, routine MRI sequences have the key role in the diagnosis of MS and clinically isolated syndrome (CIS) (15).
STIR sequence is more sensitive in representing cervical plaques compared to routine sequences because of the steady fat signal suppression. The new MRI imaging sequence (PSIR) that acts based on reconstruction of phase sensitivity that eliminates cerebrospinal fluid (CSF) signals has been mentioned in new studies as a highly sensitive technique for delineation of cervical lesions in MS patients (16, 17).
Demyelinating diseases refer to a group of disorders of the nervous system that are significant as a result of the high prevalence and severe disability of this disease. Multiple sclerosis disease as the most common disease in this group leads to decrease in the patient’s ability and causes other problems for the patient. Early diagnosis and treatment of the disease is important. MRI as the diagnostic tool has a significant role in the early diagnosis of this disease (18, 19).
In the past, MRI was only performed on the brain of MS patients. Therefore, in many cases with neurological disorders, the brain was normal and no plaques were detected. Consequently, the spine, specifically the cervical spine was evaluated in suspicious patients with clinical symptoms. It was concluded that in many patients, the neurological deficit was related to cervical lesions. Cervical lesions are mostly difficult to detect because of their small size and the low contrast between the lesion and the surrounding normal tissue. Cervical plaques have direct correlation with motor and sensory activity of the upper and lower extremity and also the speed of processing and transforming orders from the brain to other organs of the body (1, 20). So, the number and size of the detected plaques could be used as a marker for assessing the progress and activity of the disease.
Current MRI sequences that are used to evaluate lesions in the cervical spine include STIR, T2W and T1W before and after injection. These sequences were not able to diagnose and define all lesions (20). A lot of effort was made to improve and develop sequences. Recently, T1W PSIR has been suggested for detection of cervical spine lesions and studies have been carried out on this issue (16, 17).
In this study, cervical imaging was performed with PSIR, STIR, and T2W TSE sequences and comparison between the number of plaques and conspicuity of the plaques was calculated and analyzed separately for all patients in every sequence. This study was carried out in two planes; sagittal and axial, with comparison and analysis for each plane separately.
In this study, in the STIR sequence, we observed more plaques in the cervical region in the sagittal plane compared to PSIR, and T2W TSE. These findings were similar to the study conducted by Leon et al. In their study, in detecting cervical and thoracic plaques in MS patients, the STIR sequence had a higher level of sensitivity compared to T1 PSIR and T2 fast spin echo (FSE) (16).
In our study, in the sagittal plane, STIR and PSIR sequences demonstrated higher sensitivity and accuracy compared to T2W TSE regarding the number of plaques. In the axial plane, PSIR sequence also represented more plaques compared to T2W TSE with a statistically significant difference.
In a similar study conducted by Fahmy and Ashamallah for assessing cervical lesions of MS patients, 39 patients who were MS patients with cervical spine lesions were assessed by sagittal STIR and PSIR images, regarding the number of lesions and lesion contrast. The findings showed that PSIR sequences demonstrated better conspicuity, but were not statistically significant (17).
In another study performed by Harel et al. in which PSIR and DIR sequences were compared regarding their diagnostic accuracy and sensitivity in detecting lesions in the brain cortex of MS patients. In the mentioned study, it was concluded that using PSIR sequences not only increases the number of detected lesions, but also improves the resolution of the lesions (21).
In our study, comparing lesions in all patients in both sagittal and axial planes, between sequences, the PSIR sequence had higher conspicuity and sensitivity in showing lesions and better differentiation between the lesion and the normal tissue in comparison to two other sequences.
In 2008, Poonawalla et al. conducted a study on 12 MS patients to find the contrast to noise ratio (CNR) of PSIR sequence, STIR and T2FSE in lesions of the cervical spine. The results of this study showed that PSIR sequence demonstrates a higher contrast between lesions and the surrounding normal tissue in comparison to other sequences (3). In another study that was performed to find the size of spinal lesions in both white and grey matter in MS patients, the significance and diagnostic accuracy of PSIR sequence was emphasized. Two sequences in the axial plane were used including three-dimensional fast field echo (3D-FFE) and 3D PSIR. After comparison of all findings and statistical analysis, 3D PSIR sequence had higher resolution and sensitivity and it was helpful in the assessment of spinal atrophy (4).
This study showed that PSIR sequence had more advantages compared to routine sequence T2W TSE in representing the total number of plaques, but there was no specific priority compared to STIR sequence. Regarding resolution and contrast between the lesions and the normal tissue, a statistically significant difference was found between PSIR and the other two routine sequences (STIR and T2W TSE) in two sagittal and axial planes. In fact, increasing the image resolution is helpful in finding the location of the plaque and it also increases the diagnostic accuracy, especially when the plaques are small.
In comparison to observation and the affections of artifacts in images, especially artifacts in cervical imaging including truncation and flow, PSIR sequence images showed none or minimum artifact because of its short time echo and its contrast that suppressed the cerebrospinal fluid signal. On the other hand, in the other two routine sequences, artifacts were obvious and interfered with the diagnostic procedure.
Our study had two limitations;
1. Pulse sequence inversion recovery needs high scan times; therefore, the imaging time increases. The high number of patients and the crowded MRI unit did not allow the researchers to assess more patients.
2. Inaccessibility of 3D sequences. 3D sequence has a higher spatial resolution and a higher signal to noise ratio and also the ability to have equal voxel size and reconstruction of images compared to 2D. Three dimensional images have a significant role in the conspicuity and resolution of MS lesions. Unfortunately, 3D STIR and 3D PSIR were not available in the MRI machine that we used for the study.
In conclusion, according to achieved results in this study and related researches, it can be concluded that using PSIR sequence as a complementary sequence for assessing cervical lesions of MS patients, is efficient and may increase the diagnostic accuracy in these patients.

