


1. Background
2. Objectives
3. Patients and Methods
3.1. Study Patients
3.2. PET/CT Acquisition
3.3. Imaging Review and Liver SUV Measurement
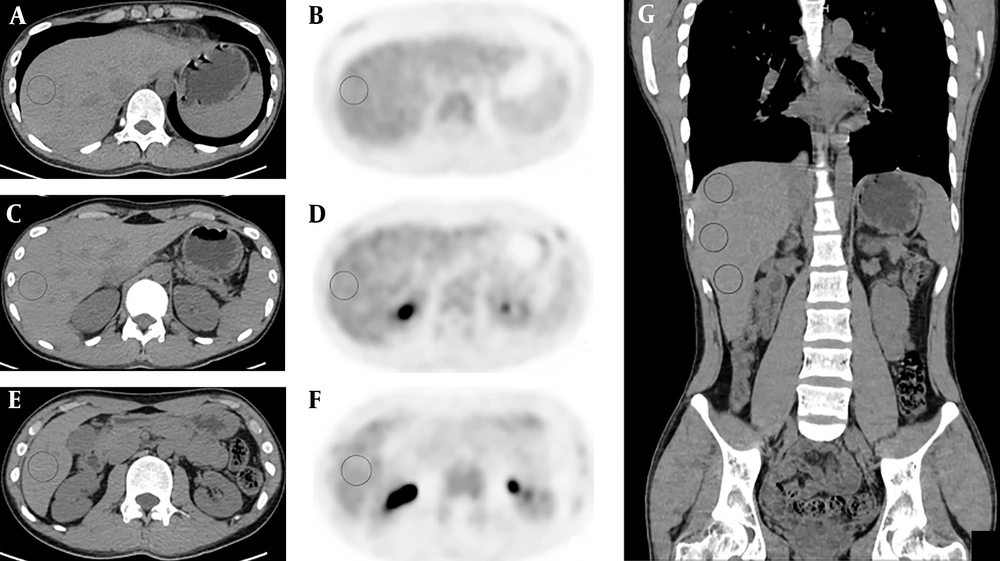
Transverse unenhanced CT (A, C, E) and positron emission tomography (PET) images (B, D, F) of hybrid PET/CT from a healthy individual at upper (A, B), lower (E, F) and portal vein level (C, D) within the right lobe of the liver. Areas in circus denote volumes of interest (VOI) for measuring liver mean standardized uptake value (SUVmean). Panel G is coronary CT image showing entirely the three VOIs in A, C and E.
3.4. Statistical Analysis
4. Results
4.1. Patient Demographic Information
4.2. Inter-Reader Agreements of Liver SUVmean at Different Locations
| Variables/Statistics | Liver SUVmean | Interlocation ICCs (95% CI) | P values | ||
|---|---|---|---|---|---|
| Upper level (CV) | Portal level (CV) | Lower level (CV) | |||
| Reader 1 | 1.84 ± 0.439 (23.9%) | 1.91 ± 0.417 (21.8%) | 1.89 ± 0.415 (22.0%) | 0.955 (0.946 - 0.962) | < 0.001 |
| Reader 2 | 1.85 ± 0.432 (23.4%) | 1.84 ± 0.396 (21.5%) | 1.89 ± 0.413 (21.9%) | 0.980 (0.976 - 0.983) | < 0.001 |
| Interreader ICCs (95% CI) | 0.935 (0.920 - 0.947) | 0.937 (0.906 - 0.956) | 0.930 (0.914 - 0.944) | NA | NA |
| P values | < 0.001 | < 0.001 | < 0.001 | NA | NA |
| Interreader bias | 0.004 ± 0.144 | 0.069 ± 0.112 | 0.002 ± 0.136 | NA | < 0.001a |
Abbreviations: CI, confidence interval; CV, coefficient of variation; ICC, intraclass correlation coefficient; NA, not associated; SUV, standardized uptake value; VOI, volume-of-interest.
aKruskal-Wallis test with post hoc Tamhane’s T2 test showed that bias of liver SUVmean at portal vein level was significantly larger than that at upper level (P < 0.001) and than that at lower level (P < 0.001), while liver SUVmean bias at upper level was not significantly different from that at lower level (P = 0.923).
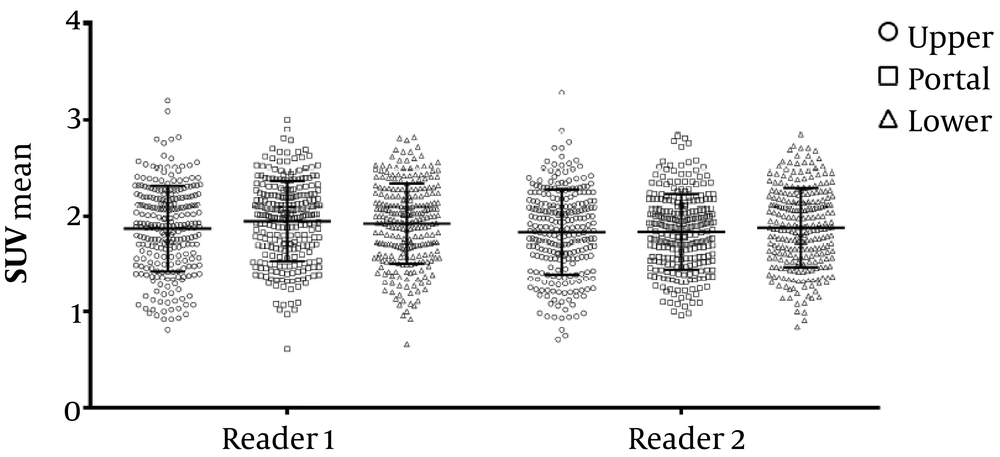
Scatter diagram shows liver mean standardized uptake value (SUVmean) measured at different locations by different readers. The general linear model analysis demonstrated that neither volume of interest (VOI) location nor reader had significant impact on liver SUVmean, with P values being 0.449 and 0.446, respectively.
4.3. Inter-Reader Agreements of Liver SUVmean at the Same Location
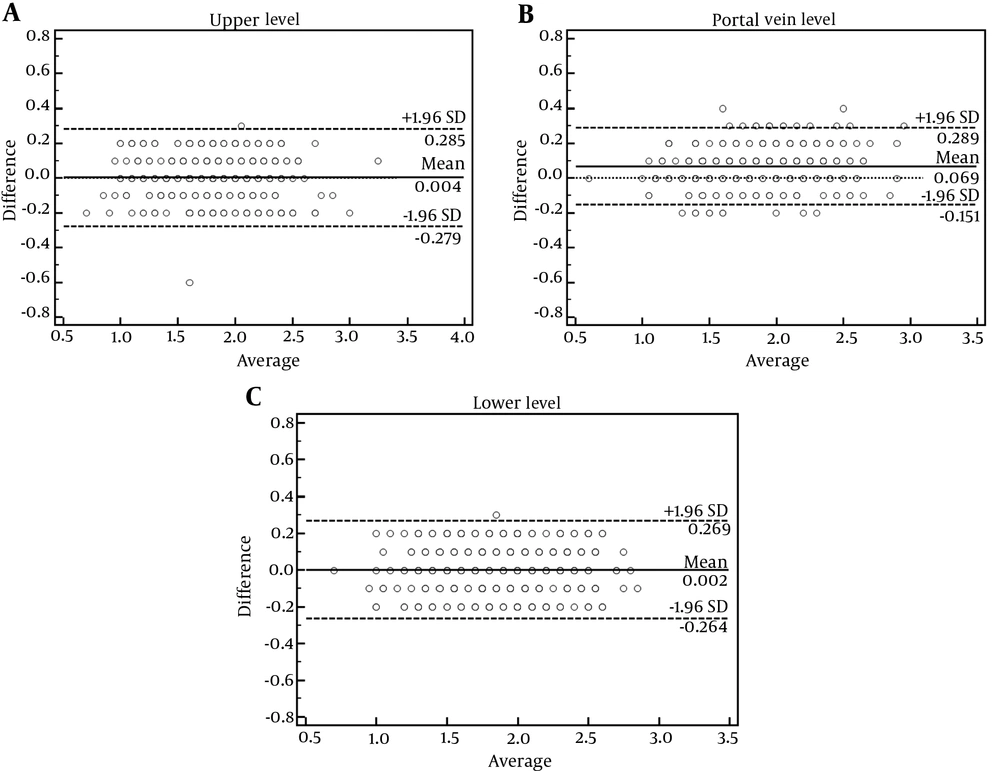
Bland-Altman plots show inter-reader variabilities of liver mean standardized uptake value (SUVmean) measured at upper (A), portal vein (B) and lower (C) levels of the right-lobe of the liver. Liver SUVmean at the portal vein level presented the largest bias (0.069 ± 0.112, P < 0.001, Kruskal-Wallis test), as compared to the other two locations which were not significantly different (0.004 ± 0.144 vs. 0.002 ± 0.136, P = 0.923, post hoc Tamhane’s T2 test).


