1. Background
During any type of radiation therapy, it is essential to prevent radiation overdose and underdose; thus, evaluation of the absorbed dose is a significant issue (1). For improved treatment of cancerous tissues and accurate radiation to a cancerous tumor, accurate dosimetry needs to be performed. Irradiation of cancerous tumors by X-ray or neutrons is one of the methods of cancer treatment (2).
Water phantoms and internal dosimetry are appropriate methods of dosimetry. Nowadays, water phantoms are generally used for clinical dosimetry. The phantoms usually evaluate absorbed doses with a large amount of error (3).
The current phantoms for dosimetry of liver tissue have many restrictions. A model of liver dosimetry is a miniature-scale model, which locates the target and source within the microstructure of liver tissue. Another method is the liver lobule simulation that comprises a single lobule with hepatic features (4). At present, there are no methods for accurate calculation of the required irradiation time in radiotherapy, and the current methods can only help by estimating the irradiation time. Since the liver plays an important role in the human body, its accurate dosimetry and calculation of the required irradiation time are critical in the field of nuclear medicine (5).
In radiotherapy planning, beam geometry and collimator positioning in the best situation and angle are critical for preserving healthy tissues from radiation and could provide the best radiation absorption within the target. One of the main aims of this procedure is to prevent healthy tissues from being exposed to excess irradiation as far as possible.
2. Objectives
The study objectives included accurate liver tissue dosimetry during the course of X-ray radiotherapy and designing a module based on the absorbed dose to calculate the required irradiation time for radiotherapy.
3. Materials and Methods
3.1. Liver Tissue Dosimetry by Abdominal Tissue Imaging
The digital imaging and communications in medicine (DICOM) images of the abdominal tissue of a male patient were applied from one of the directions in the Cartesian coordinate system. The DICOM images from YZ direction were considered in a way that the anterior position of the liver tissue was visualized.
To better recognize the target volume and the first slice of DICOM CT slices from which the target started, the pointer of DICOM images was set from the view of three directions in the Cartesian coordinate system. However, in case there was a cancerous tumor located in a small portion of the liver tissue, only the cancerous tumor was considered as the target, and the associated DICOM CT slices (for instance, 10 slices) were evaluated. To contour the tumor, DICOM CT images were sliced so that the whole tumor would appear from the beginning to the end of its depth. It was separated from the healthy and normal sections, and dosimetry was only applied to that region. In other words, not all the liver tissues were considered as targets of radiotherapy, but the normal portions of the liver tissue and other healthy tissues adjacent to the liver were accurately separated.
In this research, dosimetry was carried out based on the assumption that the liver tissue was metastatic. It means that the isodose was computed within the area of liver tissue and each point at a certain depth received the same dose in a way that the total absorbed dose equaled the sum of absorbed doses received in the layers of liver tissue where the DICOM computed tomography (CT) slices had covered. In this research, 85 slices were considered to cover the whole liver tissue from the YZ direction in the coordinates.
Afterwards, the DICOM images (slices) were converted into new images by MATLAB, and every organ was voxelized in the abdominal tissue. It means that high volumes were considered as voxels, and every voxel was repeated to create the full geometry of the tissue. In MATLAB programming, a large lattice was defined by dividing it into small lattices. In this research, the volume of every voxel was considered as 1 mm3.
3.2. Recognizing the Material Characteristics in Voxels
The characteristics of every material were distinguished from other materials based on Hounsfield unit (HU) scale of DICOM CT slices, in a way that every pixel of the slices was the indicator of one voxel, and there was a correlation between HU and each voxel (6). Therefore, each of the abdominal tissue voxels was identified using MATLAB according to its related HU. It was also determined to which abdominal regional tissue the voxels belonged. Every tissue in the abdominal region was defined based on HU and according to the Equation 1 (7):
where µX, µwater, and µair are the linear attenuation coefficients for material X, water, and air, respectively.
Each tissue in the abdominal region consists of its particular materials including fat and water and has its own radiodensity. Thus, each voxel was accurately correlated with its radiodensity and HU in a way that every voxel had its own HU. The radiodensities of materials were also described in the abdominal tissue based on HU for each of the voxels. Every voxel in the abdominal region was homogeneously filled with its related materials. Then, these voxels covered all the abdominal tissues.
3.3. Contouring the Voxelized Liver Tissue and Its Separation
As the abdominal region contains the liver tissue, contouring the liver tissue and separating its slices are very difficult.
It should be taken into consideration that the region in which dose calculation is carried out is up to the selection of DICOM CT slices associated with that region. It means that calculation of the dose is just made for the portion that is considered as a target. If one intends to perform dose calculations for healthy and non-target tissues adjacent to the cancerous tissues and tumors, the dosimetry course should be carried out for that intended tissue.
After data generation of the abdominal tissue voxels, the liver tissue was contoured and unrelated voxels to the liver tissue were eliminated. This elimination was very significant because of the very large number of generated voxels. It was carried out by removing the voxels belonging to non-liver tissues that had voxel numbers apart from voxel numbers covering the liver tissue. Afterward, in order to eliminate non-liver tissues, their materials were filled up with air instead of their own specific material. In other words, the liver tissue in the abdominal region was contoured and then separated.
3.4. Shifting Data to the MCNPX Code and Calculation of Absorbed Doses
The precise geometry data of the liver tissue were prepared using MATLAB, and then these data were shifted to the MCNPX code. That is to say, liver geometry was finally obtained from DICOM images. After contouring and separating the liver tissue from the abdominal region, the voxels of the non-liver region no longer appeared.
At this stage, the tissue constituents in the abdominal region were considered as the MCNPX input data. After running the MCNPX program, the absorbed doses were accurately identified. The dosimetry results obtained in this research were compared with the results extracted from the simulation of a spherical liver phantom as defined below (8).
This phantom consisted of multiple layers in a way that each layer indicated the elements of liver tissue. The radius and thickness of each layer were correlated with the volume of that element, meaning that it had similar components to the human liver tissue. These components were analyzed to their basic elements like hydrogen and carbon. The dimensions of this phantom were specified as follows (8):
(1) A water sphere (radius, 2.73 cm); (2) A carbon layer covering the water sphere (outside radius, 3.43 cm; thickness, 7 mm); (3) An outside thin sulfur layer (thickness, 200 µm) around the carbon layer; (4) A blank space between sulfur layer and carbon shell consisting of nitrogen gas (inside radius, 3.45 cm; outside radius, 27.00 cm,); and (5) A spherical carbon shell as reflector (inside radius, 27.00 cm; thickness, 3.3 mm). The course of dosimetry was carried out for this phantom model, and its results were compared with those obtained for the liver tissue.
3.5. Obtaining Accurate Irradiation Time in X-ray Radiation Therapy
One of the most important issues with regard to the treatment of cancerous tumors is the accurate calculation of irradiation time during X-ray radiation therapy. In this investigation, a relationship was taken into account between energy, X-ray activity, and absorbed dose. An appropriate equivalence can be considered between absorbed dose and activity, as follows:
Since the absorbed dose is expressed, in fact, per irradiation of just one photon, after determining absorbed dose per each photon energy, the activity value was multiplied by it. To identify the irradiation time (t), the liver tissue absorbed dose was divided by X-ray activity for arbitrary energy. After obtaining the desired dose by an expert radiobiologist, this value was considered as the input to the advanced developed software (designed using Delphi 7 language) and interpolated for the absorbed doses according to Table 1.
| Energy of incident photon, MeV | Absorbed dose in water, Gy | Absorbed dose in carbon, Gy | Absorbed dose in sulfur, Gy | Absorbed dose in nitrogen, Gy | Total absorbed dose, Gy |
|---|---|---|---|---|---|
| 1 | 3.96 × 10⁻³ | 1.73 × 10⁻⁴ | 1.57 × 10⁻⁵ | 4.65 × 10⁻⁶ | 4.15 × 10⁻³ |
| 2 | 7.08 × 10⁻³ | 2.68 × 10⁻⁴ | 7.75 × 10⁻⁵ | 8.37 × 10⁻⁶ | 7.43 × 10⁻³ |
| 4 | 1.00 × 10⁻² | 6.15 × 10⁻⁴ | 3.16 × 10⁻⁴ | 4.19 × 10⁻⁵ | 1.10 × 10⁻² |
| 4.5 | 1.09 × 10⁻² | 4.85 × 10⁻⁴ | 3.87 × 10⁻⁴ | 3.85 × 10⁻⁵ | 1.18 × 10⁻² |
| 6 | 1.28 × 10⁻² | 4.68 × 10⁻⁴ | 4.95 × 10⁻⁴ | 3.17 × 10⁻⁵ | 1.38 × 10⁻² |
| 7.5 | 1.34 × 10⁻² | 7.33 × 10⁻⁴ | 5.35 × 10⁻⁴ | 3.50 × 10⁻⁵ | 1.47 × 10⁻² |
| 8 | 1.35 × 10⁻² | 7.99 × 10⁻⁴ | 5.59 × 10⁻⁴ | 3.92 × 10⁻⁵ | 1.49 × 10⁻² |
| 10 | 1.63 × 10⁻² | 8.57 × 10⁻⁴ | 6.72 × 10⁻⁴ | 4.60 × 10⁻⁵ | 1.79 × 10⁻² |
| 11 | 1.68 × 10⁻² | 9.66 × 10⁻⁴ | 7.12 × 10⁻⁴ | 5.02 × 10⁻⁵ | 1.85 × 10⁻² |
| 12 | 1.76 × 10⁻² | 1.28 × 10⁻³ | 7.62 × 10⁻⁴ | 5.44 × 10⁻⁵ | 1.97 × 10⁻² |
| 13 | 1.77 × 10⁻² | 1.37 × 10⁻³ | 8.07 × 10⁻⁴ | 5.94 × 10⁻⁵ | 1.99 × 10⁻² |
| 14 | 1.84 × 10⁻² | 1.52 × 10⁻³ | 8.39 × 10⁻⁴ | 6.39 × 10⁻⁵ | 2.08 × 10⁻² |
| 15 | 1.90 × 10⁻² | 1.70 × 10⁻³ | 8.54 × 10⁻⁴ | 7.19 × 10⁻⁵ | 2.16 × 10⁻² |
| 16 | 1.90 × 10⁻² | 1.87 × 10⁻³ | 8.64 × 10⁻⁴ | 7.96 × 10⁻⁵ | 2.18 × 10⁻² |
| 17 | 1.91 × 10⁻² | 2.08 × 10⁻³ | 8.80 × 10⁻⁴ | 8.43 × 10⁻⁵ | 2.21 × 10⁻² |
| 18 | 1.88 × 10⁻² | 2.34 × 10⁻³ | 9.01 × 10⁻⁴ | 9.20 × 10⁻⁵ | 2.21 × 10⁻² |
| 19 | 1.91 × 10⁻² | 2.52 × 10⁻³ | 9.21 × 10⁻⁴ | 9.50 × 10⁻⁵ | 2.26 × 10⁻² |
| 20 | 1.96 × 10⁻² | 2.57 × 10⁻³ | 9.48 × 10⁻⁴ | 9.46 × 10⁻⁵ | 2.32 × 10⁻² |
Therefore, using the obtained absorbed dose (Gy) per each photon energy and the desired dose of treatment (Gy), activity (Bq), and energy of clinical X-ray source (MeV), all of which as input data to the software package, the accurate irradiation time was calculated in seconds by the mentioned software package to reach the desired dose for X-ray therapy.
4. Results
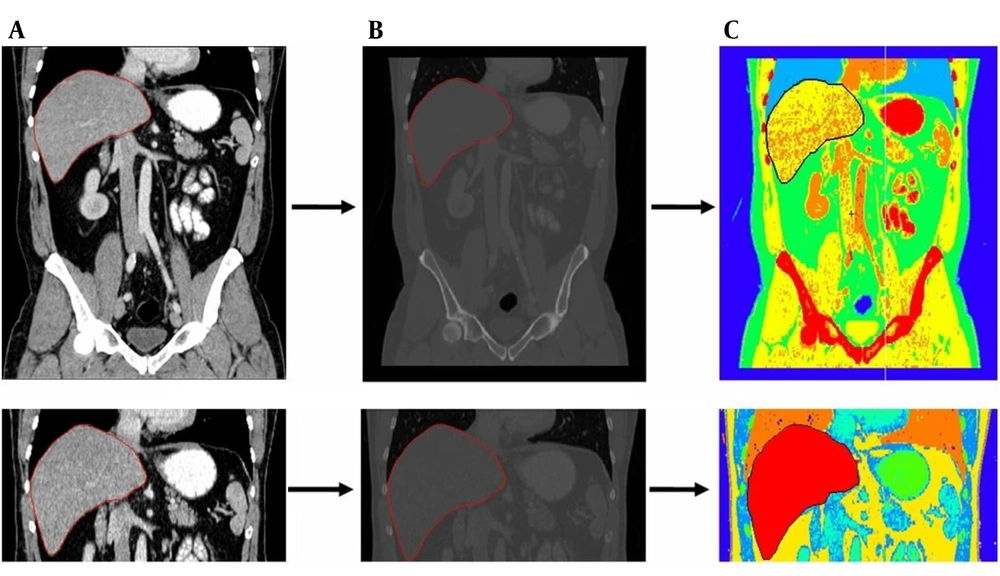
The stages of converting a DICOM image of the abdominal tissue to a new image in MATLAB and conversion by MCNPX code are shown in sequence in Figure 1. The liver tissue is demarked in all the stages.
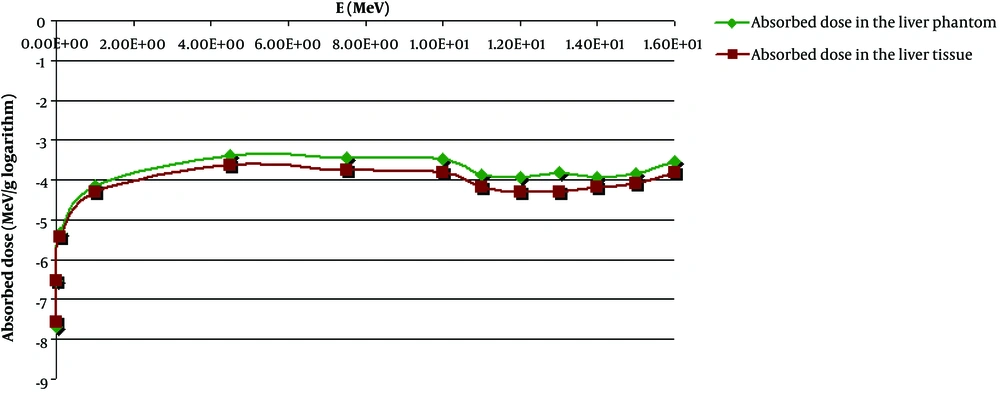
Every part of the abdominal tissue was automatically colored by MCNPX code according to the material number. As shown in Figure 1C, the liver tissue image has a red color in the separated state. Figure 2 shows the values of the total absorbed dose (in logarithm) in the liver tissue and liver phantom.
An arbitrary value of the required treatment dose was considered in a wide range of X-ray photon energies for the obtained absorbed doses according to Table 1.
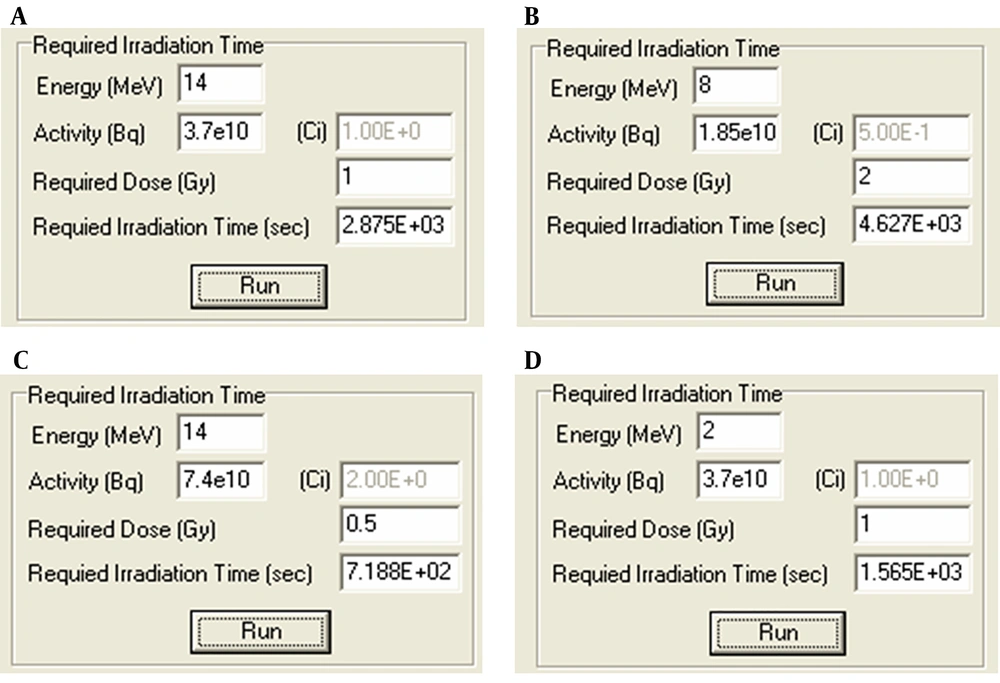
Finally, the required irradiation time was accurately obtained (in seconds) by applying the software package according to Figure 3.
According to Figure 3, for instance, in section C, it is observed that for a patient who needs 0.5 Gy as a treatment dose and taking into consideration a clinical X-photon source with the energy of 14 MeV and activity of 2 Ci, the required irradiation time will be 718.8 s in order to reach the desired absorbed dose.
In this study, the DICOM images of the abdominal tissue were first considered. The liver tissue was then segmented and exposed to X-ray photon using DICOM images, MCNPX code, and MATLAB software. Dosimetry of the materials of the separated tissue was also carried out. Finally, the absorbed doses and the required irradiation times were obtained. It should be noted that this technique could be used for all patients using DICOM CT slices to obtain the acceptable absorbed dose and the required irradiation time.
5. Discussion
By applying the method mentioned in this study, the precise internal absorbed doses were computed for the whole liver tissue and its constituent elements in X-ray radiation therapy. Moreover, this method might be applicable to other radiations such as proton or neutron irradiation.
The precision of this method depends on the minimum resolution of the X-ray device in nuclear medicine center. The resolution of each small lattice was considered to be 1 mm3, as the minimum resolution of the X-ray device in this study was 1 mm3. Another factor is the accurate identification of the constituent materials of the abdominal tissue organs for MCNPX code that has been decomposed into its constituent elements. In addition, densities of each of the constituent elements should be defined.
On the other hand, each organ is numbered and considered as a material, and then its elements (sub-materials) along with their ZAID (Z*1000+A) and densities are considered and defined for MCNPX code. Therefore, the irradiation time required to reach the desired absorbed dose for the liver tissue during X-ray therapy is calculated based on the absorbed doses of the liver tissue (Table 1) defined in the software package alongside input data, such as energy and activity of the X-ray source and using numerical interpolation between the absorbed doses.
Today, water phantoms are applied in clinical dosimetry. It comprises a water container in which a counter is located in its different points (9). Besides, test phantoms mostly consist of isocentric circles and cubes that are used for the calculation of absorbed dose. In addition, a flexible synthetic liver phantom has been recently made from soft silicone mixtures. This phantom has motion-detection ability. In this phantom, silicones let the phantom deform to provide better contrast for radiographic imaging. Moreover, in this phantom, an actuator is used to compress the liver in imprecise directions (10).
The method of voxel-based dosimetry for tumors, liver, lung, and the interface of liver-lung has been performed usingYttrium-90 (90Y) micro-sphere for radiation therapy based upon 90Y bremsstrahlung single photon emission computed tomography/computed tomography (SPECT/CT) such that the sensitivity of the mentioned organs is also specified. In this method, 90Y imaging along with SPECT/CT through positron emission allows for the calculation of absorbed dose, meaning that the calculations are performed based on image resolution and quality by using 90Y (11).
In this study, the obtained results could be standardized for similar investigations on the liver tissue, and as such, after determination of the desired treatment and based on the activity and energy of clinical X-ray source, the accurate absorbed dose and irradiation time will be inferred, respectively. Thus, from a clinical point of view, this technique may be generalized and applied to various soft tissues with different shapes and sizes.
Fractionation to obtain absorbed dose values for the constituent materials of the liver tissue can also be helpful for radiobiologists to measure the effectiveness of photon irradiation on materials and conclude on the shortage or excess of doses to better obtain the required dose.
As observed in Figure 2, within the photon energy range, the obtained absorbed dose in the liver phantom is approximately analogous to the dosimetry results obtained for the separated liver tissue in this research, and their curves are roughly consistent with one another. Based on this figure, it is concluded that the highest absorbed dose is obtained at about 5 MeV photon energy.


