


1. Background
Gastrointestinal stromal tumors (GISTs), which are the most common mesenchymal tumors of the digestive system with malignant potential (1), are classified as very low, low, intermediate and high risk according to the 2008 National Institutes of Health (NIH) criteria (2). Asian Consensus Guidelines suggest that very low- and low-risk GISTs should be treated as benign tumors under strict monitoring, while patients with intermediate- and high-risk GISTs are required to take imatinib mesylate in addition to the operation to prevent metastasis or postoperative recurrence (3). Needle biopsy for immunological analysis is commonly used in clinical practice. However, improper operation might cause tumor rupture and hemorrhage, increasing the risk of tumor dissemination (4). Thus, it is clinically important and necessary to explore noninvasive, reliable and practical markers for preoperatively predicting the grade in patients with GISTs.
Currently, at least three imaging methods are used for GIST patients. Although positron emission tomography-computed tomography (PET/CT) is the most sensitive and accurate method, it is not recommended as a routine examination because of the high cost (5). Magnetic resonance imaging (MRI) may be another method that could provide functional quantitative indicators but its clinical significance in this context requires further study (6). Computed tomography (CT) is widely recognized as the main imaging method due to its moderate price and convenient operation. CT images can show the location and size of masses, as well as the presence of cystic necrosis and distant metastases (7). However, these signs are assessed based on experience, which are greatly influenced by subjective factors, and cannot directly predict the grade in patients with GISTs.
Texture analysis as a quantitative imaging technique could better avoid diagnostic errors caused by human factors compared to conventional CT examination (8), and it could objectively reflect the potential biological characteristics and heterogeneity of tumors (9). Texture analysis based on CT, MRI and PET/CT scan has achieved preliminary results for grade in the head and neck, and rectal cancer (10, 11). Recent reports have shown that texture analysis was of certain value in the diagnosis and differentiation of gastric tumors (12, 13).
2. Objectives
The purpose of this study was to investigate the capability of CT-based texture analysis for predicting the grade of GISTs and compare the findings with those of a combination model consisting of CT signs and texture parameters.
3. Patients and Methods
3.1. Patients
The medical ethics committee of our institution approved this study. For this retrospective study, the requirement for informed consent was waived. A total of 873 patients with pathologically confirmed GISTs from January 2011 to September 2017 in Fudan University Shanghai Cancer Center, Shanghai, China were selected for this study. The patient recruitment process is presented in Figure 1. Finally, 168 patients (88 females and 80 males) were included in the final analysis. The median age was 57 years with a range of 22 to 93 years. Patients were divided into training group (n = 117) and validation group (n = 51) after simple randomization at a ratio of 7 to 3.

Patient recruitment process
3.2. Pathological Characteristics
All tumors were evaluated for histological characteristics and the expression of CD117 and CD34. The tumors were divided into the potential malignancy group (very low and low risk) and the malignancy group (intermediate and high risk).
3.3. CT Image Acquisition and Analysis
Patients generally underwent contrast-enhanced CT scans less than 10 days before treatment on the 32- or 64-slice Siemens Sensation system, and the scan range included all lesion areas. The CT parameters were as follows and used with a standard reconstruction algorithm: tube voltage, 120 kVp; tube current, 250 - 300 mA; slice thickness and interval, 1.0 mm. A total of 80 - 120 mL (1.5 mL/kg) of iodinated contrast material was injected at a flow rate of 3 mL/s into the antecubital vein. Considering that the masses in this study were distributed in different segments of the digestive tract, and were observed more clearly in the portal venous phase, the texture features extraction were only performed on portal venous phase CT images in this study. There was no universally accepted criterion for the selection of scanning phase for texture analysis, but majority of the reports nevertheless selected portal venous phase CT images (12, 14, 15). The portal venous phase CT images were performed at 60 s after injection of contrast medium.
Two radiologists with 3 and 13 years of experience in CT diagnosis assessed the following image signs of each mass without knowing the pathology determined by consensus: tumor location (gastric and nongastric), size (the maximal diameter of the largest cross section < 5 cm, 5 - 10 cm or > 10 cm), growth pattern (inter-intestinal, extra-intestinal or cross-intestinal), shape (regular or irregular), boundary (clear or unclear), calcification and cystic necrosis (present or absent) (16).
3.4. Texture Feature Extraction and Analysis
Feature extraction was performed using the LIFEx (LIFEx3.40, CEA-SHFJ, Orsay, France) package. The above two radiologists selected the largest slice of the tumor to delineate the region of interest (ROI) on the transverse section by consensus (Figure 2), and the coronal and sagittal positions of the ROI were obtained automatically. The ROI selection included all tumors and avoided blood vessels, calcification and gas. A total of 29 features were extracted automatically including: (a) two shape parameters, (b) four histogram parameters, (c) four conventional parameters, (d) six gray-level co-occurrence matrix (GLCM) parameters, (e) 11 grey level run length matrix (GLRLM) parameters, (f) two neighborhood gray-level different matrix (NGLDM) parameters. A list of the corresponding features is provided in Table 1, while a detailed description of all features have been mentioned in a study by Orlhac et al. (17).
| Type | Definition | Feature name (symbol/abbreviation) | Description |
|---|---|---|---|
| Shape | The shape parameters reflect the sphericity and compacity of the volume of interest in voxels. | Sphericity (-) | Measures how spherical a volume of interest is. Shericity is equal to 1 for a perfect sphere. |
| Compacity (-) | Measures how compact the volume of interest is. | ||
| Histogram | To build a histogram, it is necessary to determine a bin width (“bin” parameter). The indices derived from the histogram will depend on this bin width parameter. | SkewnessHisto (-) | Measures the asymmetry of the gray-level distribution in the histogram. |
| Kurtosis (-) | Measures whether the gray-level distribution is peaked or flat relative to a normal distribution. | ||
| Entropy (Entropy H) | Measures the randomness of the distribution. | ||
| Energy (Energy H) | Measures the uniformity of the distribution. | ||
| Conventional | In LIFEx, with the relative model the histogram is built only with “number of grey level” fields of the resampling menu that entered by the user and min., mean, standard deviation and max. are extracted values of each ROI. | Minvalue (-) | Measures the minimum in the volume of interest. |
| Meanvalue (-) | Measures the average in the volume of interest. | ||
| Stdvalue (-) | Measures the standard deviation in the volume of interest. | ||
| Maxvalue (-) | Measures the maximum in the volume of interest. | ||
| GLCM (Gray-level co-occurrence matrix) | The GLCM takes into account the arrangements of pairs of voxels to calculate textural indices. The GLCM is calculated from 13 different directions in 3D with a δ-voxel distance relationship between neighbored voxels. The index value is the average of the index over the 13 directions in space (X, Y, Z). | Homogeneity (-) | Measures the homogeneity of gray-level voxel pairs. |
| Energy (-) | Also called Uniformity or Second Angular Moment, measures the uniformity of gray- level voxel pairs. | ||
| Contrast (-) | Also called Variance or Inertia, measures the local variations in the GLCM. | ||
| Correlation (-) | Measures the linear dependency of gray-levels in GLCM. | ||
| Entropy (-) | Measures the randomness of gray-level voxel pairs. | ||
| Dissimilarity (-) | Measures the variation of gray-level voxel pairs. | ||
| GLRLM (Grey level run length matrix) | The GLRLM gives the size of homogeneous runs for each grey level. This matrix is computed for the 13 different directions in 3D (4 in 2D) and for each of the 11 texture indices derived from this matrix, the 3D value is the average over the 13 directions in 3D (4 in 2D). | Short-run emphasis (SRE) | SRE and LRE measure the distribution of the short or the long homogeneous runs in an image respectively. |
| Long-run emphasis (LRE) | |||
| Low gray-level run emphasis (LGRE) | LGRE and HGRE measure the distribution of the low or high gray-level runs respectively. | ||
| High gray-level run emphasis (HGRE) | |||
| Short-run low gray-level emphasis (SRLGE) | SRLGE and SRHGE measure the distribution of the short homogenous runs with low or high gray-levels respectively. | ||
| Short-run high gray-level emphasis (SRHGE) | |||
| Long-run low gray-level emphasis (LRLGE) | LRLGE and LRHGE measure the distribution of the long homogeneous runs with low or high gray-levels respectively. | ||
| Long-run high gray-level emphasis (LRHGE) | |||
| Gray-level non-uniformity for run (GLNUr) | GLNUr and RLNU measure the non-uniformity of the gray-levels or the length of the homogeneous runs respectively. | ||
| Run length non-uniformity (RLNU) | |||
| Run percentage (RP) | Measures the homogeneity of the homogeneous runs. | ||
| NGLDM (Neighborhood gray-level different matrix) | The NGLDM corresponds to the difference of grey-levels between one voxel and its 26 neighbors in 3 dimensions (8 in 2D). | Coarseness (-) | Measures the level of spatial rate of change in intensity. |
| Contrast (-) | Measures the intensity difference between neighboring regions. |
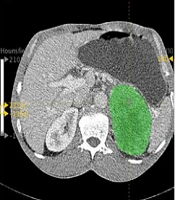
. A, Transverse section; B, Coronal section; C, Median sagittal section; D, Graylevel histogram.")
Abdominal portal venous-phase CT images of a 33-year-old man. Texture features were extracted from the primary tumor area (green overlay). A, Transverse section; B, Coronal section; C, Median sagittal section; D, Graylevel histogram.
3.5. Statistical Analysis
Statistical analysis was performed in R (version 3.4.3, http://www. r-project. org) and SPSS 23.0 (IBM, Armonk, NY, USA). A two-tailed P value of < 0.05 was used as the criterion to indicate a statistically significant difference. The Mann-Whitney U test was used to assess differences in patient age, whereas the χ2 test was used to assess differences in sex.
3.6. Feature Selection and Prediction Model Establishment
The radiomics signature and combination model were established in the training group. Univariate analysis was applied to the CT and texture features to identify the most relevant predictors of the grade of GISTs using Pearson’s correlation test. Multivariate analysis was performed by least absolute shrinkage and selection operator (LASSO) regression to address multiple cross-related covariates and reduce the risk of overfitting of the data (18). The method of lambda selection was ten-fold cross-validation. The prediction models were developed by the linear fusion of selected features weighted by their coefficients, with a radiomics score (rad-score) and a prediction score (pre-score) calculated for each patient based on validation group.
3.7. Prediction Performance
The prediction performance of the models was evaluated by the area under the receiver operating characteristic (ROC) curve (AUC). The AUCs, sensitivity, specificity and accuracy with 95 % confidence intervals (CIs) were calculated for each model. Calibration was evaluated with the Hosmer-Lemeshow goodness-of-fit test, which reflects the consistency of the model forecast risk and the actual risk; P > 0.05 indicated insignificant deviance from the theoretical perfect calibration. Intra- and interclass correlation coefficients (ICCs) were used to evaluate the consistency and reproducibility of the intra- and inter-observer agreement of the CT signs assessment and radiomics features extraction. An ICC greater than 0.75 indicated good consistency.
4. Results
4.1. Patient Characteristics
A total of 168 patients were enrolled in this study. The patient characteristics are summarized and compared in Table 2. There were no significant differences in gender or age between the potential malignant group and the malignant group (P > 0.05), consistent with the report (19).
4.2. Establishment of the Radiomics Signature and Combination Model
A total of 29 texture features and seven CT parameters were extracted from the 168 patients’ CT portal-phase images, and the agreement between the two radiologists was excellent for those features (all ICCs > 0.85) (P < 0.05). Thus, the mean measurement values of the two radiologists were used for further analysis. The cross-correlation matrixes (Figure 3A and B) showed that there were multiple complex cross-correlations among the 36 parameters. The selection of covariates with non-zero coefficients by Lasso regression to establish the two models was depicted in Figure 4A and B. The texture features of sphericity, compacity, contrast, dissimilarity and CT imaging features of size, and location were selected to develop the predictive models. The rad- and pre-scores were calculated for each patient. Patients in the malignant group generally had higher rad-scores and pre-scores than patients in the potential malignant group (Table 3).
| Models | Training group | Z value | P value | |
|---|---|---|---|---|
| Potential malignant group (n = 45) | Malignant group (n = 72) | |||
| Sphericity | 0.914 (0.888, 0.977) | 0.916 (0.905, 0.961) | -1.333 | 0.182 |
| Compacity | 6.899 (4.239, 9.488) | 15.324 (9.631, 20.715) | -6.734 | < 0.001 |
| Contrast | 10.229 (6.725, 13.696) | 15.203 (7.194, 19.213) | -2.095 | 0.036 |
| Dissimilarity | 2.362 (1.947, 2.853) | 2.729 (2.729, 3.415) | -2.280 | 0.023 |
| Rad-score | -1.606 (-1.900, -0.682) | 0.388 (-0.418, 1.971) | -7.238 | < 0.001 |
| Pre-score | -1.571 (-1.577, -0.460) | 0.312 (0.021, 1.049) | -7.939 | < 0.001 |
aValues are expressed as median (interquartile range [IQR]).
bZ and P values are the results of Mann-Whitney test.
 and combination model (B). The depth of color indicates the intensity of the correlation between covariates. The darker the color, the higher the correlation. The lighter the color, the lower the correlation. Blue represents positive correlation, and red represents negative correlation.")
The cross-correlation matrix for covariates used to establish the radiomics signature (A) and combination model (B). The depth of color indicates the intensity of the correlation between covariates. The darker the color, the higher the correlation. The lighter the color, the lower the correlation. Blue represents positive correlation, and red represents negative correlation.
 and combination model (B). Tuning parameter (λ) selection in the lasso model used ten-fold cross-validation. The two vertical dashed lines represent one standard deviation on each side of the minimum value, corresponding to the chosen variables that better fit the models.")
Feature selections for the radiomics signature (A) and combination model (B). Tuning parameter (λ) selection in the lasso model used ten-fold cross-validation. The two vertical dashed lines represent one standard deviation on each side of the minimum value, corresponding to the chosen variables that better fit the models.
4.3. Assessment and Comparison of the Prediction Models
Both the radiomics signature and combination model were significantly associated with GIST grade. Regarding prediction performance, the combination model performed better than the radiomics signature (Table 4).
| Models | AUC, 95% CI | Sensitivity, % | Specificity, % | Accuracy, % | Z value | P value |
|---|---|---|---|---|---|---|
| Radiomics signature | 0.897 (0.811 - 0.983) | 76.20 | 90.00 | 84.30 | 1.85 | 0.06 |
| Combination model | 0.959 (0.905 - 1.000) | 90.50 | 93.30 | 90.20 |
Abbreviations: AUC, area under the receiver operating characteristics curve; CI, confidence interval.
aZ and P values are the results of Mann-Whitney test.
4.4. Validation of the Prediction Models
The Hosmer-Lemeshow goodness-of-fit test showed no statistically significant differences between the predictions and observations of the two models (P > 0.05). The calibration curves of the two models in the validation group are shown in Figure 5.
 grade and observed rate of grade.")
Calibration curves of the two models in the validation group. Calibration curves depict the calibration of the two prediction models in terms of agreement between the predicted probability of the gastrointestinal stromal tumor (GIST) grade and observed rate of grade.
5. Discussion
In this study, the value of conventional CT combined with texture analysis in grade of GISTs was discussed for the first time. A radiomic signature based on texture features and a combination model consisting of CT and texture parameters were established and used to identify predictive markers discriminating patients with potentially malignant and malignant GISTs. The combination model was shown to be more advantageous in this prediction.
The results of this study showed higher rad-scores and its compositions in patients with malignant GISTs. The sphericity is the maximum value 1 for a perfectly round ROI. When the ROI is another shape, the sphericity is less than 1 and not affected by regional translation, rotation and scale changes (17). The author considered this principle to explain the result that the sphericity was not significantly different between the two groups of patients. Contrast and dissimilarity are two parameters of GLCM. Greater contrast and dissimilarity indicates a deeper texture groove, a larger image texture variation in different regions, and a more uneven local texture (20). Compared with the potential malignant GISTs, the compacity, contrast and dissimilarity of malignant GISTs were higher. We speculated that the results may be related to a higher degree of cell proliferation and higher blood supply compromise in the tumoral tissue. Those showed more mixed, compact and irregular texture associated with greater heterogeneity of the tumor region. Previous studies have confirmed that the texture features of human body could change due to pathological changes, and the above three parameters have been used to distinguish between benign or malignant lesions in patients with other tumors (21-23), suggesting that the texture of tumors with increased heterogeneity was more uneven.
This study also explored whether the prediction performance based on texture analysis could be improved by combination with conventional CT. The combination model was composed of the size and location of CT signs and the compacity of texture parameters, and this model was more advantageous than radiomics signature. The specificity and accuracy of the combination model were also superior. Tumor size and location have been confirmed in many reports to be closely related to the degree of malignancy (24, 25): larger primary masses not in the stomach usually exhibit a higher degree of malignancy than smaller ones in the stomach. The results of this study confirm the hypothesis.
Liu et al. found that entropy based on venous-phase images can be used to distinguish between very low- and low-risk GISTs (AUC = 0.684) (26). Nevertheless, no significant differences were detected in parameters other than those mentioned above between GISTs patients in this study. This discrepancy may be related to the selection of more dimensions and a wider range of texture parameters, leading to the parameters reduced and selected by LASSO being more representative. In addition, three-dimensional spatial analysis of the tumor ROI texture features could more accurately reflect the overall heterogeneity of the ROI (27).
The present study had several limitations. First, the sample size of this single-center retrospective study was relatively small, and the results need to be confirmed by further prospective and multicentric studies with larger sample sizes. Second, the features extracted in this study were only based on portal venous phase CT images. Whether the use of other periods or some combination will increase the diagnostic efficiency requires further study.
In conclusion, the prediction models established in this study were validated to be valuable for grade evaluation in patients with GISTs and may represent non-invasive and practical biomarkers for optimizing the treatment strategy and improving the prognosis of GISTs. In addition, the combination model had more advantages than texture analysis alone.
