1. Background
Breast cancer is one of the high risks that leads to death among females in the world (1, 2). The primary purpose of breast ultrasound imaging is as an adjunct to mammographic imaging to identify the nature of the lesion (i. e., cystic versus solid), which in turn determines the need for core biopsy. A radiologist then examines the images for any abnormalities. The diagnosis of fibroadenoma is primarily made with ultrasound imaging after mammography; an invasive biopsy is not customarily required (3). The diagnosis of ultrasound images was dominated by inter-observed and intra-observed bias, such as instrumental parameters, human factors, or the experience of the physicians. Hence, efforts are underway to develop ultrasound computer-assisted diagnosis (CAD) systems that can assist radiologists in diagnosing breast diseases (4, 5). Therefore, the analyzing of features of breast images could provide the radiologist with ancillary information to improve the diagnosis accuracy (6).
Ultrasound images of benign lesions are symmetrical and have smooth edges; whereas, images of malignant lesions are irregular. Furthermore, benign lesions yield high echoes, and malignant lesions yield low echoes (6). There are many studies in the literature on ultrasound image analysis via textural or feature analysis (7-10). In addition, fractal dimension imaging describes geometric patterns or self-similarities by subtle physical shapes; meanwhile, it can also display the irregularity and complexity of image textures (11). The box-counting method with fixed grid scans is a commonly used calculation for measuring fractal objects but is easily affected by factors such as image noise and size (12). Texture analysis on pixels with fixed sizes using a gray-level co-occurrence matrix (GLCM) can serve as a tool in the classification of benign versus malignant ultrasound texture images and can improve the accuracy of diagnosis (13, 14). However, when analyzing textures using GLCM, the resulting output is influenced by parameters such as raw image resolution, gray image level, scan condition, or feature statistics. Therefore, it is recommended to use the result as a reference in clinical practice (9, 15).
2. Objectives
Due to different textures between benign versus malignant breast B-mode ultrasound tomography, this study was to evaluate the significant extracted textural features to identify breast tumors as malignant or benign. The aim was to identify image features that can facilitate a reasonable quantitative analysis of ultrasound images of malignant and benign lesions.
3. Patients and Methods
3.1. Patients
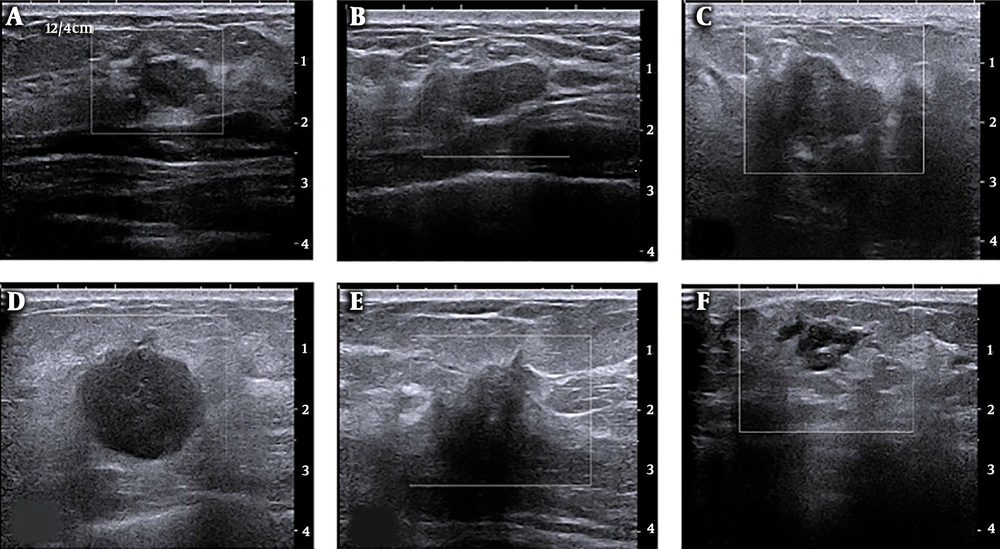
The Institutional Review Board approved this study of E-Da Hospital, Taiwan (no.: EMRP-105-099) and informed consent was not required for this retrospective Health Insurance Portability and Accountability Act (HIPAA) investigation. A total of 85 cases (35 malignant and 50 benign with diagnostic reports) of ultrasound images taken during the years 2010 to 2013 were collected. Benign patients were required to receive two of the following: mammography or breast ultrasound imaging. Medical radiologists then diagnosed the images. For patients with malignant lesions, the condition was confirmed by biopsy before inclusion in this study. There was no age limitation. Each diagnosis report was for one side of the breast. The ultrasound images of breast cancer determined the regions of interest (ROIs) (i.e., the specific image, including the entire breast). Figure 1 shows B-mode breast ultrasound between benign and malignant lesions. Target lesions with round, macro-lobulated shape or ovoid, circumscribed boundary, abrupt interface to the normal parenchyma were categorized as probably benign. On the contrary, target lesions with complex echotexture, lacking circumscribed margin, irregular shape, displaying thick echogenic halo, or posterior acoustic shadowing were considered as malignant.
3.2. The Extracted Image Features
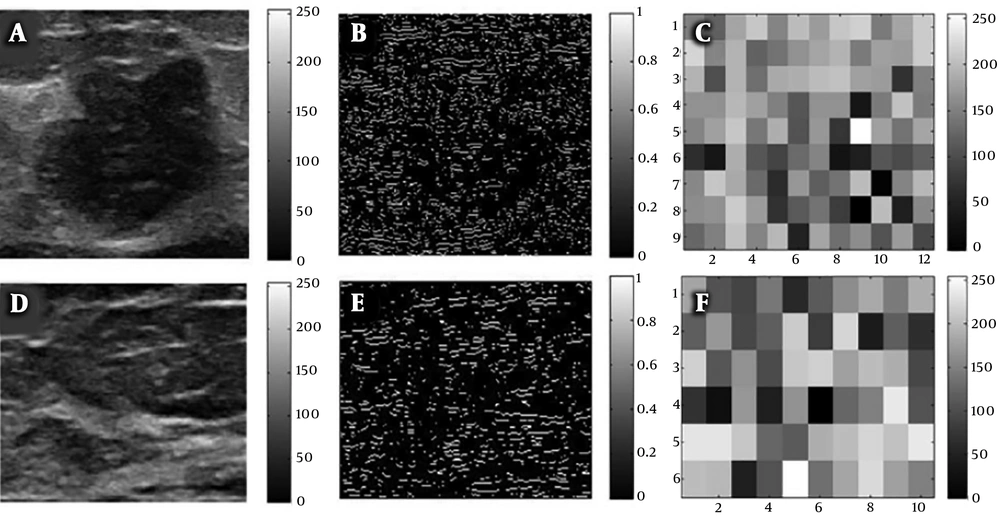
The ROIs containing breast the entire B-mode ultrasound image were selected. Regions for non-mammary tissues, including ribs and the musculus pectoralis major, along with other labels were excluded. Image edges were estimated using the Laplacian of Gaussian (LoG) method, and texture images were calculated using box-counting (Figure 2). Finally, texture analysis was performed, as shown in Figure 2C and F.
Breast B-mode ultrasound image conversion diagram; A, Regions of interest (ROI) selected from a raw image of a malignant breast cancer; B, Laplacian of Gaussian (LoG) estimate of edges; C, Box-counting method for texture images; D, ROI selected from a raw image of a non-malignant breast lesion; E, LoG of edges; and F, Box-counting method for texture images.
Feature values were extracted from the texture image; the extracted values included the mean, standard deviation (SD), skewness, and kurtosis. The quantitative effects of the fractal dimension image feature values for malignant and benign lesions were compared. The t-test explored the differences in feature values of images. Critical image feature values were determined through box-plot and receiver operating characteristic (ROC) curve analyses. The thresholds of image feature quantitative values for malignant and benign tumors were estimated using 95% confidence intervals (CIs).
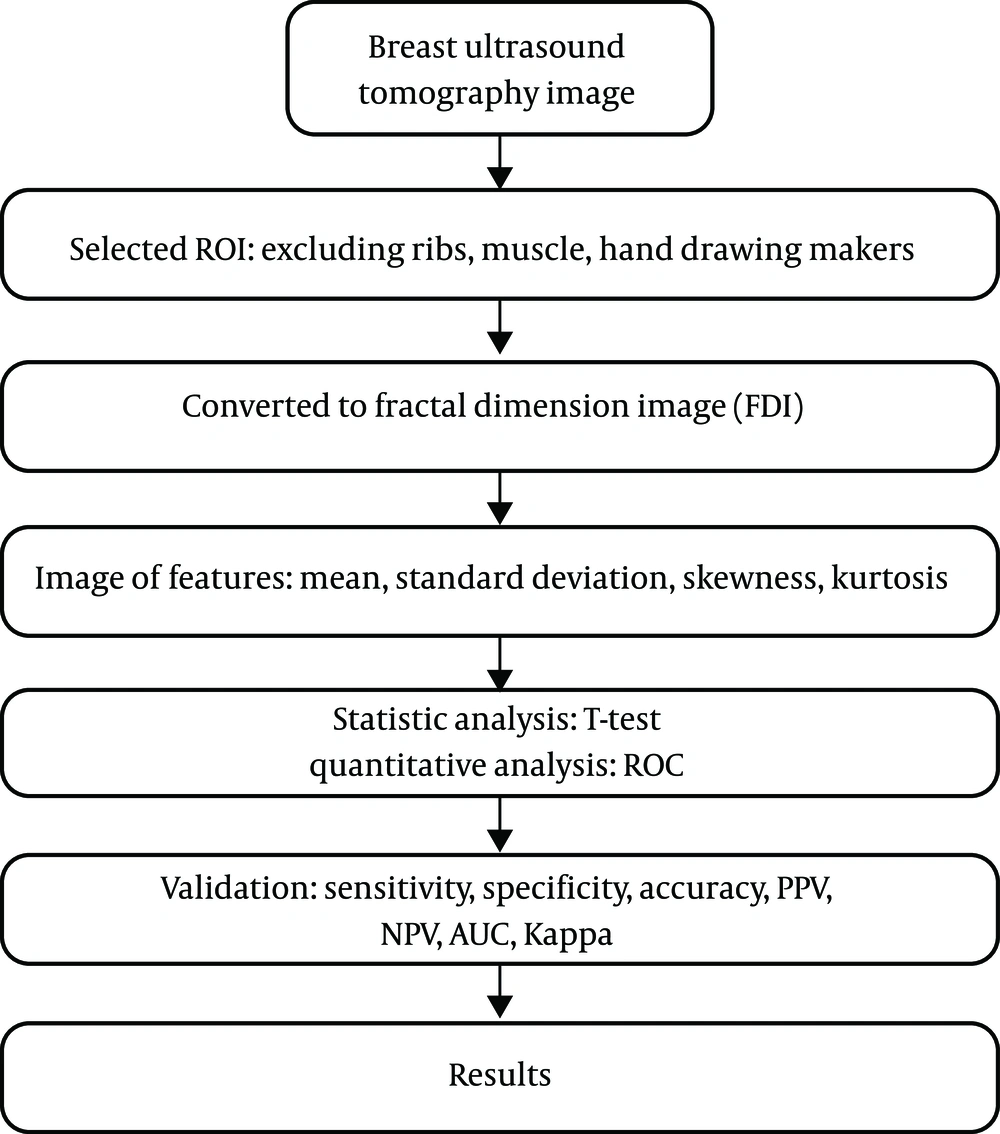
Additionally, a quantitative model for classifying malignant versus benign tumors was developed using logistic regression. The effectiveness of the quantitative analysis was examined using indicators such as sensitivity, specificity, accuracy, positive predictive value (PPV), negative predictive value (NPV), and Kappa consistency statistics. The aim was to identify image features that can facilitate a reasonable quantitative analysis of ultrasound images of malignant and benign lesions. The analysis flowchart is illustrated in Figure 3. Image features were calculated by examining fractal dimension images. The following describes the image features explored in this study (16-18).
3.3. Statistical Analysis
The t-test and ROC curve analysis were employed in this study. Effectiveness was examined by confusion matrix analysis. The true positive (TP), true negative (TN), false positive (FP), false negative (FN), sensitivity, accuracy, specificity, PPV, and NPV of quantitative analysis by breast ultrasound image features were investigated. The area under the ROC curve was used to examine the discrimination power of the ROC curve and was used in the Kappa consistency calculation. The area under the curve (AUC) and the Kappa value ranged from 0 - 1; larger values are preferred. Statistical analyses were performed using SPSS statistics for Windows, version 22.0. Armonk, NY: IBM Corp. IBM Corp. Released 2013. IBM Data with P values less than 0.05 were considered significant.
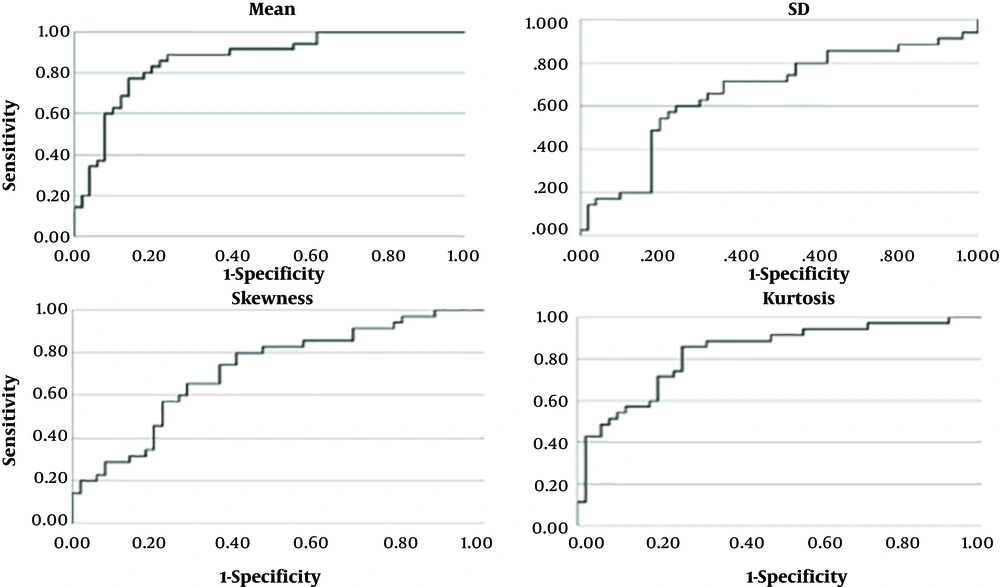
As determined by the t-test, using the mean, SD, skewness, and kurtosis of breast ultrasound fractal images could be effective in differentiating ultrasound images of malignant and benign lesions. The x-axes of the ROC plots (Figure 4) represent 1-specificity, and the y-axes represent sensitivity. The higher curve indicated that the feature value was more sensitive for the diagnosis of cancer by texture image. The skewing of the curve to the left indicated that the feature value was more accurate for the diagnosis of cancer by texture image. The power of the feature value in differentiating malignant versus benign lesions can be recognized using the area under the ROC curve. A greater area indicated that the classification performance was better, while a smaller area indicated that the classification performance was poor.
4. Results
Fractal image features of breast ultrasound were subjected to descriptive statistics, t-test, and AUC statistical analysis. The image features yielded means of 0.88 ± 0.05 and 0.79 ± 0.06, SDs of 0.24 ± 0.04 and 0.26 ± 0.03, skewness values of 0.30 ± 0.05 and 0.35 ± 0.07, and kurtosis values of -1.09 ± 0.28 and -0.72 ± 0.28 for malignant and benign images, respectively. There were overlaps in the upper and lower thresholds of 95% CIs of SD, skewness, and kurtosis; the differentiation power was not apparent. The upper and lower thresholds of the 95% CIs of the mean were 0.9 and 0.86, respectively, for malignant images and 0.81 and 0.77, respectively, for benign images. There were no overlaps in the thresholds, indicating that the mean could serve as a classification feature (Table 1).
| Image feature value | Breast disease | Cases | Values | Minimum | Maximum | P value |
|---|---|---|---|---|---|---|
| Mean | Malignant | 35 | 0.88 ± 0.05 | 0.77 | 1.02 | < 0.001 |
| Benign | 50 | 0.79 ± 0.06 | 0.64 | 0.93 | ||
| SD | Malignant | 35 | 0.24 ± 0.04 | 0.17 | 0.35 | 0.040 |
| Benign | 50 | 0.26 ± 0.03 | 0.17 | 0.32 | ||
| Skewness | Malignant | 35 | 0.3 ± 0.05 | 0.21 | 0.44 | < 0.001 |
| Benign | 50 | 0.35 ± 0.07 | 0.23 | 0.53 | ||
| Kurtosis | Malignant | 35 | -1.09 ± 0.28 | -1.69 | -0.33 | < 0.001 |
| Benign | 50 | -0.72 ± 0.28 | -1.37 | -0.11 |
Abbreviation: SD, standard deviation.
aValues are expressed as mean ± SD.
The mean of breast ultrasound fractal images showed higher distributions in the malignant group than the benign group. The distribution of SDs in the malignant group was smaller than that in the benign group. The skewness values were positive for both the malignant and benign groups, but the skewness values were lower in the malignant group compared to the benign group. The kurtosis values were platykurtic for both the malignant and benign groups; however, the kurtosis values were lower for the malignant group than for the benign group, which indicated that the distribution was dispersed.
4.1. Analysis of Differences in Image Feature Values
The t-test was utilized to determine whether the differences between malignant and benign feature values were significant (P < 0.05). The differences in mean, SD, skewness, and kurtosis, were significant (P < 0.05). The results of the abovementioned examination are provided in Table 1.
4.2. Cross-Comparisons of the Cut-Off Points
The mean, SD, skewness, and kurtosis values of breast ultrasound fractal images and the AUCs of their logistic regression models were 0.87, 0.67, 0.72, and 0.83, respectively (Table 2). Based on these results, the mean performed the best for LR-1 image classification. The mean, SD, skewness, kurtosis, and LR classification cut-off points were provided by the ROC coordinates. The appropriate cut-off points were 0.85+ for the mean, 0.25- for SD, 0.31- for skewness, and -0.94- for kurtosis. Through cross-comparison, the sensitivity, specificity, accuracy, PPV, and NPV of the feature values mean, SD, skewness, and kurtosis were obtained for validation (Table 2). The Kappa value can be utilized to express the consistency of the tool in repeated measurements.
| Item | Cut-off Point | Sensitivity | Specificity | Accuracy | PPV | NPV | AUC | Kappa |
|---|---|---|---|---|---|---|---|---|
| Mean | 0.85+ | 0.77 | 0.84 | 0.81 | 0.77 | 0.84 | 0.87 | 0.61 |
| SD | 0.25- | 0.71 | 0.64 | 0.58 | 0.47 | 0.60 | 0.67 | 0.34 |
| Skewness | 0.31- | 0.71 | 0.64 | 0.67 | 0.58 | 0.76 | 0.72 | 0.34 |
| Kurtosis | -0.94- | 0.74 | 0.76 | 0.75 | 0.74 | 0.81 | 0.83 | 0.50 |
Abbreviations: AUC, area under the curve of ROC; NPV, negative predictive value; PPV, positive predictive value; SD, standard deviation.
5. Discussion
This research utilized B-mode ultrasound images and estimated the edges using the LoG method. The box-counting method was employed to estimate texture images. The goal of this research was to increase the quantitative accuracy and to decrease the false-negative rate (FNR) and the false positive rate (FPR) of breast tissue imaging analysis. Finally, quantitative analysis was performed on the mean extracted from texture images. The results indicated that the mean and its logistic regression model yielded reasonable results and were feasible for clinical application. The cut-off points of the mean, SD, skewness, kurtosis were determined by ROC analysis to be 0.85, 0.25, 0.31, and -0.94, respectively. The AUC (area under ROC) provided by mean was 0.87. The AUC of presented methods was acceptable with compared literatures (19-21).
The analysis and discussion for each image feature are provided below:
(I) If the mean value of the texture image was higher than 0.85, the fractal image was brighter. In other words, there were more edges found in the breast ultrasound images. Thus, the textures were more complicated and inconsistent, which indicated a higher chance of the lesion being malignant. Analysis of the effectiveness of diagnosis by setting 0.85 as the threshold for the mean mentioned that the sensitivity was 0.77, the specificity was 0.84, the accuracy was 0.81, the PPV was 0.77, the NPV was 0.84, and the Kappa value was 0.61. The accuracy of the presented methods was reasonable compared with literatures (6, 22-24).
(II) If the SD of the texture image was less than 0.25, there was a high chance of the tumor being malignant. The analysis of the effectiveness of diagnosis by setting 0.25 as the threshold for the SD mentioned that the sensitivity was 0.71, the specificity was 0.64, the accuracy was 0.51, the PPV was 0.47, the NPV was 0.60, and the Kappa value was 0.34.
(III) If the image skewness was less than 0.31, there was a possible chance of the tumor being malignant. The analysis of the effectiveness of diagnosis by setting 0.31 as the threshold for the skewness mentioned that the sensitivity was 0.71, the specificity was 0.64, the accuracy was 0.67, the PPV was 0.58, the NPV was 0.76, and the Kappa value was 0.34.
(IV) If the image kurtosis was higher than -0.94, there was a greater chance of the tumor being malignant. The analysis of the effectiveness of diagnosis by setting -0.94 as the threshold for kurtosis showed that the sensitivity was 0.74, the specificity was 0.76, the accuracy was 0.75, the PPV was 0.74, the NPV was 0.81, and the Kappa was 0.50.
Study limitations in this research included different image borders, fractal dimensions, classification models, and increased sample size could yield higher value for reference in imaging diagnosis. Image edge detection could be performed using points, lines, and edges, which could be applied in detecting local pixel changes. LoG, Sobel edge detection, and Canny edge detection are methods for image segregation. Other than box-counting, the self-similar dimension, Hausdorff dimension, Fourier transform, wavelet transform, and other methods could be utilized to calculate fractal dimensions. Furthermore, experiments on prostheses can be performed to investigate the feasibility of different texture image processing methods (25).
In this study, only 85 cases were included, which is a relatively small number for statistical analysis. Continuous data collection could be performed to improve the accuracy of the study. Clinically, many medical imaging tools are available, including ultrasound, X-ray, MRI, positron emission tomography (PET), single-photon emission computed tomography, and CT. It is possible to perform texture analysis of the images generated by each of these types of imaging methods. If a texture-based CAD system can be developed, it could provide a reference for physicians (19-21).
In conclusion, in this research, we successfully exploited the mean of the fractal image and built a logistic regression model to classify malignant and benign B-mode ultrasound. Moreover, the quantitative analysis of texture images for the determination of malignant versus benign tumor is simple, feasible, reasonable, and accurate and could be employed as a reference for diagnosis when performing breast ultrasound texture analysis.
