1. Background
Breast cancer (BC) is the most common malignant tumor, leading to one fourth of cancer population in women among all presenting types of cancer (1). Human epidermal growth factor receptor type 2 (HER2) is frequently over-expressed in breast cancer (2), and is crucial in predicting survival and the effectiveness of HER2-targeted therapy (3-10). The level of HER2 expression could be determined by immunohistochemistry (IHC) and fluorescence in situ hybridization (FISH) of tumor samples (11, 12). However, previous data has demonstrated a discordance of about 20% between HER2 protein expression in primary tumors and tumors that have metastasized to the local lymph nodes (13-15) as determined by IHC or FISH. Thus, there is an urgent need to develop non-invasive imaging of HER2 status in both primary and synchronous axillary lymph node metastasis for accurate HER2 diagnosis.
Single-photon emission computed tomography (SPECT) was used to profile and delineate the radioactivity distributions within the body to probe its physiological and chemical processes. Radiolabeled antibodies, antibody fragments, affibodies and peptides have been used to design reliable and quantitative radiotracers to target HER2 for nuclear imaging (16-24). Although monoclonal antibodies have been traditionally used as tracing agents for HER2 in preclinical tests, the slow uptake in tumors and sustained retention in the circulation make it problematic for prompt localization of the target when they are conjugated with radio-isotopes as SPECT tracers (16). In contrast, HER2 affibodies can efficiently penetrate tumors, following which, they are rapidly cleared from the blood (25).
An affibody is a molecule that is structurally based on a non-immunoglobulin scaffold from the Z domain of protein A, which is a surface protein of the bacterium Staphylococcus aureus (26). In terms of its binding features, an affibody mimics a monoclonal antibody and can bind to HER2 with high affinity and specificity. In terms of size, an affibody only has a molecular weight of 6 kDa, which is far less than a monoclonal antibody of a molecular weight of 150 kDa. In terms of its stability, an affibody can withstand a variety of conjugation conditions, including extreme ranges of pH and elevated temperatures (27).
The technological approach of radiolabeled affibody has been used to detect HER2-positive cancer using the SPECT and positron emission computed tomography (PET) (18-24), which permits HER2 imaging in animal models and human subjects using Indium-111 (111In) for SPECT and 68Ga , 18F for PET within 24 hours of administering the radiolabeled probe (28-32). Although 99mTc is the most widely used nuclide for SPECT imaging that displays both an ideal gamma energy (140 KeV) and commercial availability (25), there are no clinical reports that have described the use of 99mTc labeled HER2 affibody in the current literature at this time. Zhang et al. labeled HER2 affibody with a 99mTc and tested its imaging properties in a HER2-expressing SKOV-3 xenografted murine model (25). Wallberg et al. selected a HER2 affibody that incorporated the C-terminal GGGC chelator for 99mTc labeling after evaluating several alternative HER2 affibody variants that incorporated the C-terminal GGSC, GGEC, GGKC or GSEC chelators. This optimal variant provided the lowest radioactive retention across all normal/unaffected organs and tissues including the kidneys in SKOV-3 xenografted mice (33).
2. Objectives
In the current study, HER2 affibody with endogenous chelating site was recombinantly expressed and purified. 99mTc was added to HER2 affibody at carboxyl-terminal cystein site-specifically. We tested the feasibility of this 99mTc-labeled HER2-specific affibody construct to image HER2-positive breast cancer in patients by the SPECT-CT approach. After SPECT imaging, the status of HER2 expression in breast cancer lesions was quantified by HER2 immunohistochemical staining during surgery. In addition, HER2 expression levels were correlated with the uptake of 99mTc-labeled affibody as measured by SPECT.
3. Patients and Methods
This study was performed according to the declaration of Helsinki ethical standards for experiments with humans and approved by Peking Union Medical College Hospital Ethical Committee of the Chinese Academy of Medical Sciences (protocol number JS-893). The protocol is also registered at: www.ClinicalTrials.gov (NCT 03546478). In addition, written and informed consent was obtained from each patient.
3.1. HER2 Affibody Recombinant Expression and Purification
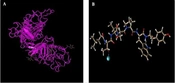
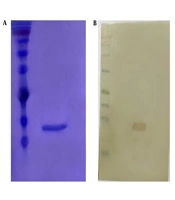
The HER2 affibody had an amino acid sequence of EHEHEAENKFNKEMRNAYWEIALLPNLTNQQKRAFIRSLYDDPSQSANLLAEAKKLNDAQGGGC and was used for endogenous labeling with 99mTc (27). The modified HER2 affibody gene was cloned into the pET22b (+) plasmid and transformed into competent BL21 (DE3) bacteria for recombinant DNA expression. The affibody was further purified using nickel affinity chromatography and identified by sodium dodecyl-sulfate polyacrylamide gel electrophoresis (SDS-PAGE) (27, 34).
3.2. Preparation of 99mTc-labeled HER2 Affibody
The 99mTc-labeled HER2 affibody was synthesized in a sterile hot chamber. Briefly, the affibody was diluted in phosphate buffered saline (PBS) to a concentration of 0.8 mg/mL and stored at -20°C before use. Fresh 99mTc was eluted into a sterile vacuum bottle from the 99Mo/99mTc generator using 5 mL of sterile saline. Two hundred microliters of 99mTcO4- (1.11 - 1.85 gigabecquerel [GBq]) was drawn for labeling from the bottle. Fifty microliter of the affibody was added to 200 µL of the degassed buffer (pH 6.6) containing 20 mmol/L sodium glucoheptonate and 10 mmol/L 4-(2-hydroxyethyl)-1-piperazineethane sulfonic acid (HEPES) in a 1.5 mL microtube, following which, 50 μg Tin (II) chloride (SnCl2) in 1 μL of 10% hydrochloric acid (HCl) and 99mTc were added. The mixture was kept at room temperature for an additional 10 minutes, and then further purified by NAP-5 gravity flow column (GE healthcare, USA). A 0.22 μm sterile ultrafine filter was then used for sterility purification.
3.3. Quality Control of 99mTc-labeled HER2 Affibody
Instant thin-layer chromatography (ITLC) (Bioscan 2000, USA) was used to test radio-chemical purity (RCP) and 99mTc-radiocolloid, and ITLC-silics gel (SG) strips (Gelman, USA) were used as the solid phase support (33). For RCP determination, PBS (10 mM) was used as the developing solution, the retention factor (Rf) value of the 99mTc labeled affibody was 0, and that of pertechnetate and glucoheptonate complexes of 99mTc was 1. For radiocolloid determination, a solution of 53% pyridine and 32% acetic acid was used as the developing solution, the Rf value of any technetium colloid was 0 and that of the 99mTc labeled affibody, pertechnetate or other complexes of 99mTc was 1. For clinical use, the RCP of the 99mTc-labeled HER2 affibody was always greater than 95 percent and the technetium colloid was usually below 0.5 percent.
3.4. In Vitro Characterization of 99mTc-labeled HER2 Affibody
For in vitro characterization, MDA-MB-361 breast cancer cells (HER2 positive) were cultured with L15 medium containing fetal bovine serum (20%), penicillin (100 U/mL) and streptomycin (100 μg/mL). The day before the binding test, one million MDA-MB-361 breast cancer cells that were suspended in two milliliters of L15 medium were dropped into each well of a six-well plate. The next day, the 99mTc-labeled HER2 affibody (19.2 GBq/μmol) was added to the wells with different final concentrations of 0.0004, 0.0021, 0,011, 0.054, 0.260, 1.310, 6.7, and 33 nmol/L in triplicate. The blocking wells were occupied with a 50-fold concentration of “cold” HER2 affibody and the 99mTc-labeled HER2 affibody. All radioactive wells were incubated at 4°C for 2 hours for cell binding, then washed with ice-cold PBS three times and detached with trysin buffer. The radioactivity of the 99mTc-labeled HER2 affibody that was bound to the cells was measured by a gamma counter.
3.5. In Vivo Characterization of 99mTc-labeled HER2 Affibody in Breast Cancer Models
For in vivo characterization, ten BALB/c nude mice were used for xenograft cancer modeling. Ten million MDA-MB-361 breast cancer cells in 50 µL of culture medium were mixed with the same volume of Matrigel (BD Sci., USA) and simultaneously seeded into each mouse axilla. When the diameter of the tumor was 5 mm, the 99mTc-labeled HER2 affibody was prepared as described above, and administered into the mouse tail vein with a single dose of 37 MBq (~0.36 nmol) in 0.2 mL of saline. Whole-body imaging of 99mTc-labeled HER2 affibody in breast cancer models was obtained at 1.0 and 4.5 hours post-injection for 20 minutes with the NanoSPECT/CT apparatus (Mediso, Hungary) under 10 percent chloral hydrate anesthesia (4μL/g body weight) given intraperitoneally. The in vivo specific binding of the 99mTc-labeled HER2 affibody was further confirmed by pre-injection of 200 μg of “cold” HER2 affibody and 37 MBq of 99mTc-labeled HER2 affibody two days later using the same mouse models and the same acquisition methods. CT was used to locate the tumor, and the heart, liver, lung, muscle, humeral bone and the brain. The In Vivo Scope Browser software was used to analyze focal radioactivity by manual drawing transversely for calculation of the target to non-target (T/NT) ratio.
3.6. Patient Enrollment
To study the diagnostic value of 99mTc-labeled HER2 affibody SPECT/CT, female patients were continuously enrolled from July 10 through November 20, 2015. The inclusion criteria included the following: an age of 28 years or older, suspected diagnosis of HER2-positive breast cancer, being able to provide specific disease information, and understanding the nature and importance of informed consent. The exclusion criteria included the following considerations: pregnancy, lactation, kidney failure, liver dysfunction, claustrophobia, and post mastectomy.
3.7. 99mTc-labeled HER2 Affibody Imaging in Breast Cancer Patients
Each patient was injected with 5.6 ± 0.8 MBq of the 99mTc-labeled HER2 affibody per kilogram (which was equivalent to approximately 50 μg) via the left basilic vein at the cubital fossa. Following intravenous injection of the 99mTc-labeled HER2 affibody, anterior and posterior SPECT scans of the whole body were acquired at 1.5 and 4.5 hours time-points for 20 minutes with a scanner equipped with dual-head γ-cameras and high-resolution collimators for low-energy gamma rays detection (Precedence, ADAC laboratories of Philips, USA). The SPECT scans were fused to CT scans for accurate localizing anatomical structure. All digital imaging data of breast cancer patients were transferred to a center workstation for detailed reading and analysis. In a fraction of the studied patients, 18F-fluorodeoxyglucose (18F-FDG) PET was undertaken as a control.
3.8. HER2 Immunohistochemical Staining
Lumpectomy was done under general anesthesia. Briefly, an incision was made to the breast with the intention of removing the tumor, along with a small rim of normal tissue that was located about the site of the tumor, in addition to lymph nodes in the underarm area. Representative tumor and lymph node samples that were obtained during surgery were fixed with neutral formalin for 2 days, then dehydrated with serial concentrations of alcohol, xylene and finally embedded tissues with paraffin wax (56 - 58°C) in blocks. Five-micrometer (µm) thick tissue sections were cut and mounted on glass slides. The endogenous peroxidase in sections were blocked with 3% H2O2 for 10 minutes and washed with PBS containing 1% bovine serum albumin (BSA) for three times. The blocked tissues were added with a mouse monoclonal antibody (Clone UMAB36, Origene, USA) that was raised against HER2 (1:200) and incubated at 37°C for 2 hours. After washing with PBS, the sections were incubated with secondary antibody (horseradish peroxidase [HRP]-conjugated, goat anti-mouse IgG) at room temperature for 30 minutes. After thorough washing, the tissues were added with 3% diaminobenzidine and 0.3% H2O2 for color development. Light microscopy was used to observe stained tissues and six fields of each section were randomly chosen for analysis by the same pathologist with a track-record of more than 15 years of experience.
3.9. Data Analysis
SPECT images were analyzed by two experienced researchers. The sources of SPECT and CT images were masked to these researchers. In visual characterization, the different organ images, number of lesions, and imaging time-points were documented. The number of lesions included primary lesions and lymph node metastases. For quantitative determination, the 4.5 h images were adopted for analysis because these images were better than 1.5 h images. The radioactivity of the 99mTc-labeled affibody uptake in breast cancer lesions and the surrounding muscle were measured and the tumor-to-background (T/B) ratios of SPECT images at the 4.5 h time-point were calculated by the same researchers.
3.10. Statistical Analysis
The dissociation constant (Kd) was calculated by specific binding of 99mTc-labeled HER2 affibody to HER2 positive cells (total binding minus nonspecific binding) with GraphPad Prism 5 software (CA, USA). The sensitivity, specificity, and accuracy values (%) of 99mTc-labeled affibody in diagnosing HER2 positive breast cancer were also calculated with GraphPad Prism 5 software. Uni-variate analysis enabled correlating SPECT imaging of the T/B ratios and HER2 IHC grades.
4. Results
4.1. In Vitro Characterization of the 99mTc-labeled HER2 Affibody
The 99mTc-labeled HER2 affibody bound to MDA-MB-361 breast cancer cells specifically with a Kd value of 1.7 nmol/L. The final purified mass concentration was 0.5 mg/mL. The synthesis time of the 99mTc-labeled HER2 affibody was usually less than 20 minutes. The labeling yield and final RCP were 99.5 ± 0.3 percent. The RCP of 99mTc-labeled HER2 affibody were 98.4 ± 0.2 percent and 96.3 ± 0.7 percent respectively after 3 hours incubation at 37°C with PBS and serum, and were 98.1 ± 0.6 percent and 95.0 ± 1.0 percent respectively after 6 hours incubation at 37°C with PBS and serum, which indicate 99mTc- affibody was stable both in PBS and serum.
4.2. In Vivo Characterization of the 99mTc-labeled HER2 Affibody
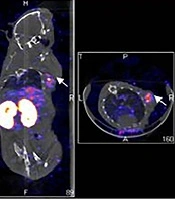
The MDA-MB-361 mouse model of a breast cancer xenograft was clearly visualized by the NanoSPECT/CT at 1.0 hours and 4.5 hours after 99mTc- labeled HER2 affibody injection (Figure 1A and B). The radioactivity in the thyroid gland was negligible. By contrast, the radioactivity in the kidney and urinary bladder was prominent, which indicated that the urinary tract served as the main excretion pathway for 99mTc- labeled HER2 affibody. In the blocking group with “cold” HER2 affibody, the MDA-MB-361 breast cancer xenograft was not clearly visualized at both 1.0 hrs and 4.5 hrs after 99mTc- labeled HER2 affibody injection (Figure 1C and D). The T/NT ratios of the cancer to the heart, liver, lung, muscle, bone and brain were 7.61 ± 0.56, 1.81 ± 0.60, 8.95 ± 1.13, 10.62 ± 1.78, 11.42 ± 2.07, and 20.08 ± 6.12, respectively. In the blocking group, the T/NT ratios of the cancer to the heart, liver, lung, muscle, bone and brain were decreased to 2.42 ± 1.02, 0.60 ± 0.23, 3.05 ± 1.38, 8.16 ± 2.66, 2.76 ± 0.48, and 5.24 ± 2.17, respectively (F = 29.38; P < 0.05).
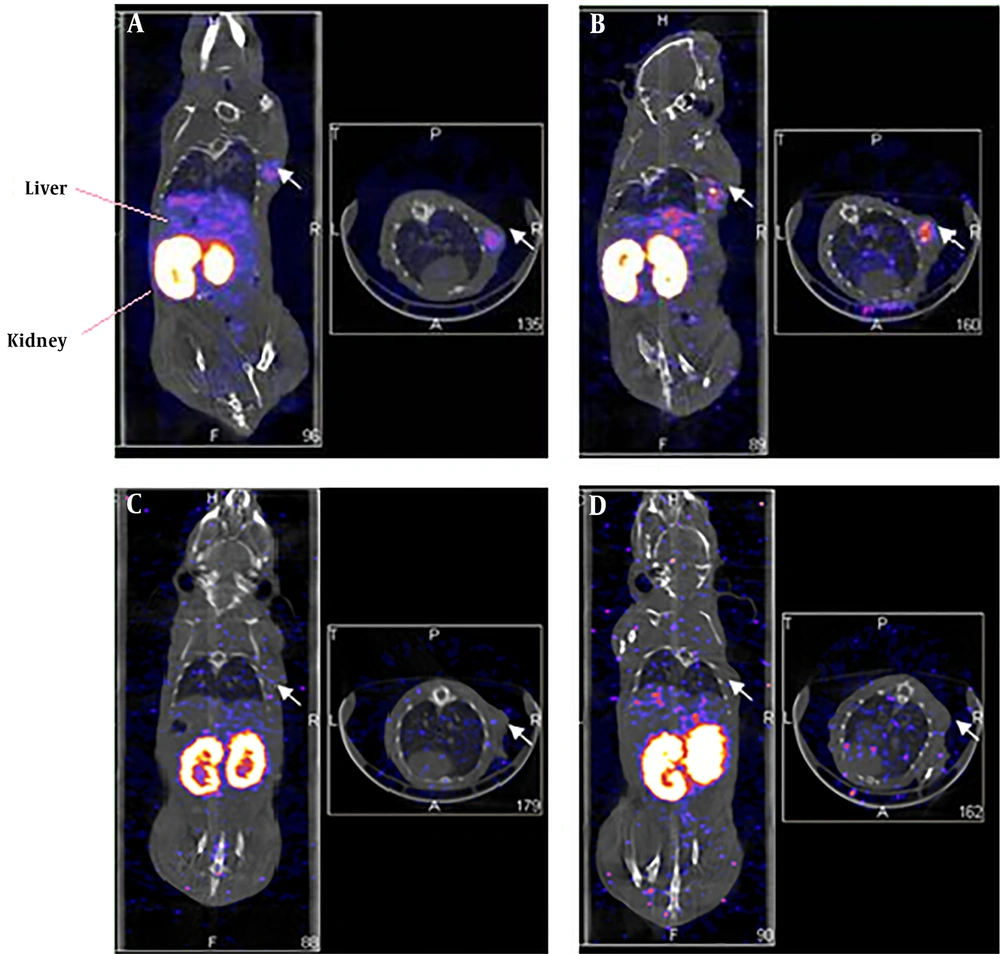
Figure 1.
Single-photon emission computed tomography (SPECT)/CT imaging of 99mTc-labeled human epidermal growth factor receptor 2 (HER2) affibody in human HER2-positive breast carcinoma in xenografted mice (left: coronal plane; right: transverse plane). A and B, Images of 99mTc-ABH2 at 1h (A) and 4.5h (B), white arrows point radioactivity accumulated MDA-MB-361 breast carcinoma. C and D, Blocking images of 99mTc-ABH2 at 1h (C) and 4.5h (D), radioactivity was not accumulated in MDA-MB-361 breast carcinoma.
4.3. Evaluation of Patients with Suspected Breast Cancer
Information regarding a detailed pathological diagnosis of all patients following SPECT/CT imaging is described in Table 1. For SPECT/CT imaging, 30 female patients (aged 29 - 76 years; mean, 48.2 ± 11.1 years) with suspected HER2-positive breast cancer were enrolled into the study. In patient No. 1, primary lesions and lymph node metastases could be clearly seen by 99mTc-labeled affibody SPECT/CT imaging (Figure 2A and B). Positive primary tumor foci could be clearly observed between 1.5 to 4.5 hours after intravenous injection of the 99mTc-labeled affibody. At the 4.5 hours time-point, a HER2 positive lesion was optimally visible by maximum intensity projection (MIP) imaging than at the 1.5 hours time-point (T/B: 6.0 ± 5.6 vs. 4.6 ± 4.1, P < 0.05). 99mTc-labeled affibody accumulated in primary lesions with a very high T/B ratio (23.8 ± 2.9), while the lymph node metastases were also HER2 positive. The T/B ratios of the axillary lymph nodes and supraclavicular lymph nodes were high (i.e., 6.5 ± 1.4 and 6.1 ± 1.3 respectively; Figure 2C - E). MIP images (Figure 2A and B) showed that breast cancer cells migrated from the right breast duct to the axillary and supraclavicular lymph nodes. HER2-positive lesions were clearly located when the SPECT images fused with the traditional CT images. In the transverse plane, the radioactivity that was measured in the breast cancer lesion was higher than that quantified in the heart (T/B ratio = 1.5 ± 0.9) and normal breast tissues (T/B ratio = 1.0 ± 0.2) (Figure 2C), which indicated that the 99mTc-labeled affibody was specifically bound to the HER2 target in the circulation. In the coronal plane, the radioactivity in the liver (T/B ratio = 21.9 ± 3.5) was comparable with that found in the breast lesion. By contrast, the radioactivity measured in the kidneys (57.3 ± 14.6) was much higher than that measured in the breast lesions (Figure 2F). In the sagittal plane, uptake of radioactivity by the breast cancer lesion was prominent (Figure 2G). The primary lesion and lymph node metastases were surgically resected and histologically evaluated and diagnosed as invasive ductal carcinoma. IHC results indicated that the primary lesion and lymph node metastases were all HER2 3+ (Figure 2H and I).
Table 1.
Patient Information and Diagnosis
| Demographic information and diagnosis | Values (n = 30) |
|---|---|
| Age, y | |
| Range | 29 - 76 |
| Mean ± SD | 48.2 ± 11.1 |
| Diagnosis, % | |
| Invasive ductal carcinoma (IDC) | 83.33 |
| Ductal carcinoma in situ (DCIS) | 6.67 |
| Metaplastic breast cancer (MBC) | 3.33 |
| Invasive lobular carcinoma (ILC) | 3.33 |
| DCIS + IDC | 3.33 |
Abbreviation: SD, standard deviation.
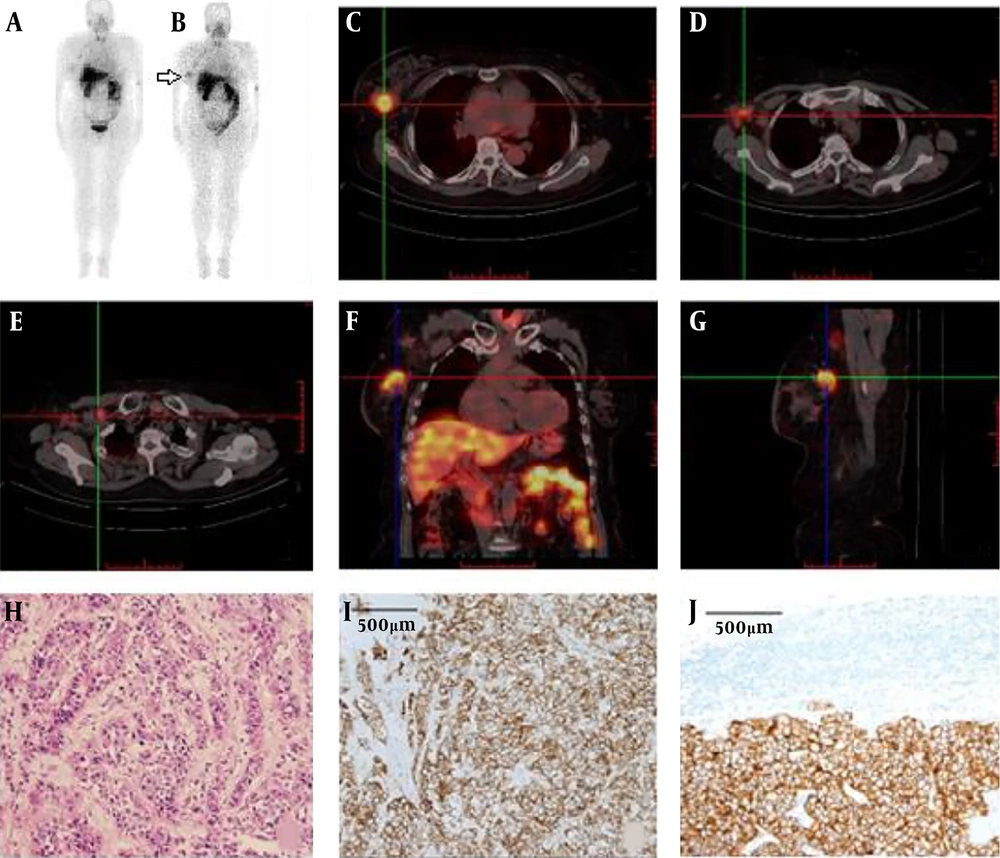
Figure 2.
Maximum-intensity-projection (MIP) images obtained from patient No. 1 (i.e., at 60 years of age, and body weight (BW) of 70 kg) at 1.5 h (A), and 4.5 h (B) following administration of 370 MBq (50 μg) of 99mTc-labeled affibody. The breast cancer lesion (C), axillary lymph node (D) and supraclavicular lymph node (E) were clearly visible by transverse plane sectioning. Uptake of non-specific radioactivity by the liver and intestine were noted by coronal plane image analysis (F). The breast cancer lesion displaying human epidermal growth factor receptor 2 (HER2) overexpression was prominent in the sagittal plane (G). All lesions were surgically removed and histologically diagnosed as invasive ductal carcinoma (H). Analysis of HER2 immuno-histochemical staining of the primary tumor (I) and lymph node (J) of patient No. 1, showing (3+) staining intensity.
In contrast, some of the HER2 negative primary breast cancers with/without lymph node metastases did not retain the 99mTc-labeled affibody when analyzed by SPECT/CT imaging. The 99mTc-labeled affibody SPECT/CT imaging in patient No. 22 showed that uptake of radioactivity in the left breast nodule was very low (T/B ratio = 0.8 ± 0.1), and was comparable to that found in the muscle (T/B ratio = 0.9 ± 0.2) and lung (T/B ratio = 0.7 ± 0.1) (Figure 3A). Post-surgical IHC staining indicated that this invasive ductal carcinoma was HER2 negative (Figure 3B). In addition, the accumulation of the 99mTc-labeled affibody in patient No. 8 was also negligible (T/B ratio = 0.3 ± 0.0) (Figure 3A and C). Follow-up staining by IHC with the HER2-specific antibody confirmed that this invasive lobular carcinoma was negative (Figure 3D).
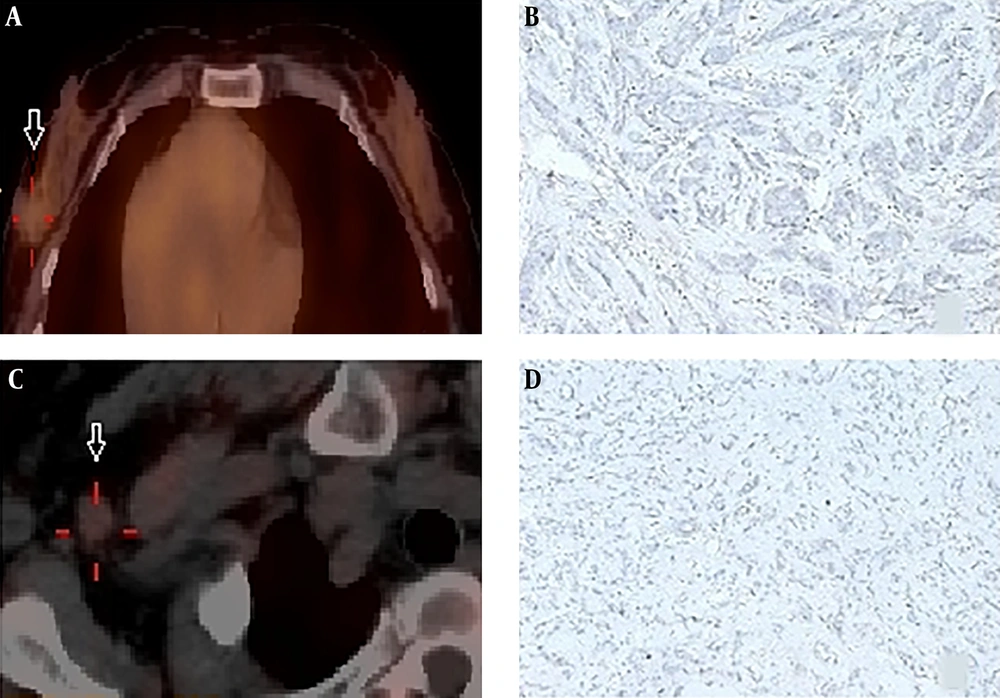
Figure 3.
Negative image (A) in SPECT with 99mTc-labeled affibody in breast cancer lesion of an invasive ductal carcinoma (IDC) (white arrow) patient (No. 22) showed negative pattern of staining in human epidermal growth factor receptor 2 (HER2) immunohistochemistry (B); A patient (No. 8) diagnosed as invasive lobular carcinoma (ILC) also displayed negative uptake with 99mTc-labeled affibody (white arrow) (C) and matched negative HER2 expression (D).
In Patient No. 26, both 99mTc-labeled affibody SPECT and 18F-FDG PET were undertaken. Bilateral HER2 affibody uptake was visualized (Figure 4A and B); however, only a right faint 18F-FDG uptake was seen in bilateral breast cancer patients when screened by ultrasound. However, the liver lesions that were identified by 18F-FDG PET could not be characterized by 99mTc-labeled affibody SPECT (Figure 4A and C).
![Patient No. 26 (invasive ductal carcinoma [IDC]) showed bilateral human epidermal growth factor receptor 2 (HER2) affibody uptake (white arrow) (A, B) and only faint <sup>18</sup>F-fluorodeoxyglucose (<sup>18</sup>F-FDG) uptake was shown on the right (C) by bilateral HER2 positive breast cancer lesions.](https://brieflands.com/journals/ijradiology/articles/96419/figures/iranjradiol-96419-g004-F4-preview.webp "Patient No. 26 (invasive ductal carcinoma [IDC]) showed bilateral human epidermal growth factor receptor 2 (HER2) affibody uptake (white arrow) (A, B) and only faint <sup>18</sup>F-fluorodeoxyglucose (<sup>18</sup>F-FDG) uptake was shown on the right (C) by bilateral HER2 positive breast cancer lesions.")
Figure 4.
Patient No. 26 (invasive ductal carcinoma [IDC]) showed bilateral human epidermal growth factor receptor 2 (HER2) affibody uptake (white arrow) (A, B) and only faint 18F-fluorodeoxyglucose (18F-FDG) uptake was shown on the right (C) by bilateral HER2 positive breast cancer lesions.
In the quantitative analysis, a breast lesion with 99mTc-labeled affibody uptake that was shown to be 2.4-fold higher than the surrounding muscle (T/B ≥ 2.4) was arbitrarily considered positive. By contrast, a lesion with a T/B < 2.4 was arbitrarily considered negative. The choice of the threshold was dependent on data listed in Table 2. The nonspecific retention of 99mTc-labeled affibody in the liver, spleen and heart limited the application of the tracer in tracing metastasis to these organs, while low accumulation of 99mTc-labeled affibody in the muscle and bone would be helpful in identifying metastasis to these tissues (Figure 5).
Table 2.
Patient Diagnosis with HER2 Imaging and Pathological Analysis
| PN | CL | LN | H | Pathology (IHC, FISH) | SPECT | SPECT vs. IHC | Size (mm) | T/B |
|---|---|---|---|---|---|---|---|---|
| 1 | R | M | IDC | +(3+) | + | TP | 41 | 23.8 |
| 2 | L | M | DCIS | +(3+) | - | FN | 10 | 1.8 |
| 3 | L | IDC | +(3+) | + | TP | 26 | 5.7 | |
| 4 | R | IDC | -(1+) | + | FP | 30 | 4.4 | |
| 5 | L, R | IDC | +(3+) | - | FN | 10 | 1.2 | |
| 6 | R | IDC | -(2+,-) | - | TN | 19 | 2.1 | |
| 7 | R | M | DCIS | +(2+,+) | + | TP | 31 | 4.3 |
| 8 | R | ILC | -(-) | - | TN | 11 | 0.3 | |
| 9 | R | IDC | -(-) | - | TN | 33 | 2.1 | |
| 10 | R | IDC | -(2+,-) | + | FP | 16 | 12.9 | |
| 11 | L | MBC | -(-) | + | FP | 38 | 5.8 | |
| 12 | R | M | IDC | +(2+,+) | + | TP | 27 | 4.2 |
| 13 | R | IDC | -(2+,-) | + | FP | 14 | 4.3 | |
| 14 | R | IDC | +(3+) | + | TP | 27 | 3.6 | |
| 15 | L | IDC | +(3+) | + | TP | 13 | 3.9 | |
| 16 | R | M | IDC | +(3+) | + | TP | 31 | 3.5 |
| 17 | L | IDC | -(-) | - | TN | 22 | 2.2 | |
| 18 | R | M | IDC | +(3+) | + | TP | 20 | 4.2 |
| 19 | L, R | IDC | -(-) | + | FP | 15 | 4.3 | |
| 20 | L, R | IDC | -(-) | - | TN | 16 | 2.0 | |
| 21 | L | M | DCIS (30% IDC) | -(1+) | + | FP | 40 | 8.6 |
| 22 | L | IDC | -(-) | - | TN | 13 | 0.8 | |
| 23 | L | IDC | +(3+) | + | TP | 50 | 4.8 | |
| 24 | L | M | IDC | -(1+) | - | TN | 27 | 2.3 |
| 25 | L, R | IDC | -(-) | - | TN | 17 | 2.1 | |
| 26 | L, R | IDC | +(3+) | + | TP | 32 | 4.9 | |
| 27 | R | IDC | +(3+) | + | TP | 24 | 4.4 | |
| 28 | L, R | IDC | +(2+,+) | + | TP | 21 | 4.7 | |
| 29 | L | IDC | +(2+,+) | - | FN | 11 | 1.9 | |
| 30 | L | IDC | -(2+,-) | - | TN | 11 | 1.4 |
Abbreviations: CL, cancer location; DCIS, ductal carcinoma in situ; FISH, fluorescence in situ hybridization; FN, false-negative; FP, false-positive; H, histology; HER2, human epidermal growth factor receptor 2; IDC, invasive ductal carcinoma; IHC, immunohistochemistry; ILC, invasive lobular carcinoma; L, left breast; LN, lymph node; M, lymph node metastasis; MBC, metaplastic breast cancer; NA, not applicable; ND, not done; PN, patient number; R, right breast; SPECT, single-photon emission computed tomography; T/B, tumor to background ratio; TN, true negative; TP, true-positive.
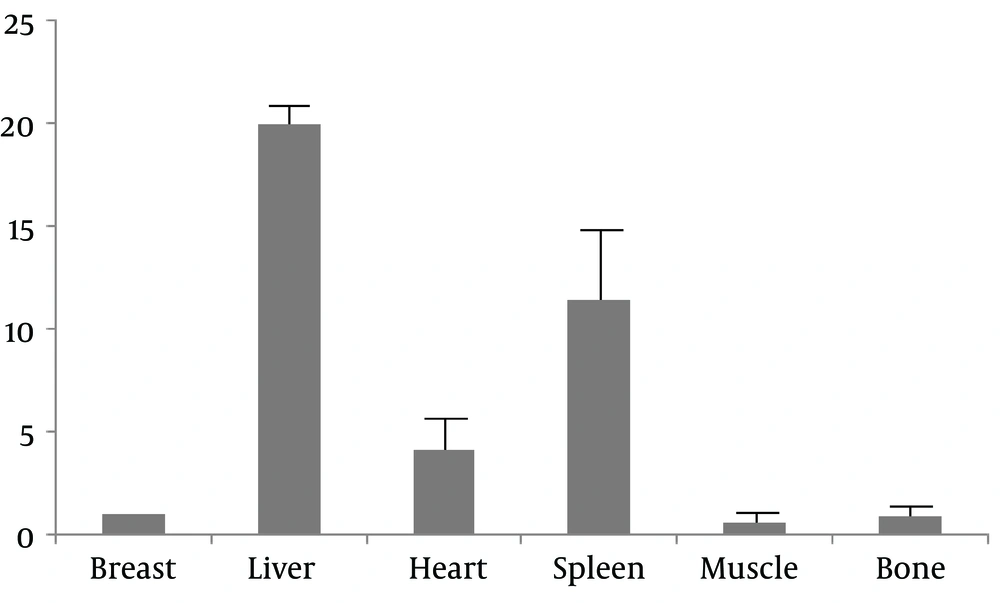
Figure 5.
The bio-distribution of 99mTc-labeled human epidermal growth factor receptor 2 (HER2) affibody in normal tissues (Y axis: organ or tissue to breast ratio)
4.4. The Correlation Between HER2 Imaging and HER2 IHC
Totally, thirty patients were submitted to 99mTc-labeled affibody SPECT/CT imaging, surgery and HER2 IHC staining, and all were included in the correlation analysis. In the IHC group, 22 patients were HER2 positive, and included the following: 11 patients were scored as HER2 3+, eight patients were scored as HER2 2+ including four FISH positive patients and four FISH negative patients, and three patients were scored as HER2 1+. Additionally, eight patients were found to be HER2 negative (Table 2).
In the HER2 imaging group, 18 patients were identified as HER2 positive and 12 patients were identified as HER2 negative. Six patients that were originally classified as HER2 IHC negative were re-classified as HER2 imaging positive, while three patients that were originally classified as HER2 imaging negative were re-classified as HER2 IHC positive. The HER2 status of the remaining 21 patients was consistent when contrasting HER2 imaging and HER2 IHC (i.e., 12 were true positive and nine were true negative) (Tables 2 and 3). False negativity of HER2 imaging might be related to the tumor size since the diameter of all lesions in three cases was less than 12 mm (i.e., two cases were 10 mm and one case was 11 mm). No false negatives were seen when the diameter of the breast cancer lesion was greater than 12 mm, and even a lesion with a size of 13 mm could be accurately stratified -as was the case with patient No.15.
The overall sensitivity, specificity and accuracy were respectively 80 percent (12/15), 60 percent (9/15), and 70 percent (21/30) when the tumor diameter threshold was not set (Table 3). The sensitivity increased to 100 percent (18/18), and the accuracy increased to 84.0 percent (21/25) in examined tumors when the tumor diameter threshold was set as 12 mm.
Table 3.
Quadruple Tabular Form of HER2 Imaging and Pathological Diagnosisa
| Gold standard | Total | ||
|---|---|---|---|
| IHC positive | IHC negative | ||
| Test standard | |||
| SPECT positive | 12 | 6 | 18 |
| SPECT negative | 3 | 9 | 12 |
| Total | 15 | 15 | n = 30 |
Abbreviations: HER2, human epidermal growth factor receptor 2; IHC, immunohistochemistry; SPECT, single-photon emission computed tomography.
aSensitivity = 80.0%; Specificity = 60%; Accuracy = 70.0%.
5. Discussion
In our prior studies, HER2 affibody contained an endogenous GGGC chelating sequence that was expressed at the carboxyl-terminus, which was also labeled with technetium-99m giving an RCP that exceeded 95 percent. This was a prerequisite for the current clinical investigation.
In this study, in vivo imaging of this type of 99mTc-labeled affibody in breast cancer patients that was examined by SPECT/CT, indicated the feasibility of attempting to clinically translate the endogenously chelating HER2 affibody. The diagnostic sensitivity of 99mTc-labeled affibody could be improved under conditions where tumor size was included during the time of patient enrollment to the study.
However, non-specific retention of 99mTc-labeled affibody in the liver was relatively high, and was secondary to that of the kidneys. The radioactivity in the liver, and kidneys were not ideally cleared from 1.5 to 4.5 hours after 99mTc-labeled affibody administration, which might limit the characterization of HER2 expression following abdominal metastasis of breast cancer (Figure 1A and B). A higher dose might provide improved results and reduced hepatic uptake, which suggested that the dose used in this study needed to be optimized (21).
In the presence of N-terminal HEHEHE modification, the chelator specificity of affibody labeling with 99mTc is partially lost (27). Elevated hepatic uptake as well as uptake in the thyroid might be explained by a suboptimal format of the affibody molecule. The labeling conditions should be optimized in follow-up studies with the intention of reducing the issue of non-specific radioactivity in the liver. We found that renal uptake of 99mTc-labeled affibody was the highest, and concordant with similar findings from animal models (35).
From the MIP imaging analysis of the patient, we recognized that the 99mTc-labeled affibody was predominantly cleared from the renal - urinary tract, and was secondarily cleared from the hepatic - biliary - gastrointestinal system. The kidneys, urinary bladder, liver, spleen, and intestinal tract all significantly retained the 99mTc-labeled affibody. The oral and nasal cavity, salivary glands and thyroid, also showed measurable radioactivity, and the thyroid gland was clearly visible. In addition, the strong digestive uptake of the radioactivity indicated that the free 99mTc should be removed completely from the labeling mixture before intravenously administering the construct in future investigations. Moreover, the possible instability of 99mTc-labeled affibody could not be ruled out in this study. In this single-center prospective clinical trial, the size of the enrolled and studied patient population was comparatively small. Moreover, follow-up therapy and survival time were not included in this study.
Overall, the low radioactive background in the breast tissue regions allowed detection of HER2 breast cancer lesions with a high target-to-background ratio. In the current study, 99mTc-labeled affibody showed improved clinical convenience as defined by ease of labeling, extended biological half-life, and wider availability (36).
Additionally, 99mTc-labeled HER2 affibody SPECT/CT imaging of HER2-positive breast cancer might prove useful in the setting of patient stratification for targeted therapy, although we recognize that this approach might exhibit a lower sensitivity for lesion detection as compared with the HER2 affibody PET/CT approach. In addition, we recognize that 99mTc-labeled HER2 affibody SPECT/CT imaging of HER2-positive breast cancer performs comparatively poorly in detecting small-sized lesions, hence the use of this approach is not recommended in patients that present with small volume disease.
In a previously published report, the 99mTc-labeled tracer showed fewer lesions by SPECT/CT imaging under conditions where the tumor diameter was less than 10 mm (37). The correlation between T/B ratio and HER-2 expression in tissues was not statistically significant (P = 0.231). This indicated that 99mTc-labeled HER2 affibody SPECT imaging was an independent mode of assessment from that provided by HER2 immunohistochemical analysis. The four false positives (out of 30 patients) might mean that IHC missed 13% (4/30) HER2+ breast cancer.
In conclusion, the 99mTc labeled HER2 affibody approach was first used to image patients with HER2- positive breast cancer lesions. This approach might also provide imaging guidance for HER2 targeted therapy in breast cancer patients. The non-specific uptake of this radiotracer in the liver might hamper the detection of HER2 positive liver metastasis in breast cancer. The format of this HER2 affibody molecule, the dose of 99mTc-labeled HER2 affibody and the labeling conditions for SPECT/CT imaging in humans should be optimized for future clinical applications.