


1. Background
Today, ultrasonography (US) is the most common imaging technique used for the detection and diagnosis of thyroid nodules. Subacute thyroiditis (SAT) is a self-limiting inflammatory disease of the thyroid gland, which is also known as granulomatous thyroiditis (1). On the other hand, papillary thyroid carcinoma (PTC) is the most common endocrine malignancy, which originates from thyroid follicular cells (2). Although pain and inflammatory swelling in the acute phase are conducive to a differential diagnosis of SAT, asymptomatic SAT (aSAT), which appears hypoechoic in images with solid characteristics, is often difficult to distinguish from PTC (3). However, the aspect ratio and calcification of nodules may contribute to the differential diagnosis of PTC and aSAT.
A considerable number of PTC cases lack malignant features (e.g., a taller-than-wide shape and lack of microcalcification). A fine-needle aspiration biopsy (FNAB) may be performed for these cases, which in turn increases pain and physical suffering. Therefore, a new non-invasive assessment method is urgently needed. Contrast-enhanced ultrasonography (CEUS), due to its unique ability to represent the hemodynamics of a given lesion, has been widely used in recent years against many diseases, such as liver tumors, prostate tumors, and thyroid nodules, to analyze microcirculation and nutritional supply (4-6). However, in clinical practice, this approach still has some shortcomings due to its poor repeatability and excessive dependence on the operator’s subjective experience (7).
In recent years, quantitative CEUS analysis, as a non-invasive technique, has been widely used to evaluate blood perfusion changes in various lesions (8). Due to its adequate safety, high reproducibility, and rigorous precision, this method is being increasingly employed for the analysis of thyroid diseases (9, 10). Moreover, a quantitative CEUS analysis can represent multiple parameters and provide information that operators cannot obtain in a CEUS examination; therefore, it is considered to be more informative.
Pathologically, the hemodynamics of SAT nodules differ from those of PTC nodules. To the best of our knowledge, there is no study in the literature using quantitative CEUS analysis to discriminate aSAT from PTC nodules. The present study investigated whether a quantitative CEUS analysis can be applied for distinguishing aSAT from PTC to minimize the use of invasive procedures and improve the diagnostic accuracy.
2. Objectives
In clinical practice, aSAT without inflammatory features is often difficult to distinguish from PTC nodules, even with ultrasonography. Under certain circumstances, FNAB is performed, which is known to increase the patient’s physical suffering and pain. Therefore, this study aimed to investigate the value of quantitative CEUS analysis in discriminating aSAT from PTC nodules and to discover new indicators to minimize the use of invasive procedures and improve the diagnostic accuracy.
3. Patients and Methods
This retrospective study was approved by the local ethics committee. Written informed consent was obtained from each participant.
3.1. Study Population
From September 2018 to October 2019, a total of 38 patients with aSAT nodules and 25 patients with PTC nodules were retrospectively reviewed. The inclusion criteria were as follows: (1) a pathologically proven diagnosis by surgery or FNAB (FNAB has higher sensitivity and specificity than surgery in evaluating thyroid tumors) (11); (2) asymptomatic patients (no symptoms of pain or inflammatory swelling); (3) complete visualization of the lesion in a single US plane; (4) undergoing conventional US and CEUS examination; and (5) lesion classification as Thyroid Imaging Reporting & Data System (TI-RADS) IV or higher, based on the American College of Radiology (ACR) system.
On the other hand, the exclusion criteria were as follows: (1) severe comorbidities and complications; (2) contraindications to the contrast agent; (3) other malignant tumors outside the thyroid; (4) a fitted quantitative CEUS analysis curve < 75% (the degree of fitness was the normalized distance between the fitted curve and the raw data; when the degree of fit was < 75%, the fitted curve did not represent the original curve). Based on these strict criteria, we excluded eight aSAT patients and two PTC patients from further analysis. Finally, 30 aSAT patients and 23 PTC patients remained in the study.
3.2. Conventional US and CEUS Examinations
Conventional US and CEUS examinations were performed, using a MyLab Twice US system (Esaote S.p.A, Genova, Italy), equipped with a linear volumetric array transducer (BL433). Two trained sonographers (with > 10 years of experience) performed all scans and examinations; the B-mode gain was set at 50%. The frequency range of the transducer was 4 - 13 MHz, and the frequency was set at 5 MHz. For CEUS examinations, a low mechanical index (MI = 0.1) was used, and the focus point was always placed deeper than the nodule under examination to minimize microbubble disruption. The transducer was placed on the long axis to avoid the blood vessels and select the largest section of the lesion.
The standard equipment setting was applied for color Doppler examinations of the thyroid. A bolus, consisting of 2.0 mL of the contrast agent (SonoVue, Bracco, Italy), was intravenously injected, followed by 5 mL of 0.9% saline flush, using a 20-gauge peripheral intravenous cannula. In the meantime, the US machine timer was switched on, and the imaging plane was kept as stable as possible. Each contrast imaging acquisition took at least one minute after the bolus injection. The image was digitally stored as raw data on the internal hard drive and then exported to an external workstation for subsequent analyses.
3.3. Analysis of Conventional US and CEUS Images
The conventional US and CEUS images were analyzed by two operators, who were blinded to the clinical and baseline imaging information. If there was any disagreement, another senior operator would review the image until a consensus was achieved. Based on the conventional grayscale images, the maximum lesion diameter, shape (taller than wide), margin (well or poorly defined), calcification (no calcification, microcalcification, or macrocalcification), echogenicity (markedly hypoechoic or hypoechoic), the presence of lymph nodes (absent or present), and vascularity (none, peripheral, and/or internal) were determined in both aSAT and PTC patients. Besides, the lesion characteristics from CEUS images, including enhancement type (hypo-, hyper-, or isoenhancement) and degree of contrast agent distribution (diffuse homogeneous or heterogeneous), were gathered. Two trained operators (with >10 years of experience) performed all analyses.
3.4. Quantitative CEUS Analysis
A quantitative CEUS analysis was performed in SonoLiver version 1.1 (TomTec Imaging System, Munich, Germany). One operator (with > 3 years of experience) performed all analyses to exclude bias by different operators. To obtain robust and accurate results, three regions of interest (ROIs) were set: (1) the entire ROI, covering the entire lesion area; (2) peripheral ROI, located in the peripheral part of the lesion; and (3) central ROI, located in the central part of the lesion. Meanwhile, one control area with the same depth was set adjacent to the lesion, and then, four time-intensity curves and fitting curves were automatically generated by the computer (Figure 1).
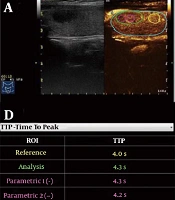
 analysis of an aSAT nodule in a 54-year-old woman. A, Schematic representation of regions of interest (ROIs), including the whole ROI (green rim), peripheral ROI (magenta dotted rim), central ROI (magenta solid rim), and control ROI (yellow rim). B, Time-intensity curves of four ROIs. C, RT of four ROIs. D, TTP of four ROIs. E, IMAX of four ROIs. F, mTT of four ROIs (aSAT, asymptomatic subacute thyroiditis; RT, rise time; TTP, time to peak; IMAX, maximum intensity; mTT, mean transit time).")
Quantitative contrast-enhanced ultrasonography (CEUS) analysis of an aSAT nodule in a 54-year-old woman. A, Schematic representation of regions of interest (ROIs), including the whole ROI (green rim), peripheral ROI (magenta dotted rim), central ROI (magenta solid rim), and control ROI (yellow rim). B, Time-intensity curves of four ROIs. C, RT of four ROIs. D, TTP of four ROIs. E, IMAX of four ROIs. F, mTT of four ROIs (aSAT, asymptomatic subacute thyroiditis; RT, rise time; TTP, time to peak; IMAX, maximum intensity; mTT, mean transit time).
Several quantitative parameters were also examined in this study. Maximum intensity (IMAX), expressed in percentage, is the maximum echo signal power with respect to the reference ROI. There is hyperenhancement if the IMAX of the ROI is greater than that of the control area; otherwise, there is hypoenhancement. The IMAX1 was defined as IMAX of the whole ROI; IMAX2 was defined as IMAX of the peripheral ROI; and IMAX3 was defined as IMAX of the central ROI.
Another quantitative parameter is the rise time (RT), which is independent of the time origin. Whether the RT is long or short depends on comparisons with the control area (short RT = rapid wash-in; long RT= slow wash-in). We defined RT1 as the RT of the whole ROI, RT2 as the RT of the peripheral ROI, and RT3 as the RT of the central ROI. The following RT values were also measured: ∆RT1 = RT of the control area − RT of the whole ROI; ∆RT2 = RT of the control area − RT of the peripheral ROI; and ∆RT3 = RT of the control area − RT of the central ROI.
Moreover, time to peak (TTP) was measured versus the control area: Short TTP= rapid wash-in; long TTP = slow wash-in. We defined TTP1 as TTP of the whole ROI, TTP2 as TTP of the peripheral ROI, and TTP3 as TTP of the central ROI. The following TTP values were also measured: ∆TTP1 = TTP of the control area − TTP of the whole ROI; ∆TTP2 = TTP of the control area − TTP of the peripheral ROI; and ∆TTP3 = TTP of the control area − TTP of the central ROI.
Besides, the mean transit time (mTT) is the contrast agent circulation time in the ROI tissue. We defined mTT1 as mTT of the whole ROI, mTT2 as mTT of the peripheral ROI, and mTT3 as mTT of the central ROI. The following mTT values were also measured: ∆mTT1 = mTT of the control area − mTT of the whole ROI; ∆mTT2 = mTT of the control area − mTT of the peripheral ROI; and ∆mTT3 = mTT of the control area − mTT of the central ROI (Figure 2). When the operator drew the corresponding ROI on the CEUS video data in SonoLiver software, the parameters were automatically generated.
. The model consists of fitting echo-power signals with a perfusion model function representing the bolus kinetics (RT, rise time; TTP, time to peak; IMAX, maximum intensity; mTT, mean transit time).")
The model and perfusion parameters in the operating manual of SonoLiver version 1.1 (TomTec Imaging Systems, Munich, Germany). The model consists of fitting echo-power signals with a perfusion model function representing the bolus kinetics (RT, rise time; TTP, time to peak; IMAX, maximum intensity; mTT, mean transit time).
3.5. Histological Confirmation
All patients underwent surgery or FNAB. Pathological diagnosis was confirmed by a single pathologist with ten years of experience, who was blinded to the medical history and US findings of the patients. The pathological diagnosis was considered as a reference standard in this study (12, 13).
3.6. Statistical Analysis
Statistical analysis was performed in SPSS version 22.0 (IBM Corp., Armonk, New York, USA) and MedCalc version 11.4.2 (MedCalc Software Ltd., Mariakerke, Belgium). Comparisons between the groups were made using two-sample t-test or Mann-Whitney U test for continuous variables and Chi-square test for categorical variables. Moreover, two-way analysis of variance (ANOVA) was used to compare aSAT and PTC nodules, based on the TI-RADS grade.
Moreover, a receiver operating characteristic (ROC) curve analysis was carried out to evaluate the sensitivity, specificity, positive and negative predictive values, and overall potential of each indicator to distinguish between aSAT and PTC nodules by calculating the area under the curve (AUC). Besides, pairwise comparisons of ROC curves were performed. Statistical tests were all two-sided, and two-tailed P-values were considered significant at 5%.
4. Results
4.1. Patients’ Characteristics
The demographic characteristics of 30 aSAT patients and 23 PTC patients are summarized in Table 1. There was no significant difference in terms of age or gender between the aSAT and PTC patients (age: 47.43 ± 8.51 vs. 47.26 ± 10.42 years, P = 0.95; χ2 = 0.928, P = 0.335). Also, the TI-RADS grade was not significantly different between the two groups (P = 0.336, F = 1.581).
| Variables | aSAT | PTC | P-value c | t/ χ2/F |
|---|---|---|---|---|
| Age | 47.43 ± 8.51 | 47.26 ± 10.42 | 0.95 | 2.02 |
| Maximum diameter | 15.93 ± 9.09 | 14.3 ± 7.08 | 0.71 | 0.48 |
| Gender (M/F) | 8/22 | 9/14 | 0.335 | χ2 = 0.928 |
| TI-RADS | 0.3356 | F = 1.581 | ||
| 4a | 11 | 5 | ||
| 4b | 15 | 14 | ||
| 5 | 4 | 4 |
Abbreviations: aSAT, asymptomatic subacute thyroiditis; PTC, papillary thyroid carcinoma; TI-RADS, thyroid imaging reporting & data System.
aData are presented as mean ± standard deviation unless otherwise stated.
bThe age and gender are not significantly different between the two groups.
cP-value is obtained by a two-tailed independent-samples t-test; χ2 is obtained by a two-tailed Chi-square test; and F-value is obtained by a two-way ANOVA.
4.2. Comparison of Conventional US and CEUS Images
In the conventional US analysis, the maximum lesion diameter did not differ significantly between the aSAT and PTC patients (t = 0.71, P = 0.48) (Table 1). There were also no significant differences between the two groups in terms of nodule margins (χ2 = 1.33, P = 0.97), echogenicity (χ2 = 1.59, P = 0.21), the presence of lymph nodes (χ2 = 1.41, P = 0.24), or vascularity (χ2 = 0.08, P = 0.78). However, the nodule shape (χ2 = 12.76, P = 0.0004) and calcification (χ2 = 29.89, P < 0.0001) were significantly different between the aSAT and PTC groups. In the CEUS analysis, neither the enhancement type (χ2 = 0.84, P = 0.36), nor the degree of contrast agent distribution (χ2 = 3.66, P = 0.06) was significantly different between the aSAT and PTC groups (Table 2 & Figures 3 and 4).
| Characteristics | aSAT | PTC | P-value | χ2 a |
|---|---|---|---|---|
| Margin | 0.97 | 1.33 | ||
| Well defined | 0 | 1 | ||
| Poorly defined | 30 | 22 | ||
| Echogenicity | 0.21 | 1.59 | ||
| Markedly hypoechoic | 2 | 0 | ||
| Hypoechoic | 28 | 23 | ||
| Presence of lymph nodes | 0.24 | 1.41 | ||
| Absent | 25 | 16 | ||
| Present | 5 | 7 | ||
| Vascularity | 0.78 | 0.08 | ||
| No vascularity | 2 | 2 | ||
| Peripheral and/or internal | 28 | 21 | ||
| Shape | 0.0004 | 12.76 | ||
| Taller than wide | 29 | 13 | ||
| None | 1 | 10 | ||
| Calcification | < 0.0001 | 29.89 | ||
| No calcifications | 30 | 7 | ||
| Microcalcifications | 0 | 9 | ||
| Macrocalcifications | 0 | 7 | ||
| Enhancement type | 0.36 | 0.84 | ||
| Hypoenhancement | 23 | 15 | ||
| Hyperenhancement or isoenhancement | 7 | 8 | ||
| Degree of contrast agent distribution | 0.06 | 3.66 | ||
| Diffuse homogeneous | 7 | 1 | ||
| Heterogeneous | 23 | 22 |
Abbreviations: aSAT, asymptomatic subacute thyroiditis; PTC, papillary thyroid carcinoma; CEUS, contrast-enhanced ultrasonography; US, ultrasonography.
aThe χ2 value is obtained by a two-tailed Chi-square test. Shape and calcification show significant differences between the aSAT and PTC patients.
 4c asymptomatic subacute thyroiditis (aSAT) nodule in a 52-year-old woman. A, Conventional two-dimensional image. B, Color Doppler image. C, Contrast-enhanced ultrasonography (CEUS) image indicates hypoenhancement. D, The pathological examination reveals symptomatic subacute thyroiditis (SAT) (H&E staining, × 100).")
A thyroid imaging reporting & data system (TI-RADS) 4c asymptomatic subacute thyroiditis (aSAT) nodule in a 52-year-old woman. A, Conventional two-dimensional image. B, Color Doppler image. C, Contrast-enhanced ultrasonography (CEUS) image indicates hypoenhancement. D, The pathological examination reveals symptomatic subacute thyroiditis (SAT) (H&E staining, × 100).
 IV papillary thyroid carcinoma (PTC) nodule in a 50-year-old woman. A, Conventional two-dimensional image. B, Color Doppler image. C, The CEUS image indicates hypoenhancement. D, The pathological examination indicates PTC (H&E staining, × 100).")
A thyroid imaging reporting & data system (TI-RADS) IV papillary thyroid carcinoma (PTC) nodule in a 50-year-old woman. A, Conventional two-dimensional image. B, Color Doppler image. C, The CEUS image indicates hypoenhancement. D, The pathological examination indicates PTC (H&E staining, × 100).
4.3. Comparison of Quantitative CEUS Parameters
Compared to PTC patients, the aSAT group showed longer ∆RT1 (t = 1.96, P = 0.03) and ∆RT3 (t = 1.68, P = 0.049). Conversely, the aSAT group had shorter RT1 (t = −1.73, P = 0.045), TTP1 (t = −2.97, P=0.005), TTP2 (t = −2.57, P=0.01), and TTP3 (t = −3.05, P = 0.004), as well as lower IMAX2 (t = −2.689, P = 0.009), compared to PTC patients (Figure 5 & Table 3). However, IMAX1, IMAX3, RT2, RT3, ∆RT2, ∆TTP1, ∆TTP2, ∆TTP3, mTT1, mTT2, mTT3, ∆mTT1, ∆mTT2, and ∆TTP3 were not significantly different between the two groups (Table 3).
.")
Schematic representation of quantitative parameters with significant differences between the aSAT and PTC groups. Compared to PTC patients, the aSAT group have longer ∆RT1 and ∆RT3. Compared to the PTC patients, the aSAT group also has shorter RT1, TTP1, TTP2, and TTP3 and lower IMAX2 (aSAT, asymptomatic subacute thyroiditis; PTC, papillary thyroid carcinoma; RT, rise time; TTP, time to peak; IMAX, maximum intensity; RT1, RT of whole ROI; ∆RT1, RT of the control area – RT of the whole ROI; ∆RT3, RT of the control area – RT of the central ROI; TTP1, TTP of the whole ROI; TTP2, TTP of the peripheral ROI; TTP3, TTP of the central ROI; and IMAX2, IMAX of the peripheral ROI).
| Characteristics | aSAT | PTC | P-value c | t |
|---|---|---|---|---|
| ∆RT1 | 0.12 ± 0.69 | -0.2 ± 0.57 | 0.03 | 1.96 |
| ∆RT3 | 0.43 ± 0.72 | 0.04 ± 0.94 | 0.049 | 1.68 |
| RT1 | 4.05 ± 1.56 | 4.91 ± 2.09 | 0.045 | -1.73 |
| TTP1 | 4.91 ± 1.76 | 7.30 ± 3.92 | 0.005 | -2.97 |
| TTP2 | 5.06 ± 1.97 | 7.00 ± .48 | 0.01 | -2.57 |
| TTP3 | 4.90 ± 1.68 | 7.57 ± 4.41 | 0.004 | -3.05 |
| IMAX2 | 0.74 ± 0.36 | 1.09 ± 0.57 | 0.009 | -2.689 |
Abbreviations: aSAT, asymptomatic subacute thyroiditis; PTC, papillary thyroid carcinoma; RT, rise time; TTP, time to peak; IMAX, maximum intensity; RT1, RT of the whole ROI; ∆RT1, RT of the control area – RT of the whole ROI; ∆RT3, RT of the control area – RT of the central ROI; TTP1, TTP of the whole ROI; TTP2, TTP of the peripheral ROI; TTP3, TTP of the central ROI; IMAX2, IMAX of the peripheral ROI; CEUS, contrast-enhanced ultrasonography.
aData are presented as mean ± standard deviation unless otherwise stated.
bCompared to PTC patients, the aSAT group shows longer ∆RT1 and ∆RT3. In contrast, compared to PTC patients, the aSAT group shows shorter RT1, TTP1, TTP2, and TTP3 and lower IMAX2.
cP-value is obtained by a two-tailed independent-samples t-test.
Based on the ROC curve analysis, the RT1 showed higher specificity (91.30%) than other parameters (Table 4). According to the AUC of each quantitative parameter and between-group differences, the AUC was significantly larger for TTP1 than RT1 (sensitivity: 66.67% vs. 33.33%; specificity: 65.22% vs. 91.30%; P = 0.027). However, there was no significant difference between other parameters (Figure 6 & Table 4).
| AUC | P-value | Youden’s index | Associated criterion | Sensitivity | Specificity | ∆RT1 | ∆RT3 | TTP1 | TTP2 | TTP3 | IMAX2 | |
|---|---|---|---|---|---|---|---|---|---|---|---|---|
| RT1 | 0.614 | 0.144 | 0.2464 | ≤ 3.2 | 33.33 | 91.3 | P = 0.7551 | P = 0.9774 | P = 0.0270 b | P = 0.1355 | P = 0.0611 | P = 0.4625 |
| ∆RT1 | 0.648 | 0.052 | 0.2551 | ≤ 0-0.2 | 73.33 | 52.17 | P = 0.6608 | P = 0.5977 | P = 0.7846 | P = 0.5339 | P = 0.6914 | |
| ∆RT3 | 0.612 | 0.158 | 0.2188 | ≤ 0.3 | 56.67 | 65.22 | P = 0.3466 | P = 0.5024 | P = 0.3287 | P = 0.4098 | ||
| TTP1 | 0.703 | 0.005 | 0.3188 | ≤ 5.2 | 66.67 | 65.22 | P = 0.2154 | P = 0.8376 | P = 0.9224 | |||
| TTP2 | 0.678 | 0.016 | 0.2754 | ≤ 5.7 | 66.67 | 60.87 | P = 0.4771 | P = 0.8692 | ||||
| TTP3 | 0.711 | 0.003 | 0.3551 | ≤ 6.2 | 83.33 | 52.17 | P = 0.8738 | |||||
| IMAX2 | 0.693 | 0.012 | 0.4319 | ≤ 1.08 | 86.67 | 56.52 |
Abbreviations: AUC, area under the curve; RT, rise time; TTP, time to peak; IMAX, maximum intensity; RT1, RT of the whole ROI; ∆RT1, RT of the control area – RT of the whole ROI; ∆RT3, RT of the control area – RT of the central ROI; TTP1, TTP of the whole ROI; TTP2, TTP of the peripheral ROI; TTP3, TTP of the central ROI; and IMAX2, IMAX of the peripheral ROI; PTC, papillary thyroid carcinoma; aSAT, asymptomatic subacute thyroiditis; ROC, receiver operating characteristic.
aThe ROC curve analysis of each quantitative parameter is presented.
bAUC of TTP1 is significantly larger than that of RT1 (P < 0.05).
 curve. The TTP parameters (TTP1, TTP2, and TTP3) all have larger AUCs. The AUC of TTP1 is significantly larger than that of RT1 (AUC, area under the curve; TTP, time to peak; IMAX, maximum intensity; RT1, RT of the whole ROI; ∆RT1, RT of the control area – RT of the whole ROI; ∆RT3, RT of the control area – RT of the central ROI; TTP1, TTP of the whole ROI; TTP2, TTP of the peripheral ROI; TTP3, TTP of the central ROI; and IMAX2, IMAX of the peripheral ROI).")
Schematic representation of the receiver operating characteristic (ROC) curve. The TTP parameters (TTP1, TTP2, and TTP3) all have larger AUCs. The AUC of TTP1 is significantly larger than that of RT1 (AUC, area under the curve; TTP, time to peak; IMAX, maximum intensity; RT1, RT of the whole ROI; ∆RT1, RT of the control area – RT of the whole ROI; ∆RT3, RT of the control area – RT of the central ROI; TTP1, TTP of the whole ROI; TTP2, TTP of the peripheral ROI; TTP3, TTP of the central ROI; and IMAX2, IMAX of the peripheral ROI).
5. Discussion
In this retrospective study, we examined the characteristics of conventional US and CEUS and performed a quantitative analysis in aSAT and PTC patients. In conventional B-mode imaging, although the lesion shape and calcification were characterized, it was still too difficult to use conventional US features to distinguish aSAT from PTC nodules. Likewise, these nodules were indistinguishable with CEUS imaging. However, in the quantitative analysis, multiple parameters were significantly different between aSAT and PTC nodules. Therefore, these parameters can provide useful information to minimize invasive procedures and improve the diagnostic accuracy for SAT nodules.
Conventional US, as the most commonly used US modality, can demonstrate various features of a given thyroid lesion and improve the clinical diagnosis. A study evaluating the sonographic features of SAT found that poorly defined margins and hypoechoism were more frequent in SAT nodules (14). Several studies have also reported the same results for PTC nodules (15, 16). Similarly, in the present study, the margin definition and echogenicity were not significantly different between the aSAT and PTC groups. Our literature review indicated that most SAT nodules had a wider-than-taller shape (17). Meanwhile, PTC nodules had a taller-than-wide shape, which is a sign of malignancy; nonetheless, nodules with a wider-than-tall shape are still common (18). Although in our study, shape was significantly different between aSAT and PTC nodules, the difference was not specific enough for identification.
Evidence suggests that calcification is extremely rare in SAT patients (14), and microcalcification seems to be more common in PTC (19). Calcification was also significantly different between the aSAT and PTC groups in our study. This feature can be helpful in distinguishing the two diseases to some extent; however, misdiagnosis still occurs, especially for PTC nodules without calcification (17, 20). Therefore, conventional US is still inadequate for the differential diagnosis of aSAT and PTC nodules. Overall, CEUS was helpful in identifying benign and malignant thyroid nodules. Based on the results, neither enhancement type, nor the degree of contrast agent distribution differed significantly between the aSAT and PTC groups; this could have been caused by the similar vascular distribution and profiling of these nodules (16). Nevertheless, we found no significant differences in the vascularity of these diseases.
In the differential diagnosis of aSAT and PTC nodules, a quantitative CEUS analysis seems to provide very useful information. In this study, the aSAT nodules showed shorter RT1 compared to PTC nodules. Generally, the RT represents the contrast agent perfusion time in ROI, ranging from 5% to 95% of an increasing curve; therefore, the blood supply for PTC was not abundant. In this regard, a study by Moon et al. (21) demonstrated deficient blood supply in PTC due to interstitial fibrosis. However, in the present study, longer ∆RT1 and ∆RT3 were found in aSAT patients compared to PTC patients; this conflicting result could be attributed to differences in the glandular tissue around the nodule.
In pathology, SAT often causes edema in the surrounding glands due to its inflammatory response, which affects the peripheral blood supply to some extent. In contrast, the glands around PTC may have a greater blood supply, which is more conducive to tumor invasion to the periphery. A previous study also showed that the density of blood vessels in the peripheral area of PTC was higher than that of the central area (22). Besides, compared to PTC patients, the aSAT patients showed shorter TTP1, TTP2, and TTP3 and lower IMAX2 in the current study. TTP is the time point after injection when the ROI signal intensity reaches its maximum. A longer TTP time in PTC suggests a relatively complicated nodule structure.
The IMAX is the maximum intensity of blood perfusion in the lesion, reflecting the state in which the inflow and outflow of the contrast agent reach equilibrium. The present study suggested that peripheral perfusion of PTC nodules was higher than that of aSAT nodules, which can be related to the growth features of the tumor. A previous study also showed a non-uniform vascular distribution in PTC (23). Given the long-term coexistence of growth and destruction, ischemia often occurs, which is more obvious at the center of the nodule.
Generally, a quantitative CEUS examination may provide more biological characteristics of nodules for research purposes, which is helpful for the differential diagnosis of diseases. Moreover, in the ROC curve analysis, the RT1 showed superior specificity (91.30%), which suggested that RT1 had higher accuracy in identification. However, the AUC of TTP1 was significantly larger than that of RT1 (P = 0.027). Compared to other parameters, the TTP parameters (TTP1, TTP2 and TTP3) not only differed significantly between the two groups in the quantitative analysis, but also had larger AUCs in the ROC curve analysis. This might indicate the higher diagnostic performance of TTP1 (sensitivity of TTP1 vs. RT1: 66.67% vs. 33.33%) in the quantitative analysis, which would be conducive to the identification of aSAT and PTC.
The present study had several limitations. First, this was a retrospective study with some potential selection bias; therefore, a prospective research is needed to confirm the results. Second, our sample size was not large enough; therefore, verification is required in larger groups, which allows for a more accurate analysis of sensitivity, specificity, and predictive values. Third, although PTC accounts for the largest proportion of all thyroid carcinomas, other malignant thyroid tumors (e.g., medullary thyroid carcinoma and follicular thyroid carcinoma) may be also difficult to distinguish from SAT and must be further examined. Finally, different operators might have drawn the outlines of ROIs differently. Although the mean values were measured, deviation still exists, and more scientific methods are needed in the future.
In conclusion, the present study demonstrated that several quantitative CEUS parameters could discriminate aSAT from PTC nodules. These findings might provide useful information for minimizing invasive procedures and improving the diagnostic accuracy of SAT nodules.
