1. Background
Breast cancer is a common malignancy, and neoadjuvant chemotherapy (NAC) is an effective treatment for locally advanced breast cancer before surgery. In patients with an inoperable disease at diagnosis, NAC aims to achieve resectability by either a standard mastectomy or breast-conserving surgery (1). Assessing the tumor response to NAC is thus crucial for patient management. Clinical palpation, mammography and ultrasound examination could not reliably monitor the response to NAC. For the diagnosis of breast cancer, biopsy has obvious advantages than magnetic resonance imaging (MRI), but it is an invasive examination (2). MRI has a higher sensitivity (88.1%) than mammography and ultrasound (3-6). With the use of high magnetic field, dedicated breast coil and contrast agent, both spatial and temporal resolutions of breast MRI have been greatly improved, and MRI can monitor the response to NAC more accurately than clinical palpation and conventional imaging methods (4, 7, 8).
The differences in the relaxation times of different tissues constitute the basis for contrast resolution in MRI. T2 maps are based on the T2 relaxation time. In general, T2 maps and tissue T2 relaxation times are obtained by scans with long repetition times (TRs) and two or more echo times (TEs). Several studies have used T2 mapping to measure the T2 relaxation time in benign and malignant breast lesions to determine the potential role of this method in the differentiation of benign and malignant breast lesions, as well as monitoring the response of breast tumors to neoadjuvant chemotherapy (9-12). In addition, there is one study using the T2 relaxation time to predict the response to NAC (10).
We performed T2 maps examination before and after NAC for breast cancer patients, to study change in T2 relaxation time after NAC. We also compared the T2 relaxation time change between response and non-response groups.
2. Objectives
The purpose of this study was to provide additional information regarding the T2 relaxation time changes after NAC in breast cancer.
3. Patients and Methods
3.1. Patients
A total of 26 female patients (mean age: 55.2 years, age range: 34 - 70 years old) were recruited who were scheduled to undergo neoadjuvant chemotherapy for primary locally advanced breast cancer. All enrolled patients did not undergo any treatment, who presented to Huashan hospital from July 2009 to October 2010. All patients underwent MRI examinations. Patients with previous chemotherapy, radiotherapy or hormone replacement therapy and lactating patients were excluded.
Informed consent was obtained from all of the subjects, and this study was approved by the institutional review board.
3.2. Treatment
Chemotherapy was started within 1 or 2 days after the diagnosis. Of the 26 patients,, 14 patients were treated with cyclophosphamide 800 mg/m2, epirubicin 110 mg/m2, and paclitaxel 270 mg/m2 (CET) regimens for four cycles, the remaining 12 patients were treated with CET regimens for three cycles. After NAC, all patients underwent a modified radical mastectomy.
3.3. MRI
All patients underwent MRI examinations at the following two time points: 1) prior to the start of chemotherapy and biopsy, and 2) after the last NAC cycles and prior to surgery. Surgery was performed within 1 week (average 3.4 days) after the second MRI examinations.
MR Image acquisition was performed using a 1.5T MRI (GE Signa, Milwaukee, WI, USA). The patient was in prone position, and both breasts were examined with a 4-channel phased-array breast surface coil (GE Medical System, Milwaukee, WI, USA). The following sequences were included: axial fast spin echo (FSE) T1 weighted image (T1WI), sagittal fat-suppressed T2WI, axial short time inversion recovery (STIR), axial diffusion weighted imaging (DWI) with b values at 0 and 1000. With help of the STIR and DWI images, four slices containing the largest part of the lesions were selected. T2 mapping was performed using the parameters of these four slices (including the location, thickness, spacing, and field of view [FOV]). The T2 mapping was performed with the following parameters: FSE sequence, 8 echo, TE: 12.6 - 189.4 ms, TR: 1000 ms, matrix 256 × 256, and one cycle of excitation. The 3D sequence was acquired before and five times successively after intravenous injection of gadolinium chelate (0.1 mmol/kg, Magnevist, Schering).
3.4. Image Analysis
The T2 relaxation times of tumors were measured by two experienced radiologists with over 10 years of experience, who were blinded to the pathology results. The T2 relaxation times of tumors were measured using Functool T2 mapping software on an AW43 workstation (GE, Milwaukee, WI, USA). If the lesions were clearly visualized on T2 mapping, the measurements were obtained directly from the image; otherwise, a fusion of the DWI images with the T2 mapping was performed. Combining the region of interest with STIR avoided the tumor necrotic and cystic areas. The measurements were obtained at three different regions of the lesions, and the mean value was calculated. Any discrepant readings were resolved by consensus.
3.5. Histological Evaluation
The pathology response is treated as the gold standard. The specimens were dissected as described previously, and the histological response to NAC was evaluated by a single pathologist using the classification of response criteria as follows (13):
Grade 0, no response: almost no change in the cancer cells after treatment. Grade 1, Slight response.
Grade 1A, mild response: mild changes in the cancer cells regardless of the area or marked changes seen in less than one-third of the cancer cells.
Grade 1B, moderate response, marked changes in one-third or more and in less than two-thirds of the tumor cells.
Grade 2, marked response: marked changes in two-thirds or more of the tumor cells.
Grade 3, complete response: necrosis or disappearance of all the tumor cells, replacement of all the cancer cells by granuloma-like and/or fibrous tissue.
In case of complete disappearance of the cancer cells, the pretreatment pathological evidence of the presence of cancer is necessary. Grade 0 is categorized as a non-pathological response, and grades 1-3 are pathological responses.
3.6. Statistical Analysis
The data were recorded using the means ± standard deviations. The response and non-response groups’ lesion T2 relaxation times were compared using the independent sample t-test. The differences in the T2 relaxation times before and after NAC were tested for statistical significance using a paired samples t-test. All data were analyzed using SPSS software, ver. 11.5 (SPSS Inc., Chicago, Il, USA). P < 0.05 was considered a significant difference.
4. Results
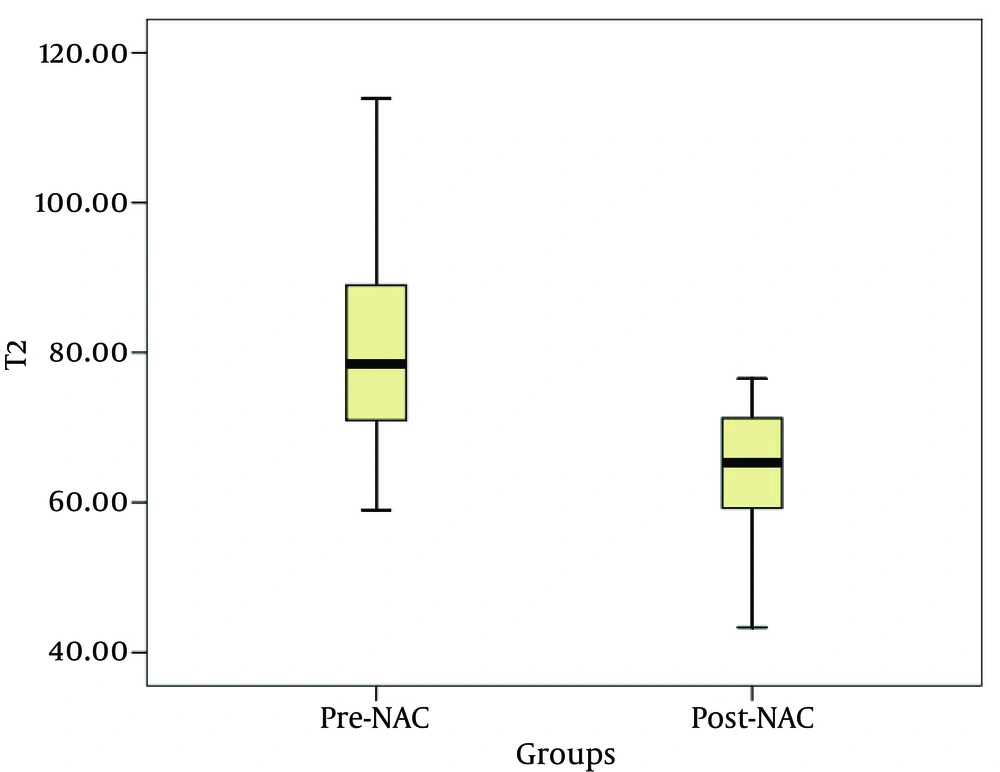
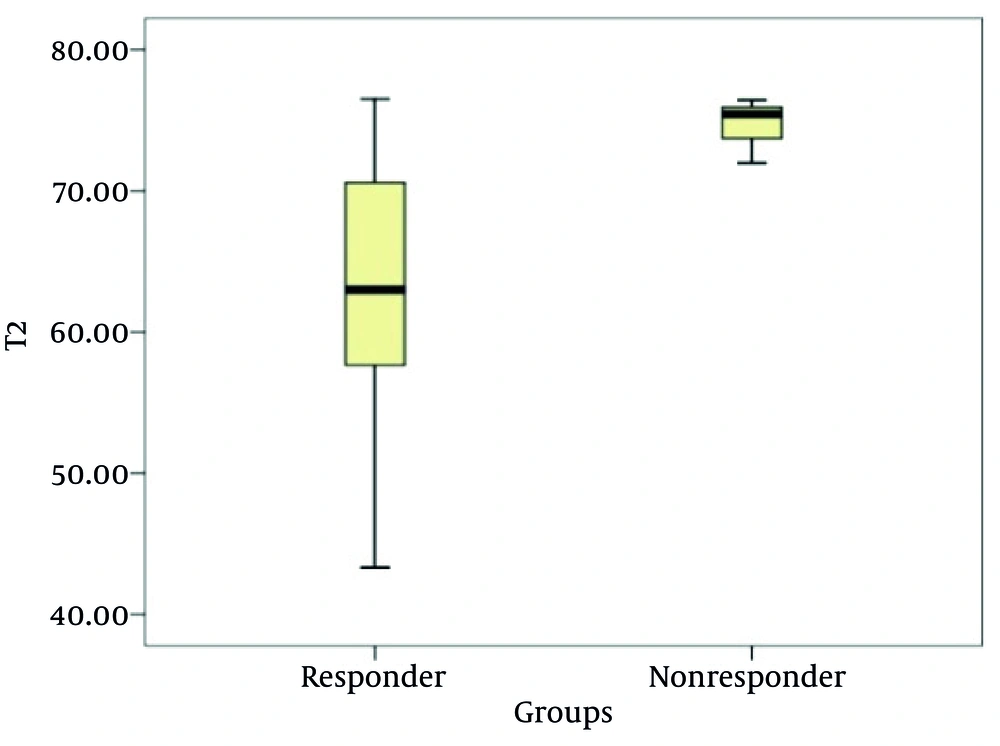
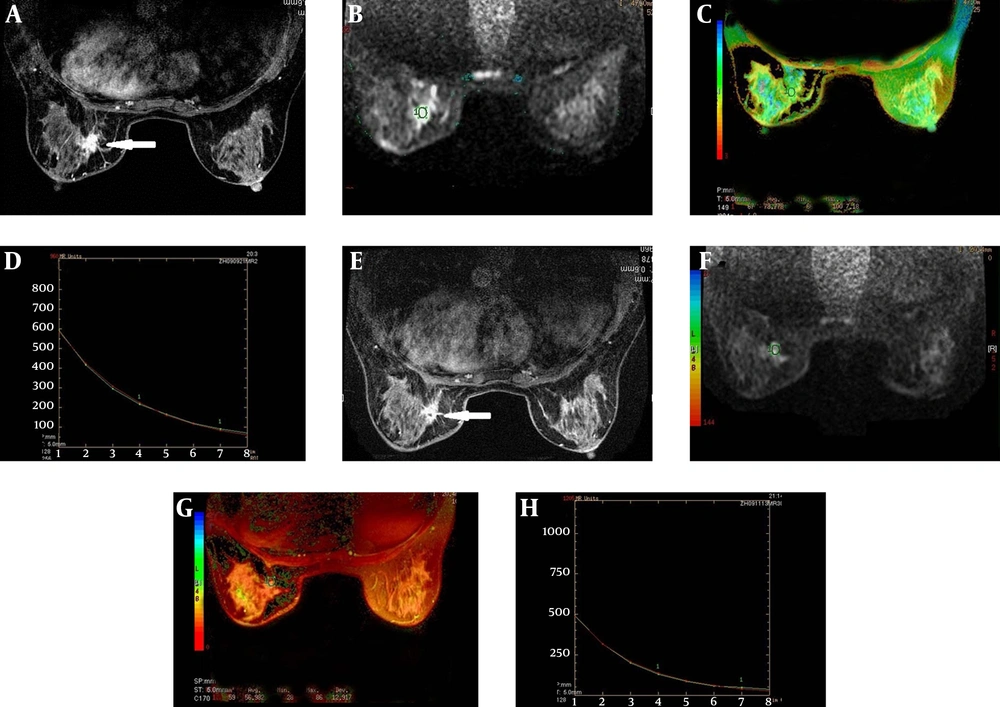
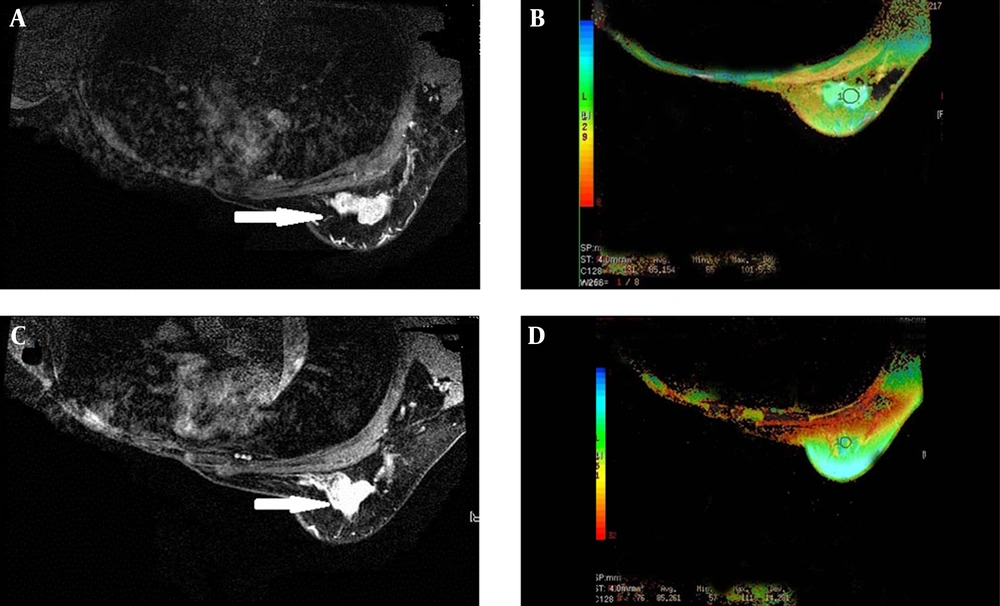
Twenty-six cases were included; 20 cases of invasive ductal carcinoma (IDC), and 6 cases of invasive lobular carcinoma (ILC). Of the 26 patients, 23 patients were pathologically diagnosed as responders, whereas 3 patients were nonresponders. The T2 relaxation times (mean ± SD) for the pre-treatment and post-treatment were 81.34 ± 13.68 ms and 64.50 ± 8.71 ms, respectively; there was a statistically significant difference between the groups (t = 5.408, P < 0.001) (Figure 1). Before treatment, the mean lesion T2 relaxation times was 80.93 ± 14.4 ms for the responders, and 84.57 ± 6.06 ms for the nonresponders; there was no statistically significant difference between the two groups (t = −0.426, P = 0.674). After NAC, the mean lesion T2 relaxation time was 63.18 ± 8.37 ms for the responders, and 74.62 ± 2.32 ms for the nonresponders; there was a statistically significant difference between the groups (t = −2.31, P = 0.029) (Figures 2 - 4), (Table 1).
| Number of Patients | T2 Relaxation Time, ms | ||
|---|---|---|---|
| Pre-NAC | Post-NAC | ||
| Responders | 23 | 80.93 ± 14.41 | 63.18 ± 8.37 |
| Nonresponders | 3 | 84.57 ± 6.06 | 74.62 ± 2.32 |
| Total | 26 | 81.34 ± 13.68 | 64.50 ± 8.71 |
Abbreviation: NAC, Neoadjuvant Chemotherapy.
aValues are presented as mean ± SD.
An example of a responder (histological evaluation: Grade 1B). A, A right breast cancer showed an irregular margin before NAC on T1 weighted enhancement imaging; B, The DWI images superimposed on a T2 map for the selection of the ROI (circle); C, The T2 color map shows the lesion T2 relaxation time of 78.78 ms; D, The T2 relaxation time curve; E, The lesion decreased slightly in size after NAC on T1 weighted Gd-enhanced image; F, The DWI images superimposed on a T2 map for the selection of the ROI (circle) after NAC; G, H, After NAC, the lesion T2 relaxation time was 56.98 ms shorter than that before NAC.
An example of a nonresponder (histological evaluation: Grade 0). A, A left breast cancer showed an irregular margin before NAC on the T1 weighted Gd-enhanced image; the right breast was radically resected; B, The T2 color map shows a lesion T2 relaxation time of 85.15 ms; C, The lesion did not decrease in size after NAC on the T1 weighted Gd-enhanced image; D, After NAC, the lesion T2 relaxation time was 85.26 ms, longer slightly than that before NAC.
5. Discussion
Usually, MRI is T2-weighted (transversal relaxation time) and/or T1-weighted (longitudinal relaxation time). Theoretically, the T2 relaxation time is dependent on tissue characteristics itself (14), and is independent of the main magnetic field strength.
T2 relaxation time could be obtained using spin echo (SE) or gradient echo (GRE) sequences; this study used a spin echo sequence. Currently, multispin-echo (MSE) sequences are commonly employed (9). In this study, the data were collected using 8 different TEs. After the images were acquired, they could be generated directly in color T2 mapping by using Functool T2 mapping software to determine the level of the pixel values in T2 mapping, based on the tissue T2 relaxation time. When using a single spin echo acquisition for T2 weighted images, TE close to the tissue T2 relaxation time must be selected.
In addition to the effects of the main magnetic field strength, the T2 relaxation time was affected by the tissue water content, random movement of water molecules and macromolecules, tissue fat content, presence of paramagnetic particles and pH value (15, 16). Among these factors, the tissue water content was the most important, T1 and T2 relaxation times of free water are longer than those of bound water (16). Cytotoxic drugs used in neoadjuvant chemotherapy could alter the distribution of water in a tumor, and a possible explanation for this finding could be due to swelling, necrosis and apoptosis of tumor cells (10). A study showed that in a regimen using cyclophosphamide in the treatment of breast cancer, the extracellular space is increased the day following treatment (17). Tan et al. (10) investigated the use of the relaxation times of malignant breast lesions in predicting the response after the first cycles of NAC, and 60% of the patients showed a lengthening of the lesion T2 relaxation times. According to Duvvuri et al. (18), although a trend of increasing T2 relaxation times relative to the controls was noted in the viable regions of the tumor 36 hours after cyclophosphamide administration in the RIF-1 tumor model, the changes were not statistically significant, presumably because the free water content of the extracellular space was not significantly altered after one cycle. According to Tan et al. (10), the difference in the groups was far more apparent after the second cycle because the majority of the responders (76%) had lesion T2 relaxation times shorter than their pretreatment value, whereas the proportion for nonresponders was only 44%. A possible explanation for this finding could be that as tumor cells undergo necrosis, various macromolecular compounds in the cells are released into the extracellular space, potentially binding to water molecules and reducing the proportion of free water.
In our study, after NAC, the lesion T2 relaxation time was shorter than those before NAC. We hypothesize that the reason is probably apoptosis or cell death leading to release of intracellular macromolecules into the extracellular space; simultaneously, the extent of the lesion edema decreased and fibrosis increased significantly. These factors might lead to shortened T2 relaxation times after NAC, after which the lesion T2 relaxation times of the responders were shorter than those of the nonresponders. We hypothesize that a significant increase in fibrotic lesions of the responder group of patients significantly reduces the degree of the lesion edema in this group. In this study, the measurement of the lesion T2 relaxation times after NAC were correlated with the ultimate lesion response, which confirmed the findings of Tan (10). T2 relaxation times can reflect biological state of lesions, may prove useful to assess the response to NAC.
In order to reduce measurement errors due to changes in the place of the patient before and after chemotherapy,T2 measurement was necessarily performed subsequent to DWI and STIR since it is often impossible to determine accurately the position and extent of lesions.
In this study, there were some limitations. First, the number of cases was small, and the majority of the cases were invasive ductal carcinoma with relatively fewer cases of invasive lobular carcinoma; because the T2 relaxation time was related to the composition of the lesions, this difference could have resulted in bias in the measurement of the T2 relaxation time. Second, neoadjuvant chemotherapy in patients have different chemotherapy cycles, including 12 cases of three cycles and 14 cases of four cycles, this inhomogeneity might affect the evaluation results.
After breast cancer NAC, the lesion T2 relaxation times were shorter than those before NAC, and the lesion T2 relaxation times of the responders were shorter than those of the nonresponders post-NAC. This finding is potentially useful to assess the response to NAC. We will further study the T2 relaxation time as early predictors of response in breast cancer patients undergoing NAC.


