Prediction of Chemotherapy Response in Primary Osteosarcoma by Use of the Multifractal Analysis of Magnetic Resonance Images

authors:

avatar Goran J. Djuričić 1 , * , avatar Jelena S. Vasiljević 2 , avatar Dušan J. Ristić 3 , avatar Relja Z. Kovačević 4 , avatar Dalibor V. Ristić 5 , avatar Nebojša T. Milosević 6 , avatar Marko Radulovic 3 , avatar Jelena P. Sopta 4

Department of Diagnostic Imaging, University Children's Hospital, University of Belgrade, Belgrade, Serbia
Institute “Mihajlo Pupin”, University of Belgrade, Belgrade, Serbia
Institute of Oncology & Radiology of Serbia, Belgrade, Serbia
Institute of Pathology, School of Medicine, University of Belgrade, Belgrade, Serbia
The School of Computing, University Union, Belgrade, Serbia
Department of Biophysics, School of Medicine, University of Belgrade, Belgrade, Serbia

how to cite: Djuričić G J, Vasiljević J S, Ristić D J, Kovačević R Z, Ristić D V, et al. Prediction of Chemotherapy Response in Primary Osteosarcoma by Use of the Multifractal Analysis of Magnetic Resonance Images. I J Radiol. 2018;15(2):e57623. https://doi.org/10.5812/iranjradiol.57623.

Abstract

Background:

Due to the high level of cytogenetic heterogeneity in osteosarcoma, personalized treatment is the promising strategy for the improvement in outcomes. This is currently not possible due to the absence of targeted therapies and reliable predictors for response to induction chemotherapy.

Objectives:

To investigate the predictive value of computational analysis of osteosarcoma magnetic resonance (MR) images.

Patients and Methods:

Multifractal analysis was performed on MR images of primary osteosarcoma of long tubular bones prior to OsteoSa induction chemotherapy. A total of 900 images derived from 67 good and poor responder patients were classified and compared to the actual retrospective outcome.

Results:

Among the six calculated multifractal features, Dqmax exerted the highest predictive value with the prediction accuracy of 74.3%, sensitivity of 72.4% and specificity of 76.2%. The obtained classification accuracy was validated by a ten V-fold split sample cross validation. The area under the curve (AUC) value for the best-performing multifractal Dqmax feature was 0.82 (95% confidence interval, 0.70 - 0.91).

Conclusion:

These results suggest for the first time that measuring tumor structure by using multifractal geometry can predict an individual patient response to neoadjuvant cytotoxic therapy. Therefore, it potentially allows precise implementation of alternative treatment options. This predictive approach made use of digital data that is routinely collected but currently still underexploited.

1. Background

Primary osteosarcoma is the most common bone sarcoma in children and young adults, found predominantly in patients in their second decade of life (1).

In the prechemotherapy era, before 1970’s, osteosarcoma was a disease with very poor survival rates of less than 20% over a 5-year period. The survival rates markedly improved to a 5-year rate of over 80% in the 1970s and early 1980s upon emergence of chemotherapy regimens.

Osteosarcoma is treated with multimodal therapy comprising a combination of preoperative chemotherapy, surgical treatment and postoperative chemotherapy. The degree of tumor necrosis in response to chemotherapy is the most reliable prognostic factor of disease outcome (2). The problem with the current clinical treatment of osteosarcoma is that the plateau in patient survival attained in the 1980’s has not since changed (3). Due to the high level of the cytogenetic heterogeneity of this tumor, both between patients and within the tumors themselves, the major conceivable strategy for improvement in outcomes is based on the introduction of personalized treatment approaches in inductive chemotherapy. Although there are several therapeutic options for osteosarcoma, this is currently not possible because targeted therapies and reliable induction chemotherapy response predictors do not exist (3). This situation has been stimulating research aimed at predictive marker discovery with the main emphasis on molecular biomarkers, including proteins (4) and mRNA (5). However, these emerging prognostic tools are in the early experimental phase and the prospect of their implementation is still uncertain.

Another evolving strategy suitable for improvement of chemotherapy response prediction is based on a structural analysis of macroscopic morphology of the tumor. It relies on computational analysis of medical images, often by use of fractal geometry which has been developed as a new geometrical concept with an intent to resolve the shortcomings of traditional geometry in structural analysis of complex and irregular natural objects (6). Methods based on multifractal spectra have been found useful for analysis of a wide range of medical images including ultrasound (7), histopathology (8-10), positron emission tomography (11) and magnetic resonance (MR) imaging (12). Tumor image analysis has been explored as a predictive tool in other cancer types (13), but never in osteosarcoma.

2. Objectives

The aim of this study was to test the hypothesis that multifractal computational analysis of routinely collected magnetic resonance images may provide clinical validity in the prediction of the response of osteosarcoma to induction chemotherapy. We employed a neoadjuvant chemotherapy model that is currently accepted as an optimal approach for assessment of in vivo chemotherapy response, since a tumor remains in situ up until the response evaluation (14). The specific objective was to identify the multifractal feature which provides the best predictive value.

3. Patients and Methods

The study was approved by the institutional review board, (Belgrade University, School of Medicine, approval #29/VI-4) and conforms with The code of ethics of the world medical association (declaration of Helsinki), printed in the British medical journal (18 July 1964) and its 7th revision in 2013. For this type of a retrospective study on archived MR images, formal consent is not required. This study conforms with the criteria specified by the Standards for the reporting of diagnostic accuracy studies (STARD) 2015 guidelines (15).

3.1. Patient Group

Cross-sectional study encompassed a group of patients suffering from primary osteosarcoma in long tubular bones, all diagnosed and treated by the national sarcoma consilium during the five-year period of 2010 - 2014 at the institute for oncology and radiology. Diagnostic intra-examination reliability was assessed using the single measures intraclass correlation coefficient (ICC), as previously described (16). The intra-examination agreement for region of interest (ROI) measurements of 900 images was excellent, with an ICC of 0.93 (0.89 - 0.95, P = 0.02). MRI was performed for all patients, confirming the presence and extent of the tumor formation. Patients were consequently subjected to OsteoSa MAP, a combined methotrexate (M), doxorubicin (A) and cisplatin (P) neoadjuvant therapeutic protocol (doxorubicin, cisplatin, and methotrexate). Upon completion of OsteoSa therapy, the tumor response was histopatologically evaluated. The prospective power calculation rested on a pilot experiment that included 22 patients. The parameters for the sample size calculation were target area under the curve (AUC) of 0.75, null hypothesis value of 0.50, alpha 0.05, beta 0.20, ratio of sample sizes in negative/positive groups 0.50. The required numbers were 42 patients with 28 good therapeutic outcomes and 14 poor therapeutic outcomes as calculated by the sampling for AUC function, (MedCalc software, Ostend, Belgium). The final sample size amounted to 67 patients with 36 good therapeutic outcomes. The actual proportion of patients with good response was 0.54 and AUC was 0.83.

3.2. Imaging Technique

Tumor tissue was imaged prior to the administration of chemotherapy in the transverse (TRA), coronal (COR) and sagittal (SAG) plane in T2W, using the fat suppression (FS) sequence. Nine hundred images were obtained by the diagnostic workstation (Siemens Magnetom Avanto Syngo MR B15, Siemens Healthcare, Erlangen, Germany) and images exported in size of 1920 × 1080 pixels by use of Kodak Carestream picture archiving and communication system (PACS) Client Suite version 10.2 software, Kodak, Rochester, NY. Images were cropped by Fiji/ImageJ software (17) to isolate regions of interest (ROIs) according to the borders of each individual’s tumor formation. The sizes of ROIs reflected the actual variation in tumor dimensions (18). Such a type of image processing is commonly used to obtain the optimally comparable and relevant image details for both mono- and multi-fractal analysis (19). Images were transformed from grayscale to binary values of either 0 or 255 before further processing. Scan background setting was locked to white due to the possibility of background inversion from white to black during binarization process. It is important to note that the finally processed images for multifractal analysis contained an isolated structure of the whole tumor defined by black pixels on a white pixel background.

3.3. Chemotherapy Response Evaluation

As the study was retrospective, the patient stratification into good and poor chemotherapy responder groups was done according to their actual response. Evaluation of the achieved chemotherapeutical effect was performed on the resected tumor material obtained from surgery after an induction chemotherapy along with the gold standard in the pathohistological determination of the grade, based on Huvos grading systems by the expert pathologist (J. P. Sopta) with 21 years of experience. Patients with the level of tumor necrosis exceeding 90% were considered as “good responders”, while those with less than 90% of necrosis were considered “poor responders”.

3.4. Image Analysis

The images processed as described above were examined by multifractal analysis using the FracLac plugin version 2015 Marb6206 for Fiji/ImageJ software as described (20). To achieve analytical reproducibility, the range of box sizes (scale window) was set from 10 pixels to the maximal of 60% of an image, Q range from -10 to +10 while minimal density was set at 0.1 and maximal density at 0.98. Multifractal analysis undertakes measurements of the local intensity distribution that scale according to a power law. The obtained exponents thus represent different fractal structures with their own fractal dimensions. The main parameter in multifractal analysis is Holder’s exponent (21), which depends on local regularity of the observed structure (21):

Where μ (box) refers to the proportion of total intensity that is contained in each box as noted in detail elsewhere (22), while ε is the scale or box size (21). F(α) is defined as the multifractal spectrum. It indicates the global regularity of observed structure by providing the distribution of α. Multifractal analysis thus describes both the local and global structure features. High values of the Hölder exponent α thus indicate high local changes, while high values of multifractal spectrum f (α) specify the high frequency of specific α values (23). The calculated multifractal features included αfmin, αf max, f(α)min, f(α)max, Dq and Dqmax.

3.5. Image Classification

A prediction of the response to three cycles of Osteosa MAP chemotherapy was attempted by classification of MR images obtained prior to chemotherapy through a decision tree. Images were classified from their pools in poor- and good-response folders. The single-tree model with the Gini splitting algorithm was used to calculate a stratification accuracy of each parameter (DTREG predictive modelling software version 10.3.0, Brentwood, TN (24). The tree size control settings were set to minimum rows in a node: 1; minimum size node to split: 10; maximum tree levels: 10. The tree pruning and validation by three minimum smooth spikes was done by the ten V-fold split-sample cross validation. The accuracy of a test was the main performance measure, referring to the proportion of true results. Furthermore, sensitivity was calculated as the proportion of patients with chemosensitivity who were correctly identified by the test, while specificity is the proportion of patients who were correctly identified as chemoresistant.

3.6. Statistical Analysis

Areas under the rate-of-change curves (AUCs) were used as a quantitative measure of discrimination efficiency. AUC values were calculated and bootstrap-corrected by use of the Stata®/MP 13 software (StataCorp, TX, USA). AUC curves were produced by use of multifractal feature values obtained on individual images and also by use of average feature values for all images derived from each patient.

4. Results

The predictive potential of multifractal analysis was evaluated by using primary osteosarcoma tumors from the patient group, who were preoperatively treated with the OsteoSa MAP therapeutic protocol. The STARD flow diagram indicates the inclusions and exclusions leading to the final selection of patients and images subjected to multifractal analysis (Figure 1). Representative images for good chemotherapy responders are shown in Figures 2A and 2B and poor chemotherapy responders are demonstrated in Figures 2C and 2D. For multifractal analysis, greyscale images (Figures 2A and C) were transformed to binary images (Figures 2B and D).

Flow diagram demonstrating inclusions and exclusions of patients and tumor MR images according to the standards of reporting for diagnostic accuracy studies (STARD).
Examples of magnetic resonance images. A, Image with a good actual response tumor, excised along its borders; B, The binary version; C, Image with a poor actual response tumor excised along its borders; D, The binary version. All images were 1920 x 1080 pixels in size. The dimensions of tumors within images reflect their actual relative proportions.

The primary tumors are generally the main source of information for the prediction of their drug resistance and the risk of distant metastasis occurrence (8). The relationship between measured continuous feature values and a binary outcome is usually evaluated by the ROC analysis (8). However, in the present study, the performances of continuous multifractal predictor values were additionally assessed by the single classification tree pattern recognition model. Such model has an advantage of not making assumptions about the data structure, thus reducing the risk of model misspecification. The calculated accuracies of such stratification are presented in Table 1. The ROC analysis was performed on values of all individual images (Figure 3A) and also on the average values for images of the same tumor (Figure 3B). It is obvious from Figure 3 that a fair AUC value was already obtained on the level of individual images for a Dqmax multifractal feature (-0.65; CI95% 0.62 - 0.68). At the level of individual patients, the AUC value has improved to a range between 0.80 and 0.90, which is generally regarded as excellent (-0.82; CI95% 0.70 - 0.91).

Receiver operating characteristic (ROC) curves for diagnostic efficacy assessment of Dqmax regarding determining response to chemotherapy (per image approach and per patient approach). A, ROC diagram for Dqmax obtained on the 900 individual MR images; B, ROC diagram for Dqmax obtained on MR images averaged for each patient. The AUC values were transformed from below to above 0.5 for their easier comparison. A negative sign was therefore added to preserve the information of the inverse association between Dqmax and chemotherapy response.

The need for evaluation of the relative predictive power of different multifractal features derives from the fact that this type of analysis delivers numerous parameters. Based on the use of each variable as a primary and surrogate splitter, we have calculated the importance ranking score. Thereby, a variable that was selected as a primary splitter earlier in the tree was considered more important. The variable importance in classification of good and poor chemotherapy responder groups was as follows:

Dqmax = 100.0

αf max= 32.0

f(α)max= 31.0

f(α)min= 11.5

Dq = 5.1

αf min= 2.9

Dqmax, the maximum fluctuation amplitude of Dq, was identified here as the most important predictive parameter and its score adjusted to a value of 100. For better comparison, all other predictors were corrected proportionately. The indication of Dqmax as the best-performing predictive multifractal parameter obtained by the classification tree was confirmed by the ROC analysis of the multifractal features (not shown), while AUC curves for the best-performing Dqmax feature are presented in Figure 3.

Table 1.

Classification of Good and Poor Chemotherapy Responder MR Images by Multifractal Analysis

ParameterPerformance, %a
Accuracy74.3
Sensitivity72.4
Specificity76.2
Positive predictive value 75.3
Negative predictive value 73.5
F-Measure0.78

5. Discussion

Chemoresistance remains the main limit of the clinical effectiveness in osteosarcoma. This is due to the lack of tools that could reliably predict the most effective treatment consisting initially of either induction chemotherapy or amputation in larger tumors with narrow surgical margins (3). The present study thus set out to investigate the potential value of morphologic evaluation of osteosarcoma in predicting the response to chemotherapy.

Clinical validity is a criterion for how consistently and accurately the test performs. It should be noted that there are no general thresholds that define a test to be clinically valid and also no possibility of comparison with any previous similar studies on the validity of MR image analysis in osteosarcoma for prediction of the tumor response to cytotoxic therapy. A comparable study of MR images was however performed on breast tumors with established predictive significance but did not provide any accuracy data (25). The accuracy of 74% obtained in the current study together with the good specificity and sensitivity obtained on individual images (72% sensitivity, 76% specificity; Table 1) and patients (70% sensitivity and 86% specificity for Dqmax; Figure 3) were an indication of good predictive value, comparable to the predictive accuracy of 82% obtained in our previous study of breast cancer patients with the similar multifractal image analysis approach (13). The predictive studies related to osteosarcoma are focused on molecular markers, with many candidate predictors including RUNX2, CDC5L, MDM2, RECQL4, and CDK4. Their prognostic significance has been established, but unfortunately, quantitative measures of association such as accuracy and AUC have typically not been calculated (5), thus limiting any direct comparison with the results of the current study.

The prognosis is quite favorable for good chemotherapy responders, while it is poor for non-responders. The response of osteosarcoma patients to induction chemotherapy is therefore critical for disease outcome. Limb salvage procedures are safe and do not jeopardize the outcome of the patient, if wide surgical margins are possible. The clinical utility of the predictive test described here is most relevant for patients with borderline surgical margin width because the prediction of chemotherapy resistance in this subset could reinforce the decision to substitute the induction chemotherapy either with an experimental protocol (clinical trial) or an amputation. This could improve the disease outcome and survival by means of reducing the probability of distant metastasis occurrence during the several months’ course of an induction chemotherapy to which the tumor is resistant.

The noted predictive power of 
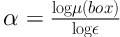
Dqmax could be explained by the existence of unknown tumor histomorphological features that are typical for either responsiveness or unresponsiveness to chemotherapy. These features may arise from different growth patterns of malignant cells depending on whether they are chemoresistant or chemosensitive. The previous study considering the prediction of a chemotherapy response of breast carcinoma based on multifractal analysis of microscopic histopathology images identified f(α)max as the best performing prediction parameter (13), while in prognostic studies f(α)min and Dqmax were the best performers (8). The observed discrepancy can be explained by different tumor and imaging types and by differences in chemotherapy.

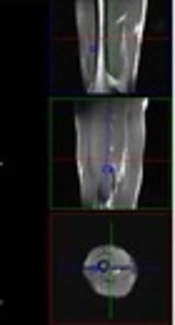
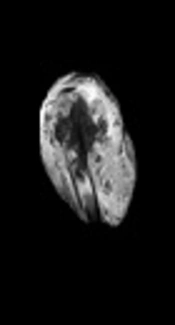
In conclusion, by using prediction of the chemotherapy response as a model, we have tested the hypothesis that computational analysis of routinely collected magnetic resonance images together with the machine-learning classification techniques, could enhance conventional strategies of individual therapy adjustments. Thereby, the multifractal analysis of primary osteosarcomas prior to chemotherapy was here shown for the first time to possess sufficient morphometric discriminating capacity to differentiate between tumor MR images based on their actual chemoresponsiveness. This is of crucial importance as osteosarcoma patients frequently develop resistance to induction chemotherapy, which is still a major obstacle to achieving more favorable outcomes. Among the employed multifractal parameters Dqmax exerted the best predictive power. The generalizability of the classification model was supported by the internal ten V-fold cross validation, though additional studies in external patient groups would be needed for further characterization of the predictive clinical validity of Dqmax. The potential clinical benefit of improvements in chemotherapy prediction derives from the key impact of the correct choice between induction chemotherapy and amputation on the life quality and survival. Usefulness of this methodology is further potentiated by its cost-effectiveness emerging from rapid analysis of digital MR images that are routinely collected but currently still underexploited.

References

  • 1.

    Gurney JG, Davis S, Severson RK, Fang JY, Ross JA, Robison LL. Trends in cancer incidence among children in the U.S. Cancer. 1996;78(3):532-41. [PubMed ID: 8697401]. https://doi.org/10.1002/(SICI)1097-0142(19960801)78:3<532::AID-CNCR22>3.0.CO;2-Z.

  • 2.

    D'Adamo DR. Appraising the current role of chemotherapy for the treatment of sarcoma. Semin Oncol. 2011;38 Suppl 3:S19-29. [PubMed ID: 22055968]. https://doi.org/10.1053/j.seminoncol.2011.09.004.

  • 3.

    Luetke A, Meyers PA, Lewis I, Juergens H. Osteosarcoma treatment - where do we stand? A state of the art review. Cancer Treat Rev. 2014;40(4):523-32. [PubMed ID: 24345772]. https://doi.org/10.1016/j.ctrv.2013.11.006.

  • 4.

    Kubota D, Mukaihara K, Yoshida A, Tsuda H, Kawai A, Kondo T. Proteomics study of open biopsy samples identifies peroxiredoxin 2 as a predictive biomarker of response to induction chemotherapy in osteosarcoma. J Proteomics. 2013;91:393-404. [PubMed ID: 23911960]. https://doi.org/10.1016/j.jprot.2013.07.022.

  • 5.

    Martin JW, Chilton-MacNeill S, Koti M, van Wijnen AJ, Squire JA, Zielenska M. Digital expression profiling identifies RUNX2, CDC5L, MDM2, RECQL4, and CDK4 as potential predictive biomarkers for neo-adjuvant chemotherapy response in paediatric osteosarcoma. PLoS One. 2014;9(5). e95843. [PubMed ID: 24835790]. https://doi.org/10.1371/journal.pone.0095843.

  • 6.

    Karperien A, Ahammer H, Jelinek HF. Quantitating the subtleties of microglial morphology with fractal analysis. Front Cell Neurosci. 2013;7:3. [PubMed ID: 23386810]. https://doi.org/10.3389/fncel.2013.00003.

  • 7.

    Chen DR, Chang RF, Chen CJ, Ho MF, Kuo SJ, Chen ST, et al. Classification of breast ultrasound images using fractal feature. Clin Imaging. 2005;29(4):235-45. [PubMed ID: 15967313]. https://doi.org/10.1016/j.clinimag.2004.11.024.

  • 8.

    Rajkovic N, Kolarevic D, Kanjer K, Milosevic NT, Nikolic-Vukosavljevic D, Radulovic M. Comparison of Monofractal, Multifractal and gray level Co-occurrence matrix algorithms in analysis of Breast tumor microscopic images for prognosis of distant metastasis risk. Biomed Microdevices. 2016;18(5):83. [PubMed ID: 27549346]. https://doi.org/10.1007/s10544-016-0103-x.

  • 9.

    Nyirenda N, Farkas DL, Ramanujan VK. Preclinical evaluation of nuclear morphometry and tissue topology for breast carcinoma detection and margin assessment. Breast Cancer Res Treat. 2011;126(2):345-54. [PubMed ID: 20446030]. https://doi.org/10.1007/s10549-010-0914-z.

  • 10.

    Waliszewski P. Computer-Aided Image Analysis and Fractal Synthesis in the Quantitative Evaluation of Tumor Aggressiveness in Prostate Carcinomas. Front Oncol. 2016;6:110. [PubMed ID: 27242954]. https://doi.org/10.3389/fonc.2016.00110.

  • 11.

    Dimitrakopoulou-Strauss A, Strauss LG, Egerer G, Vasamiliette J, Mechtersheimer G, Schmitt T, et al. Impact of dynamic 18F-FDG PET on the early prediction of therapy outcome in patients with high-risk soft-tissue sarcomas after neoadjuvant chemotherapy: a feasibility study. J Nucl Med. 2010;51(4):551-8. [PubMed ID: 20351350]. https://doi.org/10.2967/jnumed.109.070862.

  • 12.

    Captur G, Karperien AL, Li C, Zemrak F, Tobon-Gomez C, Gao X, et al. Fractal frontiers in cardiovascular magnetic resonance: towards clinical implementation. J Cardiovasc Magn Reson. 2015;17:80. [PubMed ID: 26346700]. https://doi.org/10.1186/s12968-015-0179-0.

  • 13.

    Vasiljevic J, Pribic J, Kanjer K, Jonakowski W, Sopta J, Nikolic-Vukosavljevic D, et al. Multifractal analysis of tumour microscopic images in the prediction of breast cancer chemotherapy response. Biomed Microdevices. 2015;17(5):93. [PubMed ID: 26303582]. https://doi.org/10.1007/s10544-015-9995-0.

  • 14.

    Kanjer K, Tatic S, Neskovic-Konstantinovic Z, Abu Rabi Z, Nikolic-Vukosavljevic D. Treatment response to preoperative anthracycline-based chemotherapy in locally advanced breast cancer: the relevance of proliferation and apoptosis rates. Pathol Oncol Res. 2013;19(3):577-88. [PubMed ID: 23526163]. https://doi.org/10.1007/s12253-013-9621-5.

  • 15.

    Cohen JF, Korevaar DA, Altman DG, Bruns DE, Gatsonis CA, Hooft L, et al. STARD 2015 guidelines for reporting diagnostic accuracy studies: explanation and elaboration. BMJ Open. 2016;6(11). e012799. [PubMed ID: 28137831]. https://doi.org/10.1136/bmjopen-2016-012799.

  • 16.

    Miglior S, Albe E, Guareschi M, Mandelli G, Gomarasca S, Orzalesi N. Intraobserver and interobserver reproducibility in the evaluation of ultrasonic pachymetry measurements of central corneal thickness. Br J Ophthalmol. 2004;88(2):174-7. [PubMed ID: 14736765].

  • 17.

    Schindelin J, Arganda-Carreras I, Frise E, Kaynig V, Longair M, Pietzsch T, et al. Fiji: an open-source platform for biological-image analysis. Nat Methods. 2012;9(7):676-82. [PubMed ID: 22743772]. https://doi.org/10.1038/nmeth.2019.

  • 18.

    Jimenez J, Lopez AM, Cruz J, Esteban FJ, Navas J, Villoslada P, et al. A Web platform for the interactive visualization and analysis of the 3D fractal dimension of MRI data. J Biomed Inform. 2014;51:176-90. [PubMed ID: 24909817]. https://doi.org/10.1016/j.jbi.2014.05.011.

  • 19.

    Fabrizii M, Moinfar F, Jelinek HF, Karperien A, Ahammer H. Fractal analysis of cervical intraepithelial neoplasia. PLoS One. 2014;9(10). e108457. [PubMed ID: 25302712]. https://doi.org/10.1371/journal.pone.0108457.

  • 20.

    Landini G. Fractals in microscopy. J Microsc. 2011;241(1):1-8. [PubMed ID: 21118245]. https://doi.org/10.1111/j.1365-2818.2010.03454.x.

  • 21.

    Evertsz CJ, Mandelbrot BB, Woog L. Variability of the form and of the harmonic measure for small off-off-lattice diffusion-limited aggregates. Phys Rev A. 1992;45(8):5798-804. [PubMed ID: 9907681].

  • 22.

    Braverman B, Tambasco M. Scale-specific multifractal medical image analysis. Comput Math Methods Med. 2013;2013:262931. [PubMed ID: 24023588]. https://doi.org/10.1155/2013/262931.

  • 23.

    Reljin B, Paskas M, Reljin I, Konstanty K. Breast cancer evaluation by fluorescent dot detection using combined mathematical morphology and multifractal techniques. Diagn Pathol. 2011;6 Suppl 1. S21. [PubMed ID: 21489192]. https://doi.org/10.1186/1746-1596-6-S1-S21.

  • 24.

    Malley JD, Kruppa J, Dasgupta A, Malley KG, Ziegler A. Probability machines: consistent probability estimation using nonparametric learning machines. Methods Inf Med. 2012;51(1):74-81. [PubMed ID: 21915433]. https://doi.org/10.3414/ME00-01-0052.

  • 25.

    Di Giovanni P, Ahearn TS, Semple SI, Lovell LM, Miller I, Gilbert FJ, et al. The biological correlates of macroscopic breast tumour structure measured using fractal analysis in patients undergoing neoadjuvant chemotherapy. Breast Cancer Res Treat. 2012;133(3):1199-206. [PubMed ID: 22447179]. https://doi.org/10.1007/s10549-012-2014-8.