

1. Background
The incidence of brain metastases is frequent, on the rise, and associated with poor prognosis. Therefore, it is essential to accurately detect the location of brain metastases for treatment as well as prognosis, and survival of the patient (1, 2). To this end, MRI scan is more sensitive than CT scan in diagnosing and detecting metastatic tumors of the brain (3, 4). Increasing the dose of the contrast medium or delaying the scanning time may allow for better detection of the lesions (5, 6). Increasing the dose of the contrast medium may also induce acute kidney failure and fibrosis, especially in patients with renal disease (7). Dose of the contrast medium therefore can be increased in a restricted manner. Hence, exploring new contrast agents and finding the optimal delay time is a more suitable option.
Gadobutrol (Gadovist; Bayer Schering Pharma AG, Berlin, Germany) is a gadolinium-chelating agent that has been recently introduced into clinical practice. It has a concentration of 1.0 mol/L (1 M), which is two times higher than other commonly used contrast agents (eg, gadopentetate dimeglumine [Gd-DTPA], 0.5 M). Additionally, gadobutrol has an inherently higher T1 relaxivity than Gd-DTPA (8-11). Results from animal and human studies have demonstrated an increased detection of metastatic brain lesions by gadobutrol because of its higher concentration and relaxivity compared with the same dose of Gd-DTPA (12-14). However, there are limited studies that have evaluated different delay times of gadobutrol (8, 15).
2. Objectives
The present study evaluated the effect of different delay times (3, 7, and 10 minutes) following the administration of a single dose of gadobutrol and compared the MR enhancement efficacy to optimize clinical detection of brain metastases.
3. Patients and Methods
3.1. Patient Population
This single-center study enrolled a total of 52 male and female patients (n = 26 each) diagnosed with or highly suspected of having brain metastases from May 2012 to February 2015. The patients were between 31 and 82 years of age (mean age, 56.7 ± 12.6 years) at the time of enrollment. The patients were included if: 1, they were diagnosed with primary extracranial malignancy; and 2, diagnosed with intracerebral metastases or were highly suspected (based on clinical symptoms such as intense headache or neurological symptoms) of brain metastases. Patients were considered ineligible for inclusion in the study if they had contraindications to undergo MRI, allergy to gadolinium contrast agent, were pregnant and lactating, had a cardiac pacemaker, had severe cardiovascular disease, or had acute or chronic renal failure. The primary malignant tumor site included the lungs (n = 27), breasts (n = 13), digestive tract (n = 5), kidneys (n = 4), malignant peripheral nerve sheath (n = 1), and tumor of unknown origin (n = 2).
3.2. MRI Scan Method
MRI was performed using GE Signa HDxt 3.0 T MR Scanner with 8-channel head phased array coil. The scanning sequences included the pre-enhancement axial T1 FLAIR sequence, the axial DWI sequence, and three axial T1 FLAIR sequences at enhanced delays of 3-, 7-, and 10- min. T1 FLAIR sequence parameters after MRI plain scan and enhancement were as follows: repetition time, 1800 ms; echo time, 24 ms; inversion time, 750 ms; echo train length, 8; matrix, 512 × 512; number of excitations, 2; layer thickness, 5 mm; interval, 1 mm; field of view, 24 cm2. All the patients received 0.1 mmol/kg dose of the contrast agent gadobutrol with a high pressure injector at a drug injection rate of 3.0 mL/s, followed by 20-mL saline injections at 3.0 mL/s.
3.3. Image Quality Evaluation
All images were saved in DICOM format and uploaded to GE AW4.2 workstation. The images were evaluated by two experienced radiologists. In case of a difference in opinion regarding an image, the radiologists reached a common conclusion after discussion. The evaluation criteria included the image quality and number of metastases. The evaluation criteria for quality of the lesion edge, lesion interior, and overall image qualities are presented in Table 1.
| Scoring Method | Evaluation Criteria |
|---|---|
| 4-score scale for “lesion edge” | 1: Lesion border development or boundary is not clear (no margin or unclear margin of the lesion displayed) |
| 2: Part of lesion border was developed | |
| 3: Lesion border was developed clearly but was not complete | |
| 4: Lesion border was developed clearly and completely | |
| 3-score scale for “lesion internal image quality assessment” | 1: Lesion structure and internal morphology image quality were very poor |
| 2: Lesion structure and internal morphology were partially seen | |
| 3: Lesion structure and internal morphology were completely seen | |
| 5-score scale for “overall image quality assessment” | 1: Lesion border was fuzzy, the internal morphology had poor contrast, and the signal was low |
| 2: Lesion border was fuzzy or the internal morphology had poor contrast and the signal was low | |
| 3: Lesion border was slightly fuzzy, the internal morphology had slightly poor contrast, and the signal was acceptable | |
| 4: Lesion border was fuzzy or the internal morphology had slightly poor contrast and the signal was acceptable | |
| 5: Lesion border was clear, the internal morphology had good contrast, and the signal was good |
Evaluation Criteria for Image Quality of Lesion Edge, Lesion Interior, and Overall Image Qualities
3.4. Objective Evaluation
Regions of interest (ROI) were drawn freehand. The enhanced edge of cross section of the largest lesion was drawn freehand on axial T1 FLAIR sequence, excluding necrosis and hemorrhage area. To test ROI of normal-appearing white matter and airborne noise, the normal-appearing white matter area and the airborne noise area at the contralateral symmetrical place of lesions were selected and attached with circular or elliptical ROI of 50 - 65 mm2 or 200 - 500 mm2 surface area. Each lesion was measured three times and the average signal intensity value was obtained for each lesion. Metastases signal-to-noise ratio (SNR), contrast-to-noise ratio (CNR), contrast enhancement (CE), contrast-to-brain ratio (CBR), and CE ratio (CER) were calculated separately using the following formulae (16, 17).
SNR = SIlesion/SDair
CNR = (SIlesion - SIwhite matter)/ SDair
CE = (SIlesion, post - SIlesion, pre)/ SDair
CBR = (SIlesion - SIwhite matter)/ SIwhite matter
CER = (SIlesion, post - SIlesion, pre)/ SIlesion, pre
SIlesion, SIwhite matter, pre-SIlesion, and post-SIlesion stand for the average signal intensity value of brain metastases tumor lesions, normal white matter of lesion contralateral symmetrical site, and brain metastases tumor lesions before/after enhancement, respectively. SDair stands for measurement of mean airborne noise ± SD.
With regard to the selection of metastatic lesion numbers, no more than five metastatic lesions were selected from the same patient. For patients with more than five metastatic lesions, the lesions were categorized into three groups based on their diameter: ≤ 5 mm, > 5 mm, and ≤ 10 or > 10 mm. The authors selected 1 - 2 lesions from each category, with the total number of less than 5 lesions per patient. A total of 120 lesions from 34 patients with brain metastases were included for evaluation of lesion quality. SNR, CNR, CE, CBR, and CER were evaluated for 87 lesions following exclusion of lesions (with a diameter of < 3 mm) with inaccurate volume effect measurements.
3.5. Statistical Analysis
SPSS for windows ver. 13.0 (SPSS Inc., 2004, Chicago, Il) was used for statistical analysis. Measurement data were indicated as mean (± SD). The difference in three time points was analyzed using analysis of variance (ANOVA) and Friedman M test, and P < 0.05 was considered as significant. When P value was < 0.05, the difference between two delay times was further compared using paired comparison method (for post hoc pairwise multiple comparison, Wilcoxon signed-rank test was used). A kappa (K) test analyzed the consistency in evaluations performed by two radiologists, where K ≤ 0.20 was considered as poor consistency; 0.21 ≤ K ≤ 0.40 was considered as acceptable consistency; 0.41 ≤ K ≤ 0.60 was considered as middle consistency; 0.61 ≤ K ≤ 0.80 was considered as good consistency; and 0.81 ≤ K ≤ 1.00 was considered as excellent consistency.
4. Results
4.1. Image Quality and Brain Metastases Lesion Count
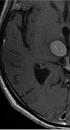
The enhanced front and rear axial T1 FLAIR sequence images of all 52 patients qualified for clinical diagnosis. Of the study population, 34 patients were diagnosed with brain metastases. The images of 3-, 7-, and 10-min delay groups had 295, 301, 301 lesions, respectively. The additional six lesions detected in the 7- and 10-min delay groups had diameters of < 5 mm and no apparent edema around. One of the male patients was detected with only one lesion with a 3-min delay time; however, the 7- and 10-min delay times showed two lesions (Figure 1). There was similar number of lesions in the 7- and 10-min delay images. The lesions showed a tendency of centripetal filling with increase in delay time (Figure 2).
, 7 (B), and 10-min (C) delay time. Only one lesion was observed after the 3-min delay (not seen in this image); however, another lesion was observed in the right temporal lobe after 7- and 10-min delay.")
Axial T1 FLAIR images of a 62-year-old male patient with brain metastases from lung cancer. Axial T1 FLAIR images at 3 (A), 7 (B), and 10-min (C) delay time. Only one lesion was observed after the 3-min delay (not seen in this image); however, another lesion was observed in the right temporal lobe after 7- and 10-min delay.
, 7 (B), and 10-min (C) delay time. As the delay time was extended, the lesions showed a tendency of centripetal filling.")
Axial T1 FLAIR images of a 58-year-old male patient with brain metastases from lung cancer. Axial T1 FLAIR images at 3 (A), 7 (B), and 10-min (C) delay time. As the delay time was extended, the lesions showed a tendency of centripetal filling.
4.2. Metastatic Tumor Display Quality Evaluation
The evaluation scores for all the 120 lesions from 34 patients at all delay times are presented in Table 2. The 7- and 10-min delay time groups had higher evaluation scores (for edge, internal, and overall) than the 3-min group; however, there was no significant difference in the evaluation scores between the 3-, 7- and 10-min groups. All the delay time groups had non- significant difference in score of lesion detail (edge and interior) and overall demonstration after categorization into different sizes (< 5-mm nodules [n = 50]; 5- to 10-mm nodules [n = 30]; and > 10-mm nodules [n = 40]). The kappa values of image score evaluated by two experienced radiologists for visible lesions edge, lesion interior detail, and lesion overall demonstration were between 0.523 and 0.715, representing good consistency.
| Delay Time (min) | Radiologist 1 | Radiologist 2 | ||||
|---|---|---|---|---|---|---|
| Edge | Internal | Overall | Edge | Internal | Overall | |
| 3 | 3.63 ± 0.67 | 2.80 ± 0.46 | 4.40 ± 0.96 | 3.56 ± 0.74 | 2.83 ± 0.42 | 4.42 ± 0.98 |
| 7 | 3.72 ± 0.57 | 2.88 ± 0.36 | 4.58 ± 0.75 | 3.68 ± 0.57 | 2.88 ± 0.38 | 4.57 ± 0.75 |
| 10 | 3.66 ± 0.64 | 2.89 ± 0.36 | 4.53 ± 0.82 | 3.58 ± 0.71 | 2.80 ± 0.42 | 4.48 ± 0.83 |
Evaluation Score for All Chosen Brain Metastasis Tumor Details at Different Gadobutrol-Enhancement Delay Time Points (N = 120)a
4.3. Objective Evaluation
For objective evaluation, 87 brain metastasis tumors with different sizes were included (Table 3). The enhancement delay of 7 and 10 minutes showed significantly higher CNR and CBR (P < 0.05) values than an enhancement delay of 3 minutes. Furthermore, paired comparison conducted for CNR and CBR values between 3 versus 7 minutes, 3 versus 10 minutes, and 7 versus 10 minutes showed a significant difference only for the first two comparisons (P < 0.05) and not for the third (7 vs. 10 minutes) comparison. SNR, CE, and CER values of brain metastasis tumor were similar for 3, 7, and 10-min gadobutrol-enhancement delay times (P > 0.05).
5. Discussion
Contrast-enhanced MRI is the standard for diagnosis and follow-up of brain metastases tumor. Compared with other imaging methods, MRI has obvious advantages of multidimensional imaging, high soft tissue resolution, and not using/providing ionizing radiations. However, the limitations of MRI are a need for more scanning sequences and a longer examination time (14). Delayed MRI scanning has shown improved detection of the brain metastases lesions than with immediate scanning. In developing countries like China, hospitals do not have adequate MRI equipment for medical examination and diagnosis of such large population. In addition, the examination time cannot be extended infinitely to improve diagnostic efficiency. Therefore, different delay times (3, 7, and 10 minutes) are compared in this study to find an optimal delay time to increase diagnostic efficacy within a reasonable time.
Previous studies have reported increased sensitivity and detection of more number of lesions with delayed CE-MRI than with an immediate scan. However, the optimal delay time is not yet clear (5, 15, 18). Yuh et al. conducted a study on 45 patients with brain metastases. The patients received a cumulative standard dose of 0.1 mmol/kg gadoteridol (n = 16) and a cumulative triple dose of 0.3 mmol/kg gadoteridol (n = 29). There was an increase in the detection of brain lesions (< 0.5 mm in size) if the diagnosis was performed after 10- and 20-min delay compared with the initial immediate dose in both groups. No significant difference in detection was observed for lesions larger than 10 mm in size (5). In another study, three MRI scans (5, 10, and 15 minutes) after administration of the contrast medium detected at least one new lesion in every subsequent scan. The volume of the lesions significantly increased from scan 1 to scan 2 and from scan 2 to scan 3 (18). Increased mass of the tumor and edema were the reasons for easy diagnosis of large lesions. Newer and smaller lesions, however, were often located in the border area of the cortex and medulla without edema and therefore, were difficult to be detected by regular imagological examination methods. However, early detection of small lesions is very critical for clinical staging and treatment planning (5, 19). A number of studies performed to study the effect of high-dose contrast agents have demonstrated enhanced lesion detection in patients with brain metastases compared to low-dose contrast agents (12, 20).
To date, the available studies have used linear structured Gd-DTPA and there are no studies that have used circular structured gadobutrol. Consistent with the earlier studies that have reported detection of lesions less than 5 mm (5, 18), this study also reports detection of an additional six lesions in the 7- and 10-min delay groups compared with the 3-min group. All the additionally detected lesions had diameters of less than 5 mm. This detection was of particular interest in one patient who was diagnosed with a single brain metastases lesion on MR examination of 3-min delay, but was diagnosed as having two lesions following MR examination after 7- and 10-min delay. In such cases, the patient’s clinical treatment plan may change. From a patient management viewpoint, changes from one to two lesions may have important clinical implications, especially in the absence of stereotactic radiosurgery when the available treatment option was aggressive local surgery (1, 3).
In the present study, the average quality score of lesion edge, interior of lesion, and overall image qualities were measured on 4-, 3-, and 5-score scales, respectively. All the parameters were non-significantly higher in the 7-min and 10-min groups, indicating that the subjective evaluation of the 7- and 10-min delay groups was comparable with that of the 3-min delay group. Furthermore, objective evaluation showed that CNR and CBR were significantly higher in the 7- and 10-min groups than in the 3-min group. However, there was no significant difference in CNR and CBR between the 7- and 10-min groups. Detection of brain metastases requires reasonably high lesion contrast, which depends on the signal of a lesion in relation to the surrounding background (5). The parameters of image quality (21) reflect the strengthened differences between lesions and their surrounding white matter. Significantly higher CNR and CBR in the 7- and 10-min groups indicated better contrast between the lesion and the surrounding white matter compared with the 3-min group. The greater contrast allowed for greater visibility and distinguishability, resulting in the detection of six additional lesions.
SNR, CE, and CER of metastatic brain lesions did not differ significantly after enhancement delay of 3, 7, and 10 minutes indicating the persistent enhancement of lesions, which was different from glioma. For glioma, the enhancement peak was 1 - 3 minutes, and then the enhancement level would decline and assume to clean up the lesion profile for clear visibility (16, 22). With delay in the imaging time, brain metastases lesions were filled up with the contrast agent in some patients (23). This result provided a theoretical basis for the detection of more small lesions by delay scanning method. With increase in delay time, the gadolinium contrast agent might have leaked through the blood-brain barrier in larger quantities resulting in accumulation of the contrast agent and resulting in increased signal intensity (4, 24).
There are some limitations associated with this study. First, the pathological evidence was only available for primary tumor for all patients and not for the intracranial lesions. The diagnosis was mainly based on typical imaging manifestations and clinical follow-up. Second, unlike other studies (5, 18), the delay time was up to 10 minutes, and this was mainly because well-known Chinese hospitals do not allow for longer examination time due to excess clinical work. Finally, the small sample size of this study does not allow for generalization of the findings. Therefore, additional studies with larger sample size are required to validate the results of this study.
In conclusion, the higher scores for subjective assessment (lesion edge and internal details of the lesion), and significant improvement in the objective assessment (for CNR and CBR) demonstrated 7 minutes of Gadobutrol-enhanced MRI delay time as the optimal time for diagnosis of brain metastases in this study. However, larger studies are warranted to confirm these results.
