


1. Background
Pulmonary embolism (PE) is a widespread and serious health problem with high mortality rates. It usually results from thrombosis of the deep veins in lower extremities (1). Computed tomography pulmonary angiography (CTPA) is used as a preferred imaging tool in the diagnosis of PE (2-4). Magnetic resonance imaging (MRI) has become a feasible imaging method with the recent developments in gradient technology, multichannel coils, and parallel imaging techniques, which make it possible to obtain fast acquisition sequences with high temporal resolution. Unenhanced MRI sequences or contrast-enhanced magnetic resonance pulmonary angiography (MRPA) are particularly useful in patients with clinical suspicion for pulmonary embolism who have contraindications for CTPA scanning (i.e. pregnancy, allergy to iodine-containing contrast medium), or in patients for whom ionizing radiation exposure is a major concern (5-8).
The diagnostic criteria for PE on MRPA and CTPA include a contrast medium filling defect in pulmonary artery (filling defect in the entire lumen or filling defect surrounded by contrast medium), and enlargement of affected pulmonary artery compared to adjacent similar patent arteries (3, 6-8). In pulmonary embolism, pulmonary arterial resistance increases and pulmonary venous flow decreases due to pulmonary arterial occlusion (9-12). Several studies have shown that increased right to left ventricle ratio (RV/LV) on CT is a poor prognostic factor and indicates right heart dysfunction in patients with PE (13, 14). Also, due to markedly decreased pulmonary venous drainage, a hypodense filling defect on the same side pulmonary vein (PV) on CTPA has been defined as pulmonary vein sign (PVS) or insufficient contrast medium filling (ICMF) in pulmonary veins (15, 16). It has also been reported that the presence of PVS (used synonymously for ICMF) in pulmonary veins on CTPA is a poor prognostic indicator in patients with acute pulmonary embolism (16). However, to the best of our knowledge there are no studies in the literature that investigated the presence of PVS on MRI in PE suspected cases and that evaluated combined PVS and RV/LV ratio on MRI for determining the severity of PE.
2. Objectives
Herein, we aimed to prospectively evaluate PVS on CTPA and unenhanced MRI in patients with PE suspicion. We also aimed to investigate the relationship between the severity of PE and presence of PVS, RV/LV ratio and combination of these two on unenhanced MRI.
3. Patients and Methods
This prospective cross-sectional study has begun after ethics committee of Pamukkale University Faculty of Medicine, Denizli, Turkey approved our letter of application (reference number: 60116787-020/85545). Informed consent was taken from the patients who agreed to participate in the study.
3.1. Study Group
This prospective HIPAA-compliant study was conducted at a tertiary hospital (Pamukkale University Medical Center) and informed consents were obtained from all patients before the study. The study population was recruited from 635 patients who had undergone CTPA for suspected acute pulmonary embolism between October 2017 and September 2018. Patients who agreed to undergo unenhanced MRI after CTPA were included. Patients with fibrotic lung disease, congestive heart failure and contraindications for MRI, those who were uncooperative, younger than 18 years, pregnant, and those with a duration of > 48 hours between CTPA and MRI, and those with a history of cardiopulmonary surgery, radiotherapy or cardiac ablation therapy were excluded. Briefly, in this cross-sectional study, all patients who met the inclusion criteria and accepted to participate in the study between October 2017 and September 2018 were evaluated.
3.2. Computed Tomography Pulmonary Angiography
Computed tomography (CT) imaging was performed using annually calibrated 16-detector row scanner (Brilliance 16, Philips Medical Systems). The area between the thoracic inlet and the deep costophrenic sulcus was scanned during suspended shallow inspiration in the supine position. The scanning parameters were as follows: tube voltage, 120 kV; tube current, 100 mAs; collimation, 16 × 0.75 mm; field of view (FOV), 300 mm; matrix, 512 × 512; rotation time, 0.75 seconds; table speed, 15 mm/s and beam pitch, 0.94. We administered 75 - 80 mL of iopromide (Ultravist 370 mg I/mL, Bayer Health Care) from the antecubital vein at a rate of 4 mL/s. The raw data were reconstructed as 3 mm thick transverse sections with 1.5 mm reconstruction intervals, and all images were transferred to the workstation (Extended Brilliance Workspace, Philips Medical Systems).
3.3. Magnetic Resonance Imaging
All magnetic resonance (MR) images were obtained using annually calibrated 1.5 Tesla superconductive magnet (GE Signa Excite HD, GE Medical Systems) and 8-channel phased-array torso coil positioned over the anterior and posterior chest. The maximum gradient strength was 33 mT/m and slew rate was 120 mT/m/s. The FOV was set to 40 × 32 cm to include the area between the thoracic inlet and the crura of the diaphragm while the patient was in supine position with arms along the sides. Fat-suppressed unenhanced steady state free precession (SSFP) MR images were obtained using “fast imaging employing steady-state acquisition (FIESTA)” during breath hold or free breathing according to clinical condition of the subjects. The MR imaging parameters were as follows: Time to repetition/time to echo (TR/TE), 4.2/1.8 msn; Flip angle, 70°; number of excitations (NEX), 2; matrix 288 × 160; and slice thickness/gap, 4/1.5 mm.
3.4. Image Interpretation
All CTPA images were evaluated for the presence of PE by a radiologist (observer 1) with 4-year experience in thoracic imaging. CTPA images were evaluated in mediastinal (WW: 350, WL: 50) window settings. The evaluation was mainly performed using the transverse sections, but the reader was free to change the window settings and perform multiplanar reconstruction (MPR) and maximum intensity projection (MIP) if needed. The presence and location of PE were recorded in the standard forms. To determine the severity of PE in each patient, we used a computed tomography (CT) index; (Σ (n × d)/40) × 100, which was described by Qanadli and colleagues (17). The “n” represented the number of affected segmental arteries (“n” of 20 segmental arteries) and “d” represented the weight coefficient of obstruction in affected arteries (d = 0 indicates no embolism, d = 1 indicates partial obstruction, d = 2 total obstruction). The diagnosis of PE was made according to the presence of a hypodense filling defect in the pulmonary artery, total luminal filling defect or partial filling defect with an acute angle at least in two consecutive sections in the pulmonary arteries on CTPA images (3).
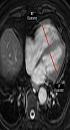
The PVS was accepted as previously defined on CTPA (15), as the presence of a hypointense filling defect of > 2 cm in a PV on unenhanced MR images. Two observers with 3 (observer 2) and 7 years (observer 3) of experience independently evaluated unenhanced MR images for the presence of PVS without knowing the results of CTPA. After that, these two observers reviewed the images together with 18 years experienced third observer (observer 4) to reach the final consensus for the presence of PVS. For evaluation of right ventricular dysfunction, each ventricular diameter was measured by consensus of these three observers on the axial MR images where it was largest, as previously described (Figure 1) (14). The ratio of the right to left ventricle axial diameters (RV/LV) were calculated and RV/LV > 1 was accepted as right ventricular dysfunction. Then, all CTPA images were evaluated by these three observers for the presence of PVS by consensus.
 and left ventricle (LV) diameter measurements on unenhanced MRI image")
A 52-year-old male with pulmonary embolism and a pulmonary index of 47.5%, right ventricle (RV) and left ventricle (LV) diameter measurements on unenhanced MRI image
3.5. Statistical Analysis
Data analysis was performed using SPSS software (SPSS Version 24, Chicago, IL, USA). Continuous variables (RV/LV ratio, PE obstruction index) were expressed as means and standard deviations (SD). Categorical variables (presence of PE, PVS and RV/LV > 1) were expressed as number and percentage. The Shapiro-Wilk and Kolmogorov-Smirnov tests were used to test the normality of the data distributions. If data were normally distributed with equal variance, Student’s t-test was used to evaluate the association between the mean PE index in patients with PVS, RV/LV > 1 and combination of these two; otherwise, the Mann-Whitney U-test was used. A p value of less than 0.05 was regarded as significant. Cohen’s Kappa analyses and values (κ) were used to assess the agreement between two observers and two imaging modalities. Kappa values (κ) was categorized as follows: κ = 0 - 0.20 poor; κ = 0.21 - 0.40 fair; κ = 0.41 - 0.60 moderate; κ = 0.61 - 0.80 good; and κ = 0.81 - 1.00 very good agreement (18). The correlations between PVS, RV/LV ratio or both and PE index were analyzed with Spearman’s correlation analyses.
4. Results
Of the 635 patients who underwent CTPA for suspected PE, 127 agreed to participate in the study. However, 15 patients were excluded from the study due to: three had known fibrotic lung disease (one with usual interstitial pneumonia and two with idiopathic pulmonary fibrosis), three without MRI within 48 hours after CTPA, three with suspicious or contradictory medical history, two had known heart failure, two had cardiac ablation history, one was < 18-years-old, one had MRI incompatible metallic hip prosthesis. Fifty-three patients with positive PE on CTPA and 59 patients without embolism (50 male and 62 female; mean age, 54.7 ± 14.2 years; range, 23 - 83 years) were enrolled in the study (Table 1). The median MRI acquisition time was 6 minutes (range, 3 - 9 minutes; mean ± SD, 6 ± 1.6). The mean period between CTPA and MRI scans was 23.8 ± 19.1 hours.
| All subjects | Pulmonary embolism (+) | Pulmonary embolism (-) | P value | |
|---|---|---|---|---|
| Number of subjects | 112 | 53 | 59 | |
| Gender, N | 0.011 | |||
| Female | 62 | 36 | 26 | |
| Male | 50 | 17 | 33 | |
| Age, y | 0.001 | |||
| Mean ± SD | 54.7 ± 14.2 | 59.2 ± 14 | 48.8 ± 12.4 | |
| PE index | ||||
| Median (range), % | 52.5 (5 - 77.5) | 52.5 (5 - 77.5) | - | |
| Interquartile range | 42.5 | 42.5 | - | |
| RV/LV ratio | 0.0001 | |||
| Median (range) | 0.91 (0.78 - 1.47) | 0.97 (0.81 - 1.47) | 0.87 (0.78 - 1.15) | |
| Interquartile range | 0.16 | 0.23 | 0.07 |
Descriptive Characteristics of the Study Population, and Pulmonary Embolism Severity Index, Right Ventricle to Left Ventricle Ratio in Groups
A total of 269 emboli were detected in 53 (47.3%) patients on CTPA. There were 91 emboli in the common and lobar pulmonary arteries; whereas, 178 emboli were detected at segmental level. Isolated segmental PE was detected in four patients on CT. Eleven of 53 patients (20.8%) had PE on one side lung (seven of them on the right side) and 42 patients had emboli in both lungs. The median value of PE index was 52.5% in patients with PE (range, 5% to 77.5%) (Table 1).
In the consensus evaluation of three observers, pulmonary vein sign (PVS) was present in 12 cases on unenhanced MRI and in 13 cases on CTPA (Figures 2 - 4). There was a very good agreement between two observers for the presence of PVS on unenhanced MRI (κ = 0.907). There was a statistically significant relationship between the location of PVS on MRI and the presence of pulmonary embolism at lobar (P = 0.001) levels of the pulmonary artery. There was a very good agreement between the CTPA and unenhanced MRI for the presence of PVS (κ = 0.865).
. B, Axial unenhanced steady-state free precession (SSFP) magnetic resonance image shows hypointense filling defect in the right lower lobe pulmonary vein (arrows).")
A 41-year-old male with pulmonary embolism and pulmonary embolism index was 75%. A, Axial contrast-enhanced computed tomography pulmonary angiography image shows hypoattenuating filling defect in the right lower lobe pulmonary vein (arrows). B, Axial unenhanced steady-state free precession (SSFP) magnetic resonance image shows hypointense filling defect in the right lower lobe pulmonary vein (arrows).
. B, Axial unenhanced steady-state free precession (SSFP) magnetic resonance image shows hypointense filling defect in the right lower lobe pulmonary vein (arrows).")
A 29-year-old male with pulmonary embolism and pulmonary embolism index was 62.5%. A, Axial contrast-enhanced computed tomography pulmonary angiography image shows hypoattenuating filling defect in the right lower lobe pulmonary vein (arrows). B, Axial unenhanced steady-state free precession (SSFP) magnetic resonance image shows hypointense filling defect in the right lower lobe pulmonary vein (arrows).
, hypoattenuating filling defect in the left upper lobe pulmonary vein (arrow). Normal contrast filling in the right upper lobe pulmonary vein is also seen (arrowheads). B, Axial unenhanced steady-state free precession (SSFP) magnetic resonance image shows hypointense filling defect in the left upper lobe pulmonary artery (dashed arrows) and hypointense filling defect in the left upper lobe pulmonary vein (arrow). Normal signal features in the right upper lobe pulmonary vein are also seen (arrowheads).")
A 36-year-old female with pulmonary embolism and pulmonary embolism index was 80%. A, Axial contrast-enhanced computed tomography pulmonary angiography image shows hypoattenuating filling defect in the left upper lobe pulmonary artery (dashed arrows), hypoattenuating filling defect in the left upper lobe pulmonary vein (arrow). Normal contrast filling in the right upper lobe pulmonary vein is also seen (arrowheads). B, Axial unenhanced steady-state free precession (SSFP) magnetic resonance image shows hypointense filling defect in the left upper lobe pulmonary artery (dashed arrows) and hypointense filling defect in the left upper lobe pulmonary vein (arrow). Normal signal features in the right upper lobe pulmonary vein are also seen (arrowheads).
In patients with PVS on CTPA or MRI, the median PE index was significantly higher than in patients without PVS (P = 0.0001 for both). In patients with RV/LV ratio > 1 on MRI, the median PE index was significantly higher than in patients with RV/LV ratio < 1 (P = 0.026). In patients with RV/LV ratio > 1 or had PVS on MRI, the mean PE index was significantly higher than those without (P = 0.003). In patients with both RV/LV ratio > 1 and had PVS on MRI, the median PE index was significantly higher than those without (P = 0.001) (Table 2). The presence of PVS on CTPA and MRI, RV/LV ratio, presence of RV/LV ratio >1 and both RV/LV > 1 and PVS on MRI are significantly correlated with PE index (Table 3).
| Finding | Positive | Negative | P value |
|---|---|---|---|
| PVS on CTPA | 0.0001 | ||
| Number of subjects | 13 | 40 | |
| Median PE index | 67.5 | 37.5 | |
| Interquartile range | 3 | 16 | |
| PVS on MRI | 0.0001 | ||
| Number of subjects | 12 | 41 | |
| Median PE index | 67.5 | 43.75 | |
| Interquartile range | 3 | 16 | |
| RV/LV ratio > 1 | 0.026 | ||
| Number of subjects | 24 | 29 | |
| Median PE index | 57.5 | 37.5 | |
| Interquartile range | 10 | 18 | |
| RV/LV ratio > 1 or PVS | 0.003 | ||
| Number of subjects | 31 | 22 | |
| Median PE index | 57.5 | 32.5 | |
| Interquartile range | 8 | 18 | |
| RV/LV ratio > 1 and PVS | 0.001 | ||
| Number of subjects | 8 | 45 | |
| Median PE index | 67.5 | 47.5 | |
| Interquartile range | 2 | 16 |
Relationship Between Pulmonary Embolism Severity Index and Presence of Pulmonary Vein Sign and Right Ventricle to Left Ventricle Ratio > 1 in Patients with Pulmonary Embolism
| PE index | PVS and RV/LV > 1 | PVS on CTPA | PVS on MRI | RV/LV > 1 | RV/LV ratio | RV/LV > 1 and PVS on MRI | |
|---|---|---|---|---|---|---|---|
| PE index | |||||||
| r | - | 0.429a | 0.567a | 0.487a | 0.332b | 0.519a | 0.415a |
| P value | 0.0014 | < 0.0001 | 0.0002 | 0.0151 | 0.0001 | 0.0020 | |
| PVS and RV/LV > 1 | |||||||
| r | - | 0.523a | 0.560a | 0.911a | 0.782a | 0.448a | |
| P value | < 0.0001 | < 0.0001 | < 0.0001 | < 0.0001 | < 0.0001 | ||
| PVS on CTPA | |||||||
| r | - | 0.866a | 0.381a | 0.579a | 0.765a | ||
| P value | < 0.0001 | < 0.0001 | < 0.0001 | < 0.0001 | |||
| PVS on MRI | |||||||
| r | - | 0.344a | 0.482a | 0.8010 | |||
| P value | 0.0002 | < 0.0001 | < 0.0001 | ||||
| RV/LV > 1 | |||||||
| r | - | 0.837a | 0.492a | ||||
| P value | < 0.0001 | < 0.0001 | |||||
| RV/LV ratio | |||||||
| r | - | 0.612a | |||||
| P value | < 0.0001 | ||||||
| RV/LV > 1 and PVS on MRI | |||||||
| r | - | ||||||
| P value |
Correlations Between Pulmonary Embolism Severity Index, Presence of Pulmonary Vein Sign and Right Ventricle to Left Ventricle Ratio > 1
5. Discussion
Our results showed that presence of pulmonary vein sign (synonym with insufficient contrast medium filling in pulmonary veins) on CT or MRI is significantly correlated with PE severity index and patients with PVS had more severe PE than those without. Therefore, it can be used as a sign of severe PE on unenhanced MRI and PVS may also be an indicator of right heart dysfunction. Presence of both PVS and RV/LV ratio > 1 on MRI indicates more severe pulmonary embolism than absence of PVS or RV/LV ratio > 1. There was a very good agreement for the detection of PVS between two observers on unenhanced MRI.
Koike and colleagues (19) showed that in patients with acute PE, lung perfusion decreases more in the early phase (14 seconds after the i.v. injection of iodinated contrast material) of CTPA than the late phase (40 seconds after the i.v. injection of iodinated contrast material). These findings reflect the decreased lung perfusion from the pulmonary arterial blood and relatively increased bronchial arterial flow in patients with PE (13, 16). An important decrease in pulmonary perfusion from pulmonary arteries may also reflect a PVS on CTPA. According to our findings, we suggest that PVS may be caused by decreased pulmonary venous return in the presence of a significantly decreased pulmonary artery blood volume (in the presence of serious PE), which cannot be compensated with bronchial artery.
Although PVS on MRI has not been investigated yet, some authors have described and studied pulmonary venous filling defects on CTPA (15, 16). Souza et al. (15) investigated the contribution of PVS to the diagnosis of PE and they found that the sensitivity, specificity, PPV and NPV of PVS on CTPA in the diagnosis of PE were 36.36%, 98.67%, 94.12%, and 72.55%, respectively. It is not very useful to use PVS as an adjunctive tool for the diagnosis of PE because it is a rare finding in patients with PE suspicion and can also be found in patients without PE. According to the findings of our study, we suggest using PVS on CTPA or MRI as an indicator of poor prognosis rather than using it as an adjunctive tool for the diagnosis. Although the agreement between CTPA and MRI is very good for detecting PVS, CTPA detected more PVS than MRI. As expected, this may be due to the high sensitivity of SSFP sequence to artifacts. Also, the use of larger slice thickness in MRI may have been another affective factor. As in that CTPA study (15), we found very good agreement between the two observers for the detection of PVS on unenhanced MRI.
Zhang et al. (16) found that hypodense filling defect in pulmonary veins on CTPA images (they described it as insufficient contrast medium filling, ICMF) pointed to high risk and poor prognosis in patients who had acute pulmonary embolism. They reported the mean PE index in patients with PVS on CTPA as 63.73 ± 20.27%. They also reported that the mean PE index in patients with PVS was significantly higher than those without PVS (20). Similarly, we also found that in our study, patients with PVS in CTPA had a higher mean PE index than those without PVS. The novel finding of this study is that patients with PVS on unenhanced MRI had higher mean PE index than those without PVS. In a study conducted by Zhang et al. (16) CTPA images were assessed for the presence of PVS on CTPA by consensus of two radiologists and the agreement between the observers was not evaluated and they only investigated patients with PE. The absence of patients without PE in that study was a limitation. Furthermore, they did not specify the criterion of the presence of pulmonary vein sign (for example, the length of the filling defect in centimeters and the number of slices on which the PVS was seen).
It has been shown that PE severity index, RV dilatation and increased RV/LV ratio is correlated with poor clinical outcomes and PE-related mortality. In addition, it has been shown that increased RV/LV ratio is correlated with high PE severity index (14, 21, 22). Similarly, our result showed that RV/LV ratio is significantly correlated with PE index (P = 0.0001, r = 0.519). In addition to all these findings, the novel findings of this study are that (1) PVS on CTPA or MRI is associated with a high PE severity index in the presence or absence of RV/LV ratio > 1, (2) the presence of PVS and RV/LV ratio > 1 on unenhanced MRI at the same time indicates much more severe PE. Therefore, we suggest that PVS should be carefully investigated in CTPA or unenhanced MR images in patients with suspected acute PE.
There are weaknesses and limitations in this study. The small number of cases is the most important limitation and the findings of our study should be evaluated with more comprehensive studies. However, the strong point of this study is that it is the first study that investigated the PVS on both CTPA and unenhanced MRI that may be clinically important and correlate with PE severity. We have not used the respiratory or electrocardiogram (ECG) gating (that would have minimized the motion artifacts and potentially improve the diagnostic performance), which is another limitation of our study. However, in an emergency setting, the use of respiratory or ECG synchronizer and thinner sections would increase the imaging time and it is crucial to keep the imaging time as short as possible to decrease the motion artifacts in patients with poor medical state. The other limitation in our study was that the relationship between prognosis and PE severity index, PVS, RV/LV ratio was not investigated. However, many previous studies have shown that PVS, RV dilatation and high PE intensity index on CTPA are poor prognostic markers (14, 16, 21, 22). In addition, our samples were from one center. Therefore, our results need to be confirmed by studies conducted from other centers. Finally, MR images were obtained only in patients with acute thrombotic PE suspicion and we have used relatively thicker slices (slice thickness; 3 mm). Further MRI studies with thinner slices will be useful for investigating PVS in normal population and chronic thrombotic PE.
In conclusion, presence of pulmonary venous filling defect (synonym with pulmonary vein sign or insufficient contrast medium filling) on CTPA or unenhanced MRI is significantly correlated with PE severity index. Therefore, PVS can be used as a sign of severe PE on CTPA or unenhanced MRI and PVS may also be an indicator of right heart dysfunction.
