


1. Background
Hypoxia is a ubiquitous phenomenon in most malignant tumors, which is the main reason for the tumors refractory and resistance to chemoradiotherapy (1, 2). Noninvasive detection of the extent of hypoxic areas of tumors is essential for delineation of radiotherapy target areas and dose. In the oxygen-enriched area, enough radiation doses could be given to kill malignant tumor cells. Then, oxygen-enriched cells experience an apoptotic die and hypoxic cells get enough oxygen and transform into oxygen-enriched cells, in which, enough doses could be given too. Therefore, monitoring the range and extent of hypoxic area can guide the radiation dose segmentation and the timing of radiotherapy. At present, there are many methods for the detection of tumor hypoxia, but most of them are invasive. Thus, their applications are restricted. Non-invasive detection of hypoxic areas has been improved continuously, and radionuclide hypoxic imaging is currently one of the most concerned detection methods of tumor hypoxia (3), which is beneficial to the diagnosis and treatment of tumor (4).
In 2009, Zha et al. (5) reported a new synthetic hypoxic imaging agent 99Tcm-metronidazole phosphate ester [2-(2-methyl-5-nitro-1H-imidazol-1-yl) phosphate ethyl ester], also namely 99Tcm-MNLS. A preliminary animal study has shown 99Tcm-MNLS has rapid clearance in blood and early tumor imaging. It is mainly excreted through the kidneys.
2. Objectives
The aim of this study was to investigate the feasibility of 99Tcm-MNLS in monitoring the hypoxic status of tumor after radiotherapy and to confirm whether it could accurately reflect the tumor hypoxic status by immunohistochemical staining of hypoxia-inducible factor 1α (HIF-1α) in tumor cells.
3. Materials and Methods
3.1. Quality Control <sup>99</sup>Tc<sup>m</sup>-MNLS
A freshly rinsed 99Tcm liquid adjusted to 7.4 MBq/0.1mL with saline was added into a MNLS lyophilized product (Beijing Xinkesida Pharmaceutical Technology Co., Ltd., China), and then shaken manually and stood at room temperature for 10 minutes. Polyamide as the stationary phase and 10% hydrochloric acid solution as a developing solvent, the radiochemical purity of 99Tcm-MNLS kept at room temperature and 37°C for 30 minutes, 1, 2, 3, 4, 6 and 8 hours was determined.
3.2. Establishment of Tumor-Bearing Mouse Model
Ninety Kunming mice (clean grade, half male and half female), aged 6 - 8 weeks old and weighing 20 - 25 g, were provided by the Experimental Center. 0.1 mL H22 hepatoma cells (provided by the Experiment Center) were subcutaneously inoculated in the right forelimb armpit of each mouse at a concentration of 2 × 10⁸/mL. Then, the mice were fed in a clean environment for eight days. The size of the tumor was measured each day. The largest diameter of the tumor was about 1 cm at the last observing day. The tumor-bearing mice with well-growing, regular shape and almost similar size of tumors were selected for further experiments.
3.3. <sup>99</sup>Tc<sup>m</sup>-MNLS Imaging and Biological Distribution in Tumor-Bearing Mice
Forty-two tumor-bearing mice were equally divided into seven groups according to the imaging time after the injection by random number table: 30 minutes, 1 hour, 2 hours, 3 hours, 4 hours, 6 hours and 8 hours groups. Mice were treated with tail vein injection of 7.4 MBq/0.1 mL 99Tcm-MNLS and received single photon emission computed tomography (SPECT) (Millennium VG Hawkeye, GE Company, the United States) imaging at the corresponding time point of each group. The image acquisition parameters were set as: SPECT equipped with high resolution collimator with low energy, each frame image acquisition was 200 K and the matrix was 256 × 256 with 4 times magnification. The region of interest (ROI), such as the tumor site and the contralateral site, was sketched out on the images obtained from each group to get their respective radiocounting. The ratio of the radiocounting in tumor and non-tumor (T/NT) was calculated. Immediately after the imaging, the eyeballs of each tumor-bearing mouse were taken out for collecting blood and then the mouse was killed by dislocating the neck. Tissues such as tumor, heart, lung, liver, stomach and hind limb muscles were taken out for measuring the radiocounting per minute of each tissue using γ-counting instrument (ZD-6000 well type counting technetium analyzer, Xi’an Zhida Company, China) and the percent of injected dose per gram (% ID/g) of each tissue at each time point was calculated. The standard source of 99Tcm-MNLS was reserved.
3.4. <sup>99</sup>Tc<sup>m</sup>-MNLS Imaging on Tumor-Bearing Mice
Forty-eight successfully established tumor-bearing mice were randomly divided into eight groups according to random number table: imaged at 24 hours before radiotherapy group (A24 h before) and its control (C24 h before), imaged immediately after radiotherapy (Aimmediately) and its control (Cimmediately), imaged at 24 hours after radiotherapy (A24 h) and its control (C24 h) and imaged at 48 h after radiotherapy (A48 h) and its control (C48 h). Radiotherapy was given to the mice in Aimmediately, A24 h and A48 h groups, but not to A24 h before and all the control groups. After radiotherapy, mice in each group were injected with 99Tcm-MNLS at the corresponding time points and imaged at 2 hours after the injection. The ROIs of the tumor region and its counter-lateral region were sketched out on the images obtained from each group to obtain their own radiocounting. Then the radiocounting ratio between tumor and non-tumor (T/NT) was calculated. Two doctors with over 10-year experience delineated the coverage of ROI independently and compared. If the ROIs were mismatched between the two doctors, they would discuss and reach a consensus about the ROI; then one of the doctors re-delineated the ROI according to the consensus.
3.5. Immunohistochemistry (IHC)
Immediately after the imaging, mice were sacrificed by dislocating the neck. The tumor tissues were isolated and made into paraffin sections. The expression of HIF-1α was determined by IHC using HIF-1α primary antibody and streptavidin-peroxidase ligation kit (BIOWORLD Co., USA). The cytoplasm of tumor cells stained brown-yellow was positive for HIF-1α. The percentage of positive cells in each field of vision was regarded as the HIF-1α expression in this field of vision. Five non-overlapping fields of vision at 400 × magnification were selected on each slice from top to bottom and from left to right to calculate the average percentage of HIF-1α positive cells, which was taken as the expression of HIF-1α in this slice. Every field was counted twice, and the average percentage of HIF-1α positive cells was taken as the expression of HIF-1α in this field.
3.6. Statistical Analysis
Data were expressed as mean ± standard deviation (SD) and analyzed using statistical software SPSS version 17.0. The normality of data were assessed before analysis. If the data were normality, comparisons of measurement data were carried out using one-way ANOVA, pairwise comparison least significant difference (LSD) -t test, two independent sample t-test and non-parametric Spearman analysis. If not, the Rank sum test was used. The difference was statistically significant if P < 0.05 was considered.
4. Results
4.1. Quality Control of <sup>99</sup>Tc<sup>m</sup>-MNLS and Tumor-Bearing Mice
The labeled 99Tcm-MNLS was a colorless and transparent solution. Its radiochemical purity at room temperature for 10 minutes was 97%. Moreover, it could be stable for at least 8 hours after it was labeled. Its radiochemical purities were all greater than 90% at room temperature and 37°C for 30 minutes, 1, 2, 3, 4, 6 and 8 hours (5). There was no significant difference in the weight and diameter of tumors among the groups (F = 4.539, t = 1.980, P > 0.05).
4.2. <sup>99</sup>Tc<sup>m</sup>-MNLS Imaging and Its Biological Distribution in Tumor-Bearing Mice
All tumor-bearing mice developed clear tumor images at the right forelimb armpit. The retention of imaging agents in tumors (T) and non-tumorous tissues (NT) was highest at 1 hour, and excreted with time, which was more significant in non-tumorous tissues, T/NT ratio was the highest and the imaging was the best at 2 hours after the injection of 99Tcm-MNLS.
99Tcm-MNLS could be absorbed quickly by tumor (0.243 ± 0.026 % ID/g at 30 minutes). The percentages of injected dose per gram tumor (% ID/g) at different time points were compared with that at 2 hours (Table 1). 99Tcm-MNLS was mainly excreted via the kidneys. The ratio of % ID/g in tumor and muscle (T/M) was increased significantly over time within 2 hours, and reached 5.368 ± 2.624 %ID/g at 2 hours, then it began to decrease gradually over time from 3 hours.
| Tissues | 30 min | 1 h | 2 h | 3 h | 4 h | 6 h | 8 h |
|---|---|---|---|---|---|---|---|
| Brain | 0.004 ± 0.001 | 0.003 ± 0.001 | 0.002 ± 0.001 | 0.002 ± 0.001 | 0.004 ± 0.001 | 0.018 ± 0.003 | 0.036 ± 0.001 |
| Heart | 0.037 ± 0.051 | 0.026 ± 0.009 | 0.016 ± 0.003 | 0.014 ± 0.002 | 0.019 ± 0.006 | 0.018 ± 0.013 | 0.009 ± 0.001 |
| Liver | 0.503 ± 0.191 | 0.491 ± 0.051 | 0.336 ± 0.151 | 0.289 ± 0.150 | 0.168 ± 0.138 | 0.115 ± 0.053 | 0.038 ± 0.009 |
| Spleen | 0.072 ± 0.051 | 0.044 ± 0.011 | 0.079 ± 0.021 | 0.083 ± 0.018 | 0.025 ± 0.009 | 0.115 ± 0.064 | 0.033 ± 0.167 |
| Lung | 0.072 ± 0.152 | 0.070 ± 0.016 | 0.043 ± 0.008 | 0.056 ± 0.005 | 0.062 ± 0.020 | 0.085 ± 0.010 | 0.029 ± 0.015 |
| Kidney | 3.562 ± 0.410 | 5.929 ± 1.028 | 6.071 ± 0.765 | 2.938 ± 0.931 | 2.104 ± 0.651 | 2.885 ± 0.959 | 0.350 ± 0.074 |
| Stomach | 0.037 ± 0.003 | 0.029 ± 0.009 | 0.073 ± 0.022 | 0.089 ± 0.050 | 0.093 ± 0.019 | 0.053 ± 0.027 | 0.034 ± 0.007 |
| Intestines | 0.059 ± 0.136 | 0.120 ± 0.034 | 0.094 ± 0.029 | 0.085 ± 0.173 | 0.039 ± 0.009 | 0.026 ± 0.022 | 0.020 ± 0.014 |
| Blood | 0.629 ± 0.020 | 0.504 ± 0.146 | 0.286 ± 0.051 | 0.081 ± 0.009 | 0.070 ± 0.013 | 0.052 ± 0.093 | 0.018 ± 0.014 |
| Muscle | 0.091 ± 0.008 | 0.084 ± 0.007 | 0.067 ± 0.002 | 0.052 ± 0.001 | 0.036 ± 0.002 | 0.029 ± 0.006 | 0.020 ± 0.001 |
| Tumor | 0.243 ± 0.026* | 0.365 ± 0.144* | 0.359 ± 0.033 | 0.279 ± 0.060* | 0.178 ± 0.075* | 0.125 ± 0.035* | 0.043 ± 0.012* |
| Bone | 0.278 ± 0.099 | 0.051 ± 0.009 | 0.062 ± 0.014 | 0.081 ± 0.014 | 0.082 ± 0.005 | 0.050 ± 0.004 | 0.033 ± 0.002 |
In Vivo Biological Distribution of 99Tcm-MNLS in Tumor-Bearing Mice (% ID/g, N = 6)a
4.3. <sup>99</sup>Tc<sup>m</sup>-MNLS Imaging
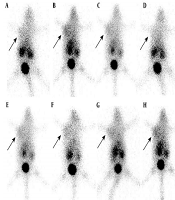
The 99Tcm-MNLS imaging of tumor-bearing mice after radiotherapy showed that the T/NT ratio changed with a trend of Aimmediately > A24 h > A48 h (F = 16.031, t = 5.640 and 7.674, P < 0.05). No statistical significance was found in the T/NT ratio between A24 h before and A24 h or its control group (t = 1.967 or t = 0.635, P > 0.05), but it changed following the trend of Aimmediately > A24 h before > A48 h (F = 15.481, t = 6.732 and 7.589, P < 0.05) (Figure 1). The T/NT ratio in Aimmediately group was significantly higher than that in its control group Cimmediately (3.38 ± 0.23 vs. 2.78 ± 0.29, t = 4.125) (P < 0.01), but there was no significant difference in T/NT ratio between A24 h and C24 h (2.78 ± 0.37 vs. 2.98 ± 0.16, t = 0.546, P > 0.05), while that in A48 h group was lower than that in C48 h group (2.22 ± 0.43 vs. 3.17 ± 0.76, t = 7.893, P < 0.05, Table 2).
| 99Tcm-MNLS hypoxic imaging | Hypoxia inducible factor-1α | |||||
|---|---|---|---|---|---|---|
| Radiotherapy group | Control group | P value | Radiotherapy group, % | Control group, % | P value | |
| 24 h before | 2.17 ± 0.19 | 2.68 ± 0.12 | > 0.05 | 45.43 ± 2.35 | 40.52 ± 3.24 | > 0.05 |
| Immediately | 3.38 ± 0.23 | 2.78 ± 0.29 | < 0.05 | 87.52 ± 0.84 | 48.26 ± 1.70 | < 0.05 |
| 24 h | 2.78 ± 0.37 | 2.98 ± 0.16 | > 0.05 | 49.12 ± 3.78 | 62.38 ± 0.89 | > 0.05 |
| 48 h | 2.22 ± 0.43 | 3.17 ± 0.76 | < 0.05 | 21.58 ± 0.89 | 74.57 ± 2.98 | < 0.05 |
T/NT of 99Tcm-MNLS Hypoxic Imaging and Expression of Hypoxia Inducible Factor-1α in Different Subgroupsa
![<sup>99</sup>Tc<sup>m</sup>-2-(2-methyl-5-nitro-1H-imidazol-1-yl) ethyl dihydrogen phosphate (<sup>99</sup>Tc<sup>m</sup>-MNLS) imaging in each group. A - D, Radiotherapy groups [A<sub>immediately</sub> (A), A<sub>24 h before</sub> (B), A<sub>24 h</sub> (C), and A<sub>48 h</sub> (D)]; E - H, Control groups [C<sub>immediately</sub> (E), C<sub>24 h before</sub> (F), C<sub>24 h</sub> (G), and C<sub>48 h</sub> (H)]. Arrow shows the tumor location.](https://services.brieflands.com/cdn/serve/314b7/d7868de74755dcb29c8a0f5591825adc15fe770d/iranjradiol-16-4-86127-i001-preview.png "<sup>99</sup>Tc<sup>m</sup>-2-(2-methyl-5-nitro-1H-imidazol-1-yl) ethyl dihydrogen phosphate (<sup>99</sup>Tc<sup>m</sup>-MNLS) imaging in each group. A - D, Radiotherapy groups [A<sub>immediately</sub> (A), A<sub>24 h before</sub> (B), A<sub>24 h</sub> (C), and A<sub>48 h</sub> (D)]; E - H, Control groups [C<sub>immediately</sub> (E), C<sub>24 h before</sub> (F), C<sub>24 h</sub> (G), and C<sub>48 h</sub> (H)]. Arrow shows the tumor location.")
99Tcm-2-(2-methyl-5-nitro-1H-imidazol-1-yl) ethyl dihydrogen phosphate (99Tcm-MNLS) imaging in each group. A - D, Radiotherapy groups [Aimmediately (A), A24 h before (B), A24 h (C), and A48 h (D)]; E - H, Control groups [Cimmediately (E), C24 h before (F), C24 h (G), and C48 h (H)]. Arrow shows the tumor location.
4.4. Expression of HIF-1α
The expression of HIF-1α in A24 h before, Aimmediately, A24 h and A48 h groups was 45.43 ± 2.35%, 87.52 ± 0.84%, 49.12 ± 3.78%, and 21.58 ± 0.89%, respectively; while in the C24 h before, Cimmediately, C24 h and C48 h groups, it was 40.52 ± 3.24%, 48.26 ± 1.70%, 62.38 ± 0.89%, and 74.57 ± 2.98%, respectively (Table 2 and Figure 2). The comparisons of the expression of HIF-1α among the groups after radiotherapy displayed that Aimmediately > A24 h > A48 h (F = 28.056, t = 6.701 and 4.911, P < 0.05). No statistical significance in the expression of HIF-1α was found between A24 h before and A24 h or its control group (t = 0.935 or t = 2.513, P > 0.05), but its changes showed a trend of Aimmediately > A24 h before > A48 h (F = 29.189, t =6.693, 4.877, P < 0.05). The expression of HIF-1α in Aimmediately was remarkably higher than that of Cimmediately (t = 3.563, P < 0.05), but there was no significant difference in the expression of HIF-1α between A24 h and C24 h (t = 2.125, P > 0.05), while that in A48 h group was markedly lower than that in C48 h group (t = 3.279, P < 0.05) (Table 2).
![The expression of hypoxia inducible factor-1α (HIF-1α) in each group determined by immunohistochemistry (IHC) (SP method, 400×). A - D, Radiotherapy groups [A<sub>immediately</sub> (A), A<sub>24 h before</sub> (B), A<sub>24 h</sub> (C) and A<sub>48 h</sub> (D)]; E - H, Control groups [C<sub>immediately</sub> (E), C<sub>24 h</sub><sub>before</sub> (F), C<sub>24 h</sub> (G) and C<sub>48 h</sub> (H)].](https://services.brieflands.com/cdn/serve/314b7/82cdc4c640bed9d4e8249fa59a03d3772eef93c4/iranjradiol-16-4-86127-g001-preview.png "The expression of hypoxia inducible factor-1α (HIF-1α) in each group determined by immunohistochemistry (IHC) (SP method, 400×). A - D, Radiotherapy groups [A<sub>immediately</sub> (A), A<sub>24 h before</sub> (B), A<sub>24 h</sub> (C) and A<sub>48 h</sub> (D)]; E - H, Control groups [C<sub>immediately</sub> (E), C<sub>24 h</sub><sub>before</sub> (F), C<sub>24 h</sub> (G) and C<sub>48 h</sub> (H)].")
The expression of hypoxia inducible factor-1α (HIF-1α) in each group determined by immunohistochemistry (IHC) (SP method, 400×). A - D, Radiotherapy groups [Aimmediately (A), A24 h before (B), A24 h (C) and A48 h (D)]; E - H, Control groups [Cimmediately (E), C24 hbefore (F), C24 h (G) and C48 h (H)].
4.5. Correlation Between <sup>99</sup>Tc<sup>m</sup>-MNLS Hypoxia Imaging and the Expression of HIF-1α
There was a positive correlation between T/NT ratio and the expression of HIF-1α in the radiotherapy groups (Rs = 0.793, P < 0.05). The correlation was also found in the control groups (Rs = 0.756, P < 0.05).
5. Discussion
99Tcm-MNLS is a positive hypoxic imaging agent. Its imaging mechanism, similar to other nitroimidazole hypoxic imaging agents (6, 7), is associated with its high permeability and high redox potential. High permeability is conducive to its rapid access to mitochondria within the cell, while high redox potential is to promote its redox reaction. Thus, it is an ideal positive hypoxic imaging agent.
In this study, the distribution of 99Tcm-MNLS in tumor-bearing mice showed that the uptake of 99Tcm-MNLS by the tumor was higher at early stage. Its distribution was mainly in the blood, liver and kidney but less in the brain, spleen, stomach and intestine. With extension of time, radioactivity was gradually increased in the tumor, while that in other organs (except kidneys and bladder) and tissues was gradually decreased. The T/NT ratio was increased gradually with time and reached the highest level at 2 hours. The reason may be that 99Tcm-MNLS is continuously diffused from the blood to the hypoxic area and absorbed by the hypoxic cells, and the background in blood is gradually cleared with time. In contrast, the low T/NT ratio in the tumor, kidney and bladder may result from the excretion 99Tcm-MNLS mainly by the kidneys and bladder.
99Tcm-MNLS hypoxia imaging showed that the tumor site could be visualized as early as within 30 minutes, and clearly at 2 hours with low background and high T/NT ratio. Then, the imaging of the tumor site and background were both reduced with time, so was the T/NT ratio. No obvious imaging was found in the abdomen of tumor-bearing mice except the kidneys, suggesting that 99Tcm-MNLS can display tumor lesions well and may have greater advantages on displaying the abdominal neoplasms than other hypoxia imaging agents (such as 99Tcm--HL91, which displays enriched radioactivity in all the abdomen). However, it needs more studies to confirm.
After single high-dose radiotherapy, apoptosis occurs in most of the oxygen-rich tumor cells, but the functional blood vessels of the tumor were less affected. Cells in part of the hypoxic tissue were relieved from the hypoxic state and transferred into oxygen-rich cells. Such process is called re-oxygenation of the hypoxic tumor cells. Researches (8) have reported hypoxic fraction of radiation-sensitive solid tumors is close to 100% immediately after radiotherapy due to the rapid reduction of oxygen-rich cells, and then it is gradually decreased to the initial value after a period of time. In this study, the T/NT ratio at 24 hours before radiotherapy was significantly lower than that immediately after radiotherapy because the killing of oxygen-rich cells is an oxygen consumption process, which increases the degree of tumor hypoxia, and the death of oxygen-rich cells leads to the relative increase of the proportion of hypoxic cells. The changes of T/NT ratio in the radiotherapy groups showing a trend of increasing first and then decreasing gradually were the re-oxygenation process of the hypoxic cells in the tumor.
Different types of tumors have different sensitivity to radiotherapy. For instance, lymphomas and seminoma are sensitive to radiotherapy with significant effect, while melanoma and glioma are not sensitive to radiotherapy with poor curative effect. Nevertheless, most of the remaining malignant solid tumors have moderate sensitivity to radiotherapy and easily relapse and metastasize (9). Hypoxic cells in the tumors mainly contribute to this phenomenon because the percentage of hypoxic cells determines the sensitivity of the tumor to radiotherapy. The ionizing radiation of radiotherapy induces DNA to generate free radicals, combining with oxygen to form peroxides, which cause strand break of DNA and lipid peroxidation of the cell membrane, thereby leading to tumor cell death (10). Low oxygen content in hypoxic cells leads to insufficient combination with free radicals generated after radiotherapy to cause tumor cells death, thus, the dose of radiotherapy should be improved. Studies have shown that if the tumors are all hypoxic cells, the radiation dose should be three times of aerobic cells to kill most of the cells (> 90%), but a simple increase of the radiation dose will inevitably increase the chance of damaging the surrounding normal tissues (11). Therefore, assessing the proportion of hypoxic to oxygen-rich cells in the tumor is of great significance for determining the appropriate timing of radiotherapy. Adjusted fractionated irradiation should be considered basing on the extent of tumor re-oxygenation. The re-oxygenation time of hypoxic tumor cells provides a basis for clinicians to make a decision of re-radiation (12). In this experiment, the degree of hypoxia in the tumor site of 48 hours group was lower than that of Aimmediately and A24 h groups, indicating that re-oxygenation occurred in the hypoxic cells of the tumor. Regarding this, one more radiotherapy for the tumor site at this time can achieve better results than at 24 hours after the first radiotherapy.
HIF-1α is an important transcription factor in tissues that responds to the hypoxia microenvironment. HIF-1α can let tumor cells adapt to hypoxia microenvironment formed due to the rapid proliferation by regulating various biological processes including glycolysis, angiogenesis factor, vascular endothelial growth factor (VEGF) and 3-(5’-hydroxymethyl-2’-furyl)-1-benzylindazole (YC-1) (13-17). Its content can also predict the efficacy of radiotherapy on tumor (18, 19). HIF-1α has an oxygen-dependent degradation region in the polypeptide region and is strongly dependent on oxygen. HIF-1α is easily degraded in oxygen-rich condition, so it is almost undetectable in normal cells. But the hypoxia condition increases the protein stability of HIF-1α, resulting in the block of HIF-1α degradation and its continuous accumulation in tumor hypoxic cells. Re-oxygenation of hypoxic cells can effectively inhibit HIF-1α production, thus the amount of HIF-1α can also reflect the re-oxygenation state of hypoxia within tumor (20, 21). In conclusion, our results showed that most of the hypoxic tissues in tumor had different levels of HIF-1α expression, and its expression was significantly different with the different treatments; HIF-1α expression had good correlation with tumor hypoxia imaging. Our findings strongly proved that 99Tcm-MNLS tumor hypoxic imaging is likely to accurately predict the changes of the hypoxic state of the tumor.
As the main point of the study findings, we can say that 99Tcm-MNLS tumor hypoxic imaging can truly and accurately reflect the changes of tumor hypoxia.
99Tcm-MNLS tumor hypoxic imaging suitable for detecting the tumor hypoxia and monitoring the changes of tumor hypoxic state after radiotherapy.
99Tcm-MNLS tumor hypoxic imaging expected to become a non-invasive method for the detection of the extent and scope of tumor hypoxia, and to provide a strong basis for the determination of tumor fractionated radiation time.
