1. Background
Stroke has important impacts on human health, with high rates of incidence, disability, mortality, and complications. Acute ischemic stroke accounts for about 60% - 80% of total cerebral stroke. Cerebellar infarction most frequently occurs within the age range of 50 - 80 years, more so in males than in females (1), but the reported incidence rates of cerebellar infarction vary considerably. Edlow et al. (2) reported that cerebellar infarction accounts for about 3% of all cerebral infarctions in clinical practice, while Bogousslavsky et al. (3) analyzed 1000 patients with a first cerebrovascular accident and found that cerebellar infarction accounted for 1.9% of the cases. Therefore, it is prudent to study cerebellar infarction.
When oxygen separates from oxyhemoglobin, the deoxyhemoglobin formed has four unpaired electrons that are paramagnetic (4). The spin frequency of the proton has an influence: if a sufficiently long echo time (TE) (the TE value is usually 15 - 20 milliseconds or slightly longer) is applied, significant phase differences will occur between the protons with different spin frequencies, and this difference could be quantitatively calculated using the weighted magnetic susceptibility imaging phase value (5).The amount of deoxyhemoglobin in the blood could be calculated by measuring the phase values of the different veins (6), and the change in the oxygen content of the venous blood could also be calculated (7, 8). Nevertheless, there is limited literature focusing on the alterations of drainage veins in cerebellar infarction.
2. Objectives
In this study, we presented the phase values of the drainage veins, cerebral blood flow (CBF), and apparent diffusion coefficient (ADC) values from brain MRI scans obtained in both patients with cerebellar infarct and healthy controls. We aimed to evaluate the effects in the phase value (Δφ) of drainage veins in cerebellar infarction, and to assess the potential of adding the draining vein measurement into clinical care of acute cerebellar infarction.
3. Patients and Methods
3.1. Study Population
This retrospective study was approved by the Institutional Review Board of the Medical Imaging Research Institute of Shandong University. The data were from 18 cases of cerebellar infarction and 30 cases of normal brain tissue, and were collected from the Shandong Medical Imaging Research Institute between 1st April and 31st December in 2017. Eleven patients underwent dynamic contrast-enhanced magnetic resonance imaging (DCE-MRI), and written informed consent was obtained from each participant before applying their images. The 30 normal volunteers included 17 males and 13 females with an average age of 55 years. The 18 cerebellar infarction patients consisted of 11 males and seven females, with an average age of 61 years (Table 1). All patients had ischemic infarction. Patients were excluded from the study if they had a history of brain tumor, hemorrhage, metabolic diseases, or any type of congestive heart failure. To be included in the study, patients were required to have a cerebellum area without malformations, not consume coffee 2 hours before scans, not take aspirin or other anti-coagulants, anti-platelet drugs or stimulants and alcohol, be non-smokers, and not engage in strenuous exercise. Moreover, patients with a history of computed tomography enhancement and other interventional therapy, or cerebellar infarction occurring more than 72 hours prior were excluded. Additionally, in patients with cerebellar infarction, to meet the requirements for the scope of the region of interest (ROI) area measurements, the infarction focal length to diameter was required to exceed 0.5 cm.
3.2. Imaging Techniques
All patients underwent craniocerebral scans with a Siemens 3.0T superconducting large-aperture magnetic resonance imaging system (Magnetom, Skyra; Siemens Healthcare, Erlangen, Germany), with a quadrature 16-channel NV head-and-neck coil to scan from the base of the skull to the top. The head was placed in a supine position throughout the entire scanning process, and the scanning position of each sequence image was identical. The parameters of the axial T2 weighted image turbo spin echo (T2WI TSE) and turbo spin echo T1-weighted image turbo spin echo (T1WI TSE) sequence were as follows: field of view (FOV) = 230 × 230 mm2, matrix = 512 × 420, section thickness = 5 mm, gap = 50%, 20 sections. The T2WI TSE sequence was repetition time (TR)/echo time (TE) = 4500/109 ms. The T1WI TSE sequence was TR/TE = 2000/13 ms. DCE-MRI included: T1 volumetric interpolated breath-hold examination (VIBE) sequence, TR 5.08 ms, TE1.74 ms, flip angle was 15º, excitation times = 8, FOV = 230 × 230 mm, matrix = 512 × 420, section thickness = 5 mm. Contrast agent was injected through high-pressure syringe with a dose of 0.1 mmol/kg, and the injection rate of the conventional group was 3 ml/s. Contrast agent was gadolinium diethylenetriamine pentaacetic acid (Gd-DTPA) (gadoppentetate dimeglumine, Magnevist). Axial, coronal and sagittal scanning were performed. The number of collections was 75. For diffusion-weighted imaging (DWI), we used the Siemens instrument with high-definition diffusion sequences based on RESOLVE technology, with the following conditions: three diffusion directions, two weighted images (b values = 0 and 1000), FOV = 230 × 230 mm2, section thickness = 5 mm, TR = 3700 ms, TE1 = 65 ms, TE2 = 104 ms, repeat collection number = 1, gap = 20%, flip angle = 180º, applied pressure pulse, voxel size = 1.4 × 1.4 × 5 mm3, accelerating factor = 2, bandwidth = 919 Hz/Px, and echo clearance = 0.36 s. For susceptibility weighted imaging (SWI), we used high-resolution three-dimensional perturbation gradient echo sequences to collect the original data containing two types of images: phase diagrams and amplitude diagrams. The conditions were as follows: FOV = 230 × 230 mm2, section thickness = 1.2 mm, total = 80 sections, TR = 28 ms, TE = 20 ms, repeated collection number = 1, layer spacing = 20%, flip angle = 15º, voxel size = 0.6 × 0.6 × 1.2 mm3, accelerating factor = 2, bandwidth = 120 Hz/Px, and pulse with flow compensation. We used a pulsed arterial spin labeling (ASL) sequence with flow-sensitive alternating inversion recovery labeling and quantitative imaging of perfusion (9). The following parameters were used for the sequence: T1 of arterial blood = 1648 ms, T1 of brain tissue = 1329 ms, bolus time length = 700 ms, TR/TE = 4600/22.2 ms, FOV = 222 × 222 mm2, integrated parallel acquisition technique (iPAT) mode of generalized auto-calibrating partially parallel acquisition phase encoding = 2, section thickness = 4 mm, voxel size = 1.7 × 1.7 × 4.0 mm3, 20 sections, turbo factor = 12, echo-planar imaging factor = 30, number of segments = 2, bandwidth = 2244 Hz/pixel, and total acquisition time = 5 min 10 s.
3.3. Image Analysis
All patient images were measured by two skilled neuroradiologists without prior knowledge of the outcome. If the measurement results were inconsistent, they were discussed until agreement was reached. As described by Katorza et al. (10), cerebellum partitions were made at the cranio-cerebral midline sagittal level, and a line was drawn between the top of the fourth ventricle and the posterior division of the cerebellum. Then, the vermis was divided into the upper vermis and lower vermis, and we examined the oblique coronal position. This line was located at the boundary (the axial position was approximately the widest anterior and posterior diameter of the fourth ventricle), and the ipsilateral cerebellar hemisphere was divided into upper and lower parts. According to these results combined with the imaging findings of the cerebellar fissure, the cerebellar hemisphere was divided into two parts: one in front of the cerebellar primary fissure, called the anterior cerebellar hemisphere region, and one in the rear, which was the posterior cerebellar hemisphere region. Therefore, one cerebellar hemisphere was divided into the following four regions: the anterior superior region, the posterior superior region, the anterior inferior region, and the posterior inferior region. The drainage veins of each region in one cerebellar hemisphere are referred to as the anterior superior cerebellar vein (ASCV), the posterior superior cerebellar vein (PSCV), anterior inferior cerebellar vein (AICV), and the posterior inferior cerebellar vein (PICV).
SWI raw data were in Digital Imaging and Communications in Medicine (DICOM) format; the SWI sequences contained the phase figure, magnitude figure, and minimum intensity projection (MinIP) figure, and the applied signal processing was by SPIN (Signal Processing in neuro-MR, Copyright 2015, MR Innovations Inc, Detroit MI, USA) (11). Intracerebral venous blood phase measurements were performed on the phase figure, and venous blood phase values were represented by Δφ (in units of spin). We avoided the adjacent non-target vessels, skull, airtight sinus cavity, and other areas with clear differences in magnetic sensitivity during measurement. The measuring line was placed in the middle of the vein being measured and perpendicular to it, each vein traveled along the vessels and was measured three to five times continuously, both distally and proximally, and the mean of the measured values was recorded as the final measurement.
For the ASL and DWI data, we used NordicICE (Version 4.1.2; NordicNeuroLab, Bergen, Norway) (12, 13) to quantitatively measure the value of the cerebral blood flow (CBF) region with CBF graphing in ASL sequences. The ROI was used to measure regional cerebral blood flow (rCBF) in the same area, which was approximately 30 - 50 mm2. All values of rCBF were collected in the area of interest, and the mean value was recorded (in ml/(min·100 g)). The scanning position applied fusion technology with T1WI and T2WI. ROI was used to measure the values of regional apparent diffusion coefficients (rADC) in the same area, and the values were approximately 30 - 50 mm2. All rADC values were collected in the area of interest, and the mean value was analyzed (in 10-3 mm2/s).
The infarct patient group consisted of 18 patients with cerebellar infarction (17 patients with 26 infarcted areas, and one patient with a whole cerebellar hemisphere infarction of four infarcted areas) under the same treatment conditions, and their developmental status was tracked according to pathological changes. All cases were divided into the following two phases: phase I, the acute or subacute stage (before treatment), and phase II, the phase after the treatment period (six months after treatment). In phase II, the infarcted area appeared as a necrotic and liquefied area and an area free of necrosis and liquefication called the recovered area. Phase I data were recorded and analyzed against the background of the final presentation of the phase II lesions. For the local infarction of the cerebellar hemisphere, the mismatched area between the ASL and DWI was used to define the ischemic penumbra (14) and the phase values of the draining veins and the CBF values in the infarcted area and the recovered area of the ischemic penumbra were recorded. For patients with a whole cerebellar hemisphere infarction, given that the low signal area on DWI as the ischemic penumbra (there was the mismatched area between ASL and DWI), the measured values of the infarcted and recovered areas were included in the corresponding area, and a receiver operating characteristic (ROC) curve was used to calculate the boundary value for cells close to the infarct.
3.4. Statistical Analysis
IBM SPSS (Version 23.0; Statistical Package for the Social Sciences, Chicago, IL, USA) was used for all statistical analyses. After the normal distribution of the data was verified with the Shapiro-Wilk test, the data were analyzed with independent samples t-test to detect the cerebellum hemisphere district bilateral drainage venous phase value Δφ, cerebellar infarction area, side mirror (side) drainage vein phase value Δφ, rCBF value, and rADC value. Correlation analysis was performed with Pearson’s correlation test. A P < 0.05 was considered statistically significant.
4. Results
4.1. Imaging Findings
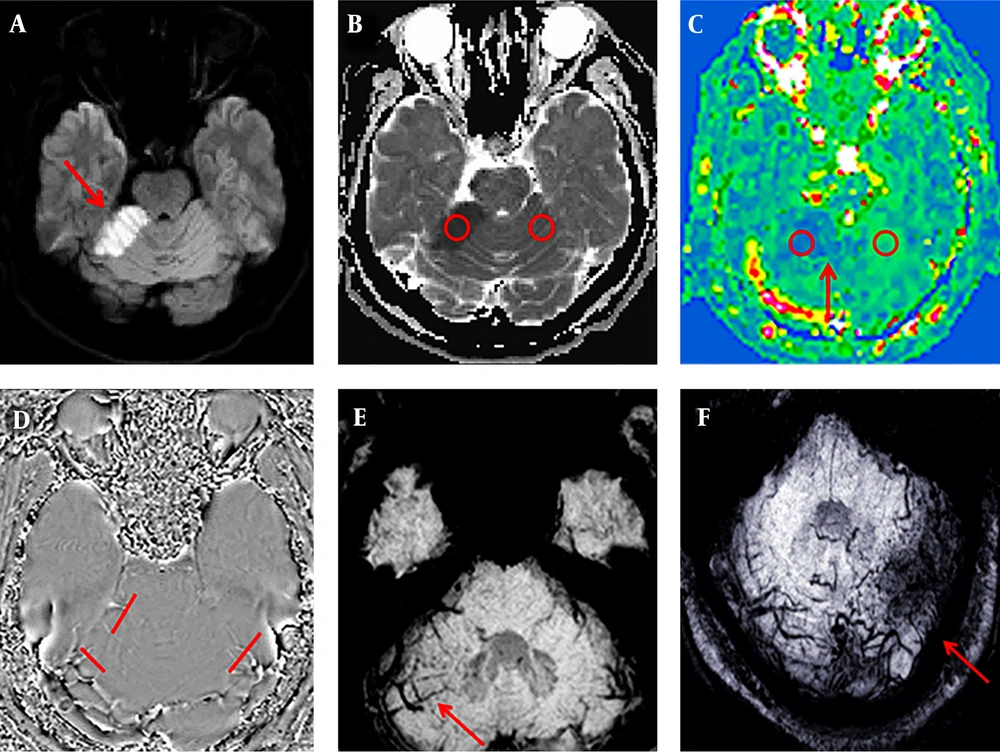
Among the 18 patients with cerebellar infarction, 17 showed a low signal on T1WI, a high signal on T2WI, a high signal on DWI (b = 1000 s/mm2), a low signal on ADC, and decreased blood flow in the infarct area on ASL. All patients except one (17/18, 94%) showed increasing enlargement and phase values in the venous drainage site of the infarction area on SWI (Figure 1). However, in one case, the whole cerebellar hemisphere was infarcted, no obvious high signal on DWI was observed, the ADC image presented an overall high signal. The CBF image showed a slight decrease in signal, with fewer drainage veins being found in the infarct area than in the contralateral area, and the phase value of the drainage veins being lower than on the healthy side.
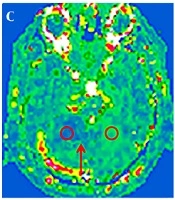
A 53-year-old man presented with dizziness and unstable gait for five hours. Sequence images of the same patient whose right anterior superior cerebellar hemisphere was infarcted (A-E). A, Diffusion-weighted imaging (DWI) of the right anterior superior cerebellar hemisphere area showed a clearly high signal (red arrow). B, Measurements of the infarcted area and the contralateral apparent diffusion coefficient (ADC) values. C, Measurements of the infarction area and the contralateral regional cerebral blood flow (CBF) value; the red arrow indicates the ischemic penumbra. D, Phase values of the infarction area and the contralateral venous drainage Δφ measurement. E-F, Susceptibility weighted imaging (SWI) minimum intensity projection (MinIP) figure; the red arrow indicates that the drainage veins were significantly more numerous and thicker in the infarcted area than on the contralateral region. F, An image of another patient with a left posterior upper cerebellar hemisphere infarction. The patient was 50 years old and she had balance disorder and ataxia for two days.
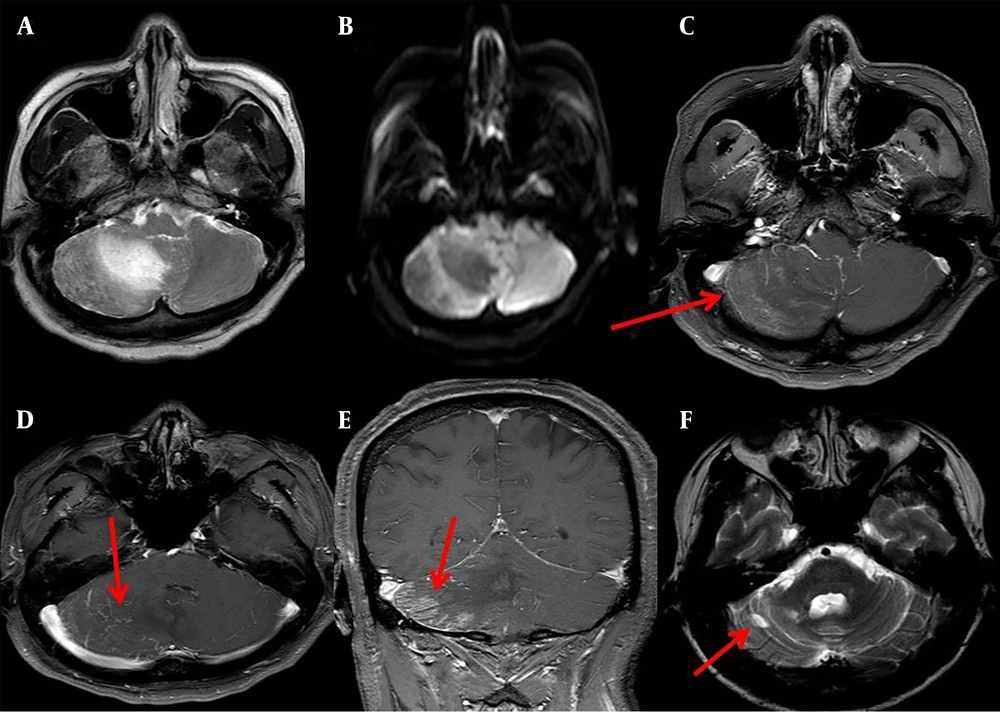
A patient with cerebellar infarction in the right inferior cerebellar hemisphere, a low signal on T1WI, a high signal on T2WI, a few patchy high signal on DWI, dynamic enhancement magnetic resonance imaging showed a patchy high signal in the infarct area, and multiple high-signal veins continued with venous sinus, and only a focal-like liquefied area was observed in the infarction area after six months of treatment (Figure 2).
A 57-year-old man who presented with dizziness and unstable gait for one day. A, A slightly longer T2 signal is visible in the right inferior cerebellar hemisphere on T2-weighted imaging (T2WI). B, Diffusion-weighted imaging (DWI) (b = 1000 s/mm2); a few slight higher signals were present in the right inferior cerebellar hemisphere. C-D, Axial imaging at venous stage in dynamic enhancement of MRI. C, A patchy of enhanced high-signal were observed in infarct area (red arrow). D, Multiple enhanced venous vessels connected to the venous sinus were observed (red arrow). E, Coronary imaging at venous stage in dynamic enhancement of MRI, a patchy of enhanced high-signal were observed in infarct area (red arrow). F, A focal-like liquefied area was observed in the infarction area on T2WI of the same patient after six months of treatment (red arrow).
4.2. Comparison of Mean Phase Values of Drainage Veins in the Cerebellar Hemispheres of 30 Healthy Volunteers
Significant differences were observed between the right and left posterior superior veins (P = 0.036). The phasing values of the other groups were not significantly different (P > 0.05) (Table 2).
| Items | Numbers | Left | Right | t | P value |
|---|---|---|---|---|---|
| ASCV | 30 | 213.23 ± 93.24 | 212.93 ± 82.98 | -0.020 | 0.984 |
| PSCV | 30 | 204.83 ± 73.22 | 232.33 ± 95.24 | 2.195 | 0.036 |
| AICV | 30 | 268.03 ± 124.66 | 251.07 ± 110.35 | -0.817 | 0.421 |
| PICV | 30 | 233.33 ± 84.22 | 246.70 ± 110.48 | 1.030 | 0.312 |
Abbreviations: AICV, anterior inferior cerebellar vein; ASCV, anterior superior cerebellar vein; PICV, posterior inferior cerebellar vein; PSCV, posterior superior cerebellar vein; SD, standard deviation
aValues are expressed as mean ± SD.
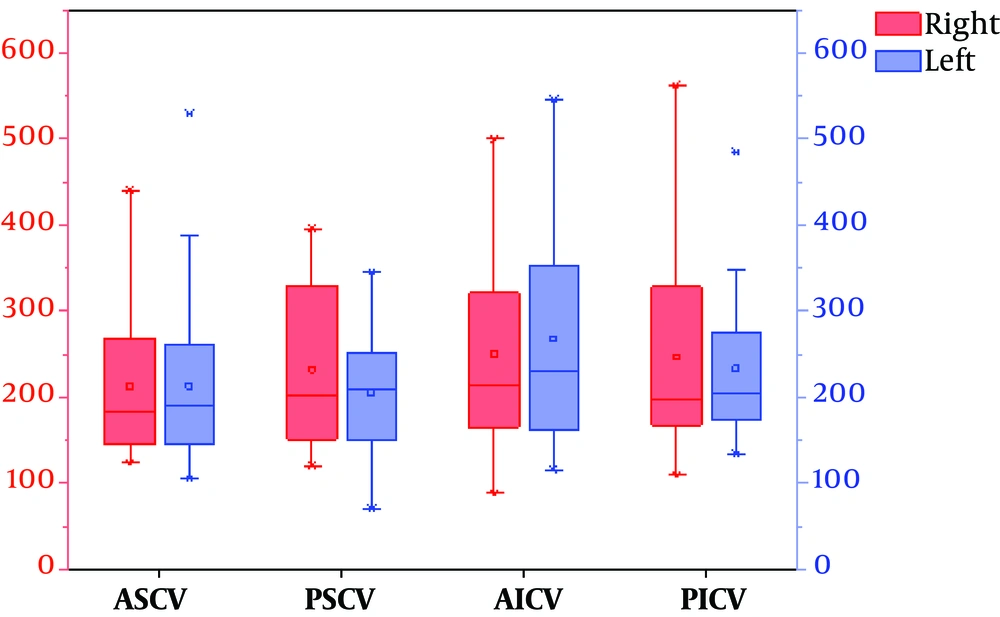
To display the data in the Table 2 more intuitively, we also used a van diagram (Figure 3).
The van chart of mean phase values of the venous drainage in both cerebellar hemispheres (Abbreviations: RASCV, LASCV: the right and left anterior superior cerebellar vein; RPSCV, LPSCV: the right and left posterior superior cerebellar vein; RAICV, LAICV: the right and left anterior inferior cerebellar vein; RPICV, LPICV: the right and left posterior inferior cerebellar vein).
4.3. Comparison of Mean Phase Values of Drainage Veins on the Healthy Side and Infarction Area of Cerebellar Infarction Patients with Normal Healthy Group (Mean ± SD)
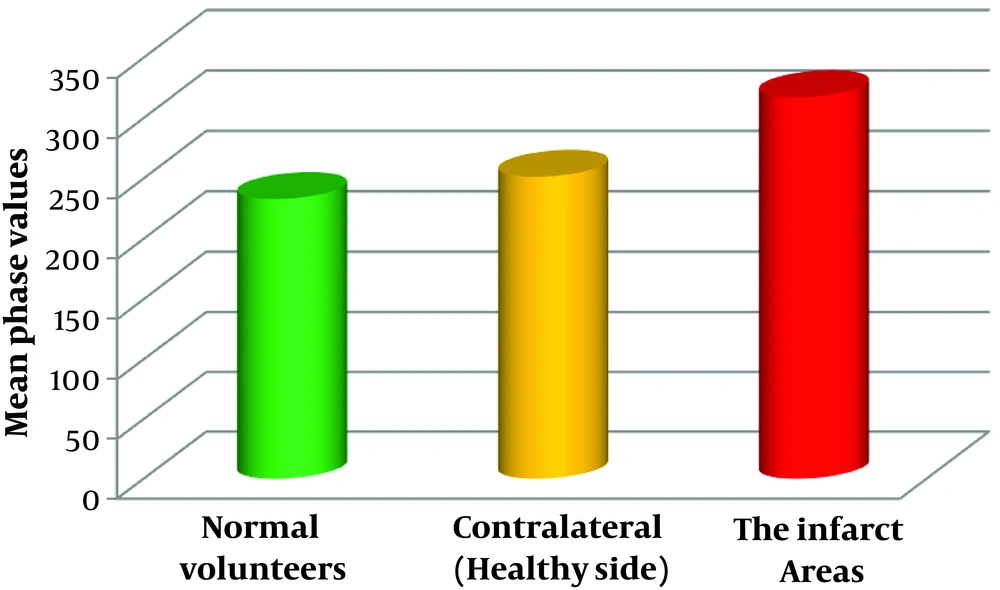
All regions of cerebellar hemisphere of normal healthy volunteers (240 regions of bilateral cerebellar hemispheres of 30 volunteers), cerebellar infarction area (26 regions of cerebellar infarction area of 17 patients; a patient with infarction in four regions that occupied the entire left hemisphere was excluded), and contralateral to the infarct area (30 regions of contralateral or healthy side of the infarct area of 18 patients) (Figure 4) were statistically analyzed.
The phase values of normal volunteers and contralateral to cerebellar infarction areas were not significantly different (P > 0.05). However, significant differences were observed between normal volunteers and the infarct areas (P < 0.0001) (Table 3).
| Items | Numbers | Phase values | t | P value |
|---|---|---|---|---|
| Normal volunteers | 240 | 232.81 ± 98.81 | -1.535 | 0.13 |
| Contralateral (healthy side) of infarct area | 30 | 251.20 ± 55.56 | ||
| Normal volunteers | 240 | 232.81 ± 98.81 | -4.207 | < 0.0001 |
| The infarct areas | 26 | 317.08 ± 77.88 |
Abbreviation: SD, standard deviation
aValues are expressed as mean ± SD.
4.4. Phase Value Δφ of Drainage Veins, rADC Values, and rCBF Values of the Infarction Area in the Cerebellar Hemisphere Compared with the Contralateral Region
In 17 patients, 26 infarcted areas were compared with the contralateral tissue, and significant differences were observed between the infarcted area and normal tissue in the phase value Δφ of drainage veins, rADC values, and rCBF values (P < 0.01) (Table 4).
| Items | Numbers | The infarct area | The contralateral region | t | P value |
|---|---|---|---|---|---|
| Δφ | 26 | 317.08 ± 77.88 | 253.10 ± 57.55 | 3.525 | 0.001 |
| rADC | 26 | 0.50 ± 0.07 | 0.72 ± 0.06 | -12.329 | < 0.0001 |
| rCBF | 26 | 23.14 ± 5.75 | 50.31 ± 3.53 | -20.533 | < 0.0001 |
Abbreviations: rADC, relative apparent diffusion coefficient; rCBF, regional cerebral blood flow; SD, standard deviation
aΔφ units: spin; ADC units: 10-3 mm2/s; CBF units: ml/(min·100 g)
bValues are expressed as mean ± SD.
4.5. Infarction Area of the Cerebellar Hemisphere Drainage Venous Phase Value Δφ, rADC Value, and rCBF Value Correlation Analyses
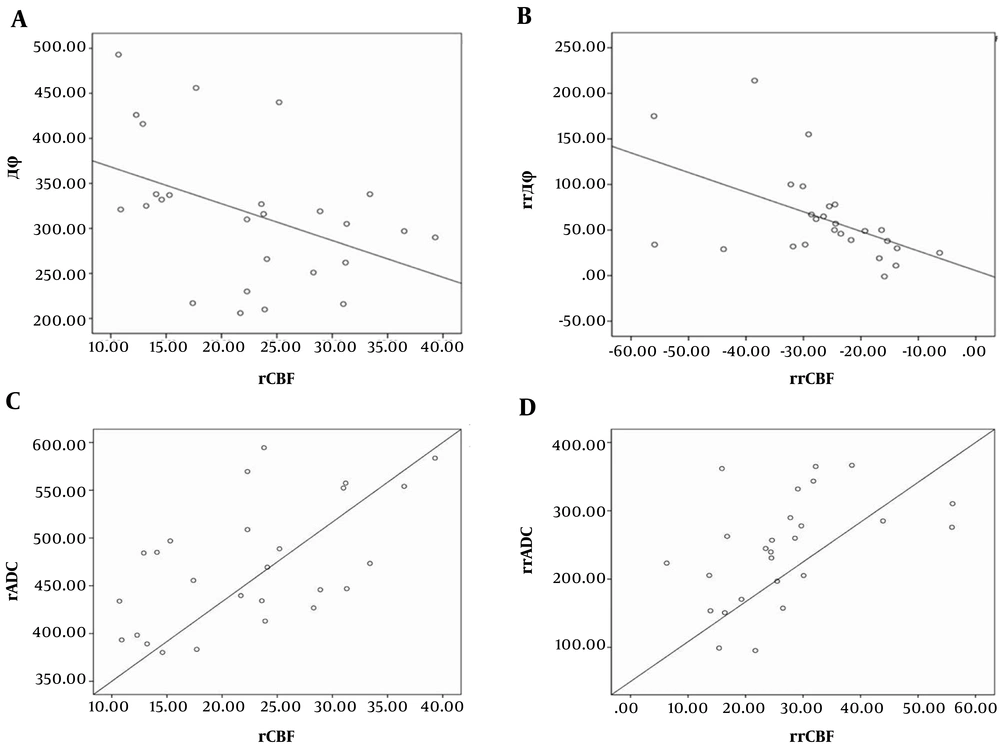
The infarction area drainage venous phase values were expressed as Δφinfarction, the relative phase values were denoted as Δφnormal, and the phase difference of bilateral cerebellar hemispheres was denoted as rrΔφ, where rrΔφ = Δφinfarction - Δφnormal. The difference of cerebral blood flow in the infarct region and contralateral was calculated as relative regional cerebral blood flow (rrCBF), where rrCBF = rCBFnormal - rCBFinfarction, rrADC was the difference of apparent diffusion coefficient between the infarct region and contralateral, and rrADC = rADCnormal - rADCinfarction. The phase value was negatively correlated with local cerebral blood flow in the infarct area (r = -0.433, P = 0.027) (Figure 5A), and there was a negative correlation between rrΔφ and rrCBF (r = -0.507, P = 0.008) (Figure 5B). Analysis of rCBF revealed a positive correlation with rADC (r = 0.566, P = 0.003) (Figure 5C), and rrCBF had a positive correlation with rrADC (r = 0.478, P = 0.013) (Figure 5D). However, the phase value was not correlated with the rADC value of the infarct area (r = -0.293, P = 0.146), and rrΔφ did not correlate with rrADC (r = 0.381, P = 0.055) (data not shown).
4.6. The Phase Value of Drainage Veins and rCBF Value of Critical Infarctions in the Ischemic Penumbra of Cerebellar Infarction (ROC Curve)
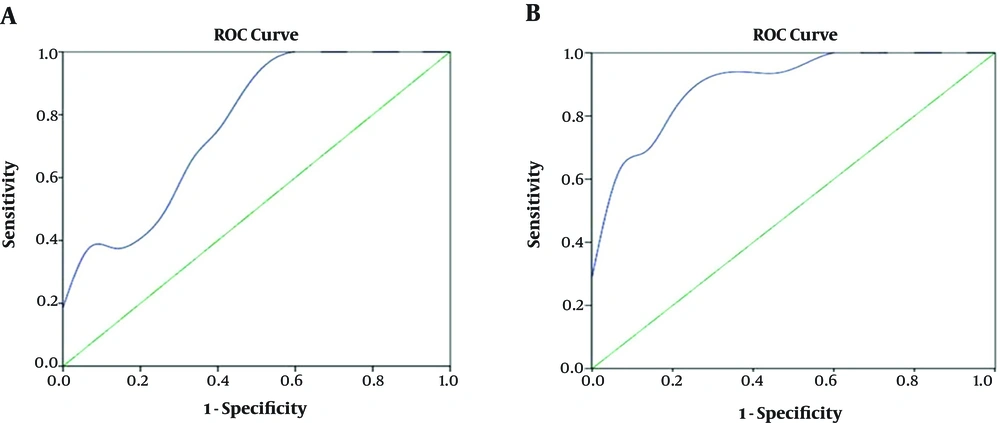
On the basis of the ROC curve, the critical value of the phase value Δφ and rCBF of the ischemic penumbra in the cerebellar infarction were 301 spin and 22.25 ml/(min·100g), respectively (Figure 6).
Receiver operating characteristic (ROC) curves of the phase value of drainage veins and regional cerebral blood flow value of critical infarction in the ischemic penumbra of cerebellar infarction. A, ROC analysis of Δφ for differentiating salvageable cerebellar tissue from infarction. Area under the curve (AUC) is 0.773 and cut off point is 301 spin, in which the sensitivity is 62.5%, specificity is 66.7%, and accuracy is 64.5%. B, ROC analysis of cerebral blood flow (CBF) for differentiating salvageable cerebellar tissue from infarction. AUC is 0.908 and cut off point is 22.25 ml/(min·100g), in which the sensitivity is 93.8%, specificity is 66.7%, and accuracy is 80.6%.
5. Discussion
In general, the oxygen saturation of normal arterial blood is above 95%, while the oxygen saturation of venous blood is about 55%. This ratio normally shows little change (15). In the early stage of ischemia, because of the self-regulating function of the cerebral blood vessels, CBF does not show much change. With further development of cerebellar infarction, cerebral blood flow and cerebral perfusion decrease. To maintain oxygen metabolism and normal physiological function of the cerebellar tissue, the oxygen uptake per unit volume of cerebellar tissue increases, with a consequent increase in the oxygen extraction fraction (OEF) (16). Moreover, deoxyhemoglobin content in the draining veins clearly increased, and therefore, its phase value Δφ increased. The number and phase of the drainage veins in the cerebellar infarction areas were higher than in the contralateral hemisphere and the normal volunteers (Table 3 and Figure 4). With decreasing cerebral blood flow, the phase value of the drainage veins increased (Figure 5A and B). Alterations in the venous blood phase value Δφ could reflect brain oxygen metabolism and changes in the oxygen uptake rate measured as the OEF (17, 18).
We observed a large number of converging branching venules converge, and multiple focal low signal intensities in the infarct area (Figure 1E and F). As the multiple focal low signal intensities on the SWI were due to the overall T2* effect of deoxyhemoglobin in capillary veins (19), we speculated that the decrease of cerebral perfusion pressure in the infarct area led to venous reverse perfusion and venule congestion, more oxygen consumption from venous blood caused oxygen saturation to further decrease, which enhanced T2* effect of deoxyhemoglobin in venules. Leeuwenhoke (20) through lots of subtle observations, proved that the arteries and veins are directly connected with capillaries. When the cerebellar artery was blocked, the blood flow of capillaries and draining veins of the infarct area would decrease. However, during venous phase of dynamic enhancement of MRI, in the infarct area, a patchy of enhanced high-signal and multiple enhanced venous vessels connected to the venous sinus were observed (Figure 2), and the patchy of enhanced high-signal maybe the net of congested capillary veins. The outer margin of the cerebellum is adjacent to the sigmoid venous and transverse sinuses, and this anatomical structure provides a sufficient anatomical basis for these phenomena.
Some large areas of cerebellar infarction after timely treatment often only remained a small liquefied area, some patients even completely cured. We believe that the infarct areas where venous reverse perfusion and venule congestion would have a better prognosis after effective clinical intervention, this may prevent or even delay the development of infarction with the oxygen in the venous blood providing a compensatory oxygen supply to the brain cells. However, this theory needs to be validated by future experiments with large sample sizes and clinical studies.
There were a few limitations to this study. First, when measuring CBF and ADC, the ROIs were drawn manually, which may be subjective to variability. Nevertheless, caution was taken to maintain consistency of drawing ROIs and consensus was reached in the case of discrepancy. Second, we had a small sample size of patients with cerebellar infarct, which may not be optimal in detecting subtle changes in the phase values and perfusion parameters. Third, there might be variation in the measurement of the perfusion parameters since ASL is known to have a low signal-to-noise ratio and is sensitive to motion artifacts. Last, it could be challenging to measure phase values in areas of the cerebellum due to tortuous vascular course and artifacts. We obtained repeated measurements from these areas to ensure the reliability of our technique.
In conclusion, our study showed the relevance of using the phase value and its correlation with cerebral blood flow to characterize cerebellar infarction. In addition, our findings suggested possible venous reverse perfusion and venous congestion in the infarcted cerebellar hemisphere, which may be critically related to the development of infarct. Furthermore, our approach using a combination of non-invasive imaging parameters including the susceptibility imaging, cerebral perfusion and diffusion may be helpful to diagnosis and management of stroke involving the cerebellum.
