


1. Background
As a rare malignant tumor, primary lymphoma of the bone accounts for only below 5% of the total number of primary neoplasms of the bone, with most cases being non-Hodgkin’s (1, 2). It occurs in a wide range of patients, with the age range of 1 - 86 years (36 - 52 years in the median), with the greatest incidence in the 60 - 80 years age range of life (1, 3). This tumor is rare in children below 10 years and takes place more frequently in males with a male/female ratio of 1.5:1. It is crucial to distinguish primary lymphoma of the bone from other forms of bone tumor because it responds better to treatment with a good outcome. However, primary bone lymphoma has complex imaging presentations, which need careful evaluation before a correct diagnosis is made. Primary bone lymphoma is confirmed according to histopathologic diagnosis of lymphoma, lesion isolation to single bones without involvement of other systems in clinical and imaging checkup, local metastasis or distal metastasis six months after the primary lesion is found (4).
2. Objectives
This study served to analyze the imaging presentations of primary bone lymphoma, especially the floating ice sign and the pathological bases.
3. Patients and Methods
This study was approved by the ethics committee of our hospital. All patients or their legal guardians provided their signed informed consent. A retrospective review of all patients confirmed with primary lymphoma of the bone by pathology was performed between 1963 and 2009 in our hospital. Forty-one patients with primary lymphoma of the bone were identified, including 27 male and 14 female patients with a median age of 40 years (range 2 - 72 years) and a sex ratio of 1.93:1 (27/14) including 19 cases (46%) between the age of 40 and 60 years. All patients had medical imaging examination, with plain radiography in all cases, computed tomography (CT) scan in 20, and magnetic resonance imaging (MRI) in 12. Three patients had enhanced MRI. CT scanning was performed with the GE Highspeed Dual CT scanner (GE Healthcare, MA, USA) or the Siemens Somatom Sensation 16 slice or 64 slice scanner (Siemens, Germany). The scanning parameters for GE Highspeed scanner were pitch = 1, slice thickness 3 mm, 3 mm interval of slice, a tube voltage of 120 kV, tube current of 200 - 300 mA with automatic milliampere technique. The scanning parameters of the Siemens scanners were collimator 0.6 mm, pitch = 1, a tube voltage of 120 kV, tube current of 200 - 300 mA, reconstruction slice thickness of 5 mm and 1 mm. MRI scanning was performed with the Siemens Symphony 1.5 T and Avanto 1.5 T scanner with the following scanning parameters: sagittal turbo-spin echo (TSE) T1-weighted [repetition time (TR)/ echo time(TE)], 550 ms/ 11 ms), TSE T2-weighted (TR/TE, 2800 ms/109 ms), T2 reverse response sequence (TR/TE, 3440 ms/102 ms; inversion time, 200 ms), field of view (FOV) 280 × 280 mm, and axial T2-multiple echo in 2 dimensions (TR/TE, 806 ms/14 ms). Slice thicknesses and slice gaps of 3 and 0.8 mm, respectively, were utilized for all procedures. For enhanced scans, the gadolinium contrast agent [gadolinium-diethylenetriaminepentaacetate (Gd-DTPA)] was injected through the elbow veins at a dose of 0.2 mmol/kg and rate of 2 mL/s. All patients underwent axial, sagittal, and coronal gadolinium-enhanced T1-weighted fat-saturated imaging (TR/TE, 700/11 ms; FOV, 280 × 100 mm). The medical imaging data of MRI and CT scanning were evaluated independently by two radiologists both with ten years of experience in medical imaging analysis. Imaging presentations were recorded and assessed. In disagreement, a third radiologist with thirty years of experience would be involved to reach an agreement in evaluation.
3.1. Statistical Analysis
Comparisons of imaging signs between children and adults, males and females were statistically analyzed by fisher’s exact test. The SPSS software (version 24.0, IBM Inc., Chicago, IL, USA) was used for statistical analysis, and P < 0.05 was considered to be statistically significant.
4. Results
At initial presentation, the primary complaints were local pain in 35 cases (85.4%), swelling in 13 cases (31.7%), increased skin temperature at the lesion in six (14.6%), neurological symptoms in three (7.3%) and fever in three (7.3%). Six patients (14.6%) had pathological bone fracture. The lesion involved long bones in 17 cases with 10 in the femur, flat bones in 12 cases with eight in the ilium, spine in eight and irregular bones in four (Table 1). Eleven cases had the lesion at the junction of metaphysis and diaphysis, accounting for 64.7% of long bone lesions.
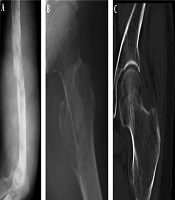
The imaging presentations were divided into five types: infiltrative, osteolytic, osteosclerotic, mixed and cystic types. Infiltrative type was seen in nine cases (22%) with permeative, infiltrative, moth-eaten, and osteolytic destruction with ill-defined margins (Figure 1A). Osteolytic type (Figure 1B and C) was detected in 14 cases (34.1%) with patchy osteolytic destruction, well-defined margins in two cases, ill-defined margins in 12 cases and concomitant pathologic fracture in four cases (two in the femur and two in the ilium). Osteosclerotic type (Figure 2A) was seen in four cases (9.8%) with increased and sclerotic density mixed with erosive osteolysis. In two cases with vertebral lymphoma, the vertebral body was sclerotic like ivory. Mixed type was detected in 11 cases (26.8%) including four cases with a “floating-ice” sign (Figure 2B and C). There were five cases with osteosclerosis inside an osteolytic lesion, four cases with a sclerotic rim surrounding the osteolytic lesion, and two cases with osteolysis and alternating osteoslcerosis. Cystic type was seen in three cases (7.3%) with cystic, expansile bone destruction with thinned cortex (Figure 3A and B). Among all the cases, patients with osteolytic and infiltrative types accounted for 56.1%. In plain radiography, 37 adult patients had no periosteal reaction; while, three of four long bone lesions in children had varying degree periosteal reaction (Figure 3C). Among 20 cases with CT scanning, sixteen had soft tissue masses, seventeen had ill-defined margins, and three had well-defined margins with sclerotic rims. Among twelve patients with MRI, ten had soft tissue masses with well-defined margins. Among eight patients with both CT and MRI scanning, the bone destruction extent was greater in MRI than in CT, and MRI demonstrated a greater extent of the intramedullary lesion than bone invasion visualized in CT scan (Figure 4). In one case whose plain radiographs and CT scan did not show apparent bone destruction, MRI revealed large extents of abnormal signal in the medullary cavity with invasion of the bone cortex. In MRI T1 weighted image (T1 WI), isointense signal was in three cases, hypointense signal in five and mixed signal in four. In T2 WI, isointense and hypointense signal was in five cases, hyperintense signal in three and mixed hyperintense signal in four. All patients had increased signal in fat inhibition T2 WI including two patients who had long line-like T2 signal in the bone cortex. All three patients with MRI enhancement had median uneven enhancement.
 and computed tomography (C).")
Infiltrative and osteolytic destruction. A, Infiltrative bone destruction is shown in the humerus; B and C, Osteolytic destruction is shown in the proximal end of the femur in the plain radiograph (B) and computed tomography (C).

Osteosclerotic and mixed type. A, Osteosclerosis is shown in the middle segment of the tibia with local bone destruction; B and C, Mixed type is shown in the calcaneus with “floating-ice” destruction, pathological fracture and a soft tissue mass.

Cystic bone destruction and periosteal reaction. A and B, The bone destruction in the left ilium is like multiple cysts with partial bone defect and no apparent soft tissue masses; C, In the upper segment of the right tibia, the density inside the medullary cavity is decreased slightly with ill-defined margins, single layer of periosteal reaction but no apparent soft tissue masses.

Osteolytic destruction in right humerus. A, Magnetic resonance imaging; B, Computed tomography. Osteolytic destruction is shown in the distal humerus with discontinued bone cortex, invasion of the articular surface and increased density of the surrounding soft tissue. Magnetic resonance imaging shows a greater extent than the computed tomographic scan.
A floating-ice sign indicated a large area of infiltrative osteolytic destruction with ill-defined margins, increased density and osteosclerosis in the residual bone which maintained the profile of the original bone, making the destroyed bone look like melted ice floating in water (Figure 2B and C). The cortex was like decayed wood with multifocal discontinuation, maintenance of the outline profile of bone, accompanied soft tissue masses but no sclerotic rims. Among 41 patients with primary lymphoma of the bone, four (9.8%) had the floating-ice sign, with two in the calcaneus and the other two in the lumbar vertebral bodies. The bones with the floating-ice sign were classified into mixed type of lesion.
In comparison of the imaging signs between children (n = 4) and adults (n = 37), the rate of periosteal reaction was significantly (P = 0.00) greater in children than in adults (Table 2). No significant (P > 0.05) difference existed in other imaging signs between children and adults. No significant (P > 0.05) difference was observed in the imaging signs between men and women (Table 3) or between long bones and other bones (Table 4).
| Location | Values |
|---|---|
| Flat bones | |
| Ilium | 8 (19.5) |
| Skull | 2 (4.9) |
| Scapula | 1 (2.4) |
| Sternum | 1 (2.4) |
| Long bones | |
| Femur-proximal | 3 (7.3) |
| Femur-diaphysis | 2 (4.9) |
| Femur-distal | 5 (12.2) |
| Tibia-proximal | 2 (4.9) |
| Tibia-diaphysis | 1 (2.4) |
| Humerus-diaphysis | 2 (4.9) |
| Humerus-distal | 1 (2.4) |
| Fibula-middle segment | 1 (2.4) |
| Spine | |
| Thoracic vertebra | 3 (7.3) |
| Lumbar vertebra | 3 (7.3) |
| Sacral vertebra | 2 (4.9) |
| Irregular bones | |
| Maxilla | 1 (2.4) |
| Ischium | 1 (2.4) |
| Calcaneus | 2 (4.9) |
| Total | 41 (100) |
Distribution of Primary Bone Lymphoma in 41 Patientsa
| Groups | Floating ice | Margin | Periosteal reaction | Expanded | Calcification | Sclerotic rim | Lesion density | Soft tissue expansion | Cortex | Pathologic fracture |
|---|---|---|---|---|---|---|---|---|---|---|
| Children (n = 4) | 1 (1.4) | 4 (4.4) | 3 (3.4) | 0 (0.4) | 0 (0.4) | 0 (0.4) | 4 (4.4) | 0 (0.4) | 2 (2.4) | 1 (1.4) |
| Adult (n = 37) | 3 (3.37) | 30 (30.37) | 0 (0/37) | 11 (11.37) | 1 (1.37) | 7 (7.37) | 32 (32.37) | 19 (19.37) | 20 (20.37) | 9 (9.37) |
| P value | 0.846 | 0.798 | 0.00 | 0.496 | 1.000 | 0.798 | 1.000 | 0.153 | 1.000 | 1.000 |
Medical Imaging Signs of Primary Lymphoma of Bone in Children and Adultsa
| Groups | Floating Ice | Margin | Periosteal reaction | Expanded | Calcification | Sclerotic rim | Lesion density | Soft tissue extension | Cortex | Pathologic fracture |
|---|---|---|---|---|---|---|---|---|---|---|
| Male (n = 27) | 3 (3.27) | 23 (23.27) | 3 (3.27) | 9 (9.27) | 1 (1.27) | 3 (3.27) | 24 (24.27) | 11 (11.27) | 12 (12.27) | 6 (6.27) |
| Female (n = 14) | 1 (1.14) | 11 (11.14) | 0 (0.14) | 2 (2.14) | 0 (0.14) | 4 (4.14) | 12 (12.14) | 8 (8.14) | 10 (10.14) | 4 (4.14) |
| P value | 1.000 | 0.923 | 0.507 | 0.350 | 1.000 | 0.331 | 1.000 | 0.318 | 0.100 | 0.948 |
Medial Signs of Primary Lymphoma of the Bone Between Men and Womena
| Groups | FLoating Ice | Margin | Periosteal reaction | expanded | Calcification | Sclerotic rim | Lesion density | Soft tissue extension | Cortex | Pathologic fracture |
|---|---|---|---|---|---|---|---|---|---|---|
| Long bone (n = 17) | 3 (3.17) | 13 (13.17) | 3 (3.17) | 6 (6.17) | 1 (1.17) | 3 (3.17) | 15 (15.17) | 6 (6.17) | 10 (10.17) | 4 (4.17) |
| Other bones (n = 24) | 1 (1.24) | 21 (21.24) | 0 (0.24) | 5 (5.24) | 0 (0.24) | 4 (4.24) | 21 (21.24) | 13 (13.24) | 12 (12.24) | 6 (6.24) |
| P value | 0.369 | 0.615 | 0.126 | 0.502 | 0.861 | 1.000 | 1.000 | 0.233 | 0.577 | 1.000 |
Comparison of Imaging Signs of Primary Lymphoma in Long and Other Bonesa
5. Discussion
Primary bone lymphoma is an extranodular lymphoma mostly in older patients. In our series, the age of patients ranged 2 - 72 years with 24 cases over 40 years of age (58.5%) and 19 cases between 40 and 60 years (46%). There were more males than females with a sex ratio of 1.93:1. The lesion occurred mostly in long bones (41.5%) followed by flat bones (29.3%), with the femur being the most prevalent bone (24.4%) followed by ilium (19.5%). In long bones, the lesions were mostly located at the metaphysis accounting for 26.8% of all patients and 64.7% of all long bone lesions.
Primary lymphoma of the bone presents with intermittent and occult local pain, which may persist for several months. Locally palpable masses, swelling and systemic symptoms like fever and weight loss may also manifest. Radicular symptoms and compression of the spinal cord may be caused if the vertebral body is involved (1, 5).
Radiological presentations of primary bone lymphoma are variable and non-specific, ranging from nearly normal appearance to focal osteolytic lesions with sclerotic rims to a mixed osteosclerotic-osteolytic or diffusely permeative lesion with destruction in the cortical bone and invasion in the surrounding tissue. In our series, the most common radiological presentation was osteolytic destruction accounting for 34.1%. In the report by Mulligan et al. (2), the lytic destruction pattern accounted for about 70% of 237 cases including permeative (with features of substantial small elongated rarefactions which are parallel to the bone long axis with same sizes) and moth-eaten (lots of medium and large regions of radiolucency in an ill-marginated bone area) patterns. In our study, patients with infiltrative, osteolytic and cystic pattern of bone destruction accounted for 63.4%, consistent with the report by Mulligan et al. (2). Our study just classified the osteolytic destruction into more detailed patterns. This type of bone destruction results from an osteoclast-stimulating factor (1). Pathologic fractures, cortical breakthrough and a soft tissue mass stand for more aggressive involvement with poorer prognosis (6). Periosteal reaction had been reported in approximately 60% of patients in lamellated form, and periosteal bone layers may parallel the long bone axis (onion-peel sign) or destructed. Broken periosteal bone is a helpful radiological sign indicating a poorer prognosis. In our study, only four (4/41 or 9.8%) children had periosteal reaction with none in the adult patients. Osteosclerotic pattern is rare in primary lymphoma of the bone in comparison with metastatic lymphoma of the bone, but a blended osteolytic lesion with sclerotic changes may be present (1). Osteoclerotic changes are rare in primary bone lymphoma, and of the two types of lymphoma, Hodgekin’s disease tends to have sclerotic appearance. Even in Hodgkin’s disease, osteolytic appearance is dominating (7). In the literature, subtle or “near-normal” radiological findings have been reported in primary lymphoma of the bone with almost disappearance of detectable abnormity on plain radiograms (8). Patients with significantly normal appearance on radiograms may demonstrate remarkable abnormity on radionuclide scans of bone and MRI. Consequently, in symptomatic patients with negative radiological presentations, further evaluation with more sensitive modalities including scintigraphy or MRI scan is necessary. In our study, MRI demonstrated a greater extent of lesion than did the CT scan. T1 WI is the best to display medullary changes as T1 WI reveals regions of hypointense signal within the medullary which appear generally bright on T2 WI (9). Edema adjacent to the tumor and reactive medullary alterations can also create hyperintense signal on T2 WI, but if a lesion has fibrosis, hypointense signal may be shown (10).
In imaging presentations in our study, a soft tissue mass appeared in 80% of patients with CT scan and 83% in MRI scan. MRI showed more accurate extents of lesion which all exceeded the bone destruction extent demonstrated in CT scan. This is probably related to the infiltrative and penetrating growth pattern of the tumor. In primary bone lymphoma, neoplasm activation of osteoclastic resorption with creation of tumor tunnels across the cortical bone may be one mechanism for lymphoma cells to escape the intramedullary space and form a large soft tissue mass without extensive bone destruction (9, 11). After studying correlation of MRI features with cytokine production by tumor cells of primary bone lymphoma, Hicks et al. (9) found that tunnels in MRI scan within the cortical bone in primary bone lymphoma corresponded to extensive bone resorption and marked osteoclastic activity. Immunohistochemical stains suggested that lymphoma cells mediated this process by producing cytokines of interleukin 1 (IL-1), IL-6 and tumor necrosis factor (TNF) to stimulate osteoclastic activity (9). Cortical destruction was a rare finding for bone lymphomas, and presence of complete destruction will exclude the diagnosis of lymphoma (11). However, the pattern of broad medullary diseases and adjacent soft tissue masses with no wide cortical destruction is almost exclusively demonstrated in round cell neoplasms like primary lymphoma of the bone, Ewing’s sarcoma, and multiple myeloma (1, 2). A possible reason for this finding is distribution of neoplasm cells from the medullary through small vascular channels which run via the cortical bone into adjacent soft tissues (9).
In this study, a specific sign of “floating ice” was shown even though only a few patients had such a sign. Because of greater aggressiveness of the tumor, tumor cells spread along the Haversian system leading to simultaneous destruction of the bone at different areas, with residual bone and reactive bone regeneration forming the floating ice sign in the destruction region. In four cases with the floating ice sign in our group, the cortex was destroyed like decayed wood, but the outline of the bone still existed, sketching the contour of the bone with irregular but no sclerotic rims. Permeative and moth-eaten radiological features at the metadiaphysis are not specific to primary bone lymphoma and may present in other diseases like osteosarcoma, secondary osseous lymphoma and metastatic tumors. An important radiological characteristic for primary bone lymphoma is the presence of osteolytic destruction at the ends of long bones with aggressive periosteal reaction. On MRI, one characteristic suggesting of infiltrative reaction like Ewing’s sarcoma and lymphoma is substitution of bone medullary, particularly in the situation of almost-normal radiological findings (1). Another more unique characteristic of round cell neoplasms like lymphoma is minimal cortical destruction concomitant with wide soft tissue and medullary involvement. These two features may suggest primary bone lymphoma.
Bone destruction stands for the most severe form of cortical change. Primary bone lymphoma differs significantly from osteosarcomas and rarely demonstrates focal osseous destruction and never complete destruction, which are the characteristics of osteosarcoma.
In conclusion, primary bone lymphoma occurs most frequently in long and flat bones as infiltrative osteolytic destruction, and combined plain radiographs, CT and MRI help obtain a correct diagnosis.
