1. Background
Myocardial ischemia is usually assessed using 2-D echocardiography by detecting the segmental wall motion abnormalities (1). This relies on visual detection of endocardial wall motion and assessment of left ventricular ejection fraction (LVEF). However, this approach is subjective and operator-dependent, requires complete visualization of the endocardium, and is subjective to the vicissitude of cardiac loading and heart rate. Although estimation of myocardial shortening and thickening reflects the radial mechanics of the heart, the contribution of longitudinal myocardial deformation has been neglected (2). Several investigators found that most patients with coronary artery disease (CAD) had no visual segmental wall motion abnormalities at rest despite having significant CAD (3).
Subendocardium is the cardiac layer that is most vulnerable to ischemic damage (3). Epicardial coronary artery stenosis is associated with reduction in the subendocardial to subepicardial flow ratio (4-6). The subendocardial region consists of longitudinally directed fibers, significantly contributing to long axis function (7-10). Thus, an objective, comprehensive, and non-invasive measurement of myocardial performance and contractility with acceptable interpretative variability is essential. Measurements of myocardial strain (ԑ) and strain rate (ԑ’) are new indices that have the potential to overcome these limitations. Strain and strain rate represent the magnitude and rate of myocardial deformation, which is an energy requiring process that occurs in both systole and diastole (2). Abnormalities of myocardial deformation are generally seen early in development of many pathophysiological states, including ischemia (2). Experimental sonomicrometric techniques have identified regional changes in myocardial function that are induced by ischemia (11-14). Acute ischemia induced a delay in the onset of contraction, a progressive decrease in the rate and degree of the thickening, and a progressive delay in the timing of the peak thickening until this event occurred in early diastole for the surrounding non-ischemic myocardial segments. Besides, prior in vivo animal studies based on tissue Doppler imaging (TDI) documented a significant reduction in the peak systolic velocities, the velocity gradient (15, 16), and peak systolic strain (17, 18). Thus, quantitation of the segmental systolic parameters derived from high resolution TDI data might be the optimal solution for functional studies of patients with CAD.
2. Objectives
The present study aims to determine the diagnostic value of strain rate imaging by TDI in patients with suspected CAD.
3. Methods
3.1. Study Population
The subjects were prospectively enrolled into the study between March 2014 and February 2015. The participants included 67 patients (73.6%) with stable angina (SA) and 24 ones (26.4%) with un-stable angina (UA) for whom elective coronary angiography was planned. All the patients had normal wall motion scoring based on the standards of the American society of echocardiography. The patients with the history or electrocardiogram (ECG) signs of transmural myocardial infarction, dilated or hypertrophic cardiomyopathy, myocardial hypertrophy, significant valve disease, pacemaker implantation, atrial or ventricular arrhythmia, bundle branch blocks, apparent wall motion abnormalities, and LVEF < 50% were excluded from the study . The patients with unsatisfactory echocardiographic recordings were excluded, as well.
3.2. Echocardiographic Data
Echocardiographic studies were performed for all the patients using Phillips IE33 and 3.5 MH transducer. In doing so, the patients were scanned in lateral decubitus position and the routine 2D grayscale and TDI were recorded at three standard apical (two-, three-, and four-chamber) views prior to coronary angiography. The left ventricular chamber size was obtained in the M-mode and EF was determined using the modified Simpson method. Besides, aortic and mitral valves opening and closing were defined to occur on the Doppler profile relative to R wave on the ECG. Cine loop of three consecutive cardiac cycles was used for each three standard apical views through TDI at the end expiratory apnea using high frame rate (range: 90 - 150). Afterwards, real time analysis of the longitudinal peak systolic strain for the individual segments was performed using an 18-segment division of the left ventricle. In this regard, each wall (anterior, inferior, posterior, lateral, septal, and anteroseptal) was divided into basal, middle, and apical segments.
3.3. Strain Parameters Analysis
QLAB2® software in Phillips IE33 was used in order to analyze strain parameters. The first parameter was the strain pattern (homogeneous/heterogeneous). Accordingly, marked heterogeneity of the strain was considered to be abnormal. On the other hand, a homogeneous pattern was defined as relatively uniform distribution of the peak systolic strain. The second parameter was the peak longitudinal systolic strain (ԑsys) for each segment. Finally, Post Systolic Shortening (PSS) strain (ԑpss) and duration of PSS (Tpss) were measured. The ԑpss to ԑsys (ԑpss/ԑsys) and ԑpss to ԑmax (ԑpss/ԑmax) ratios were also calculated at the same time.
3.4. Coronary Angiography
The indication for coronary angiography in the study subjects was determined by clinical judgment. Accordingly, significant CAD was defined if the stenosis was equal to or more than 70% of the lumen diameter. On the other hand, the normal coronary group was defined as no stenosis or stenosis < 50% of the lumen diameter. In case the patients’ stenosis was between 50% and 70%, they were excluded from the study.
3.5. Statistical Analysis
The data were analyzed using the SPSS statistical software, version 20. All the data were expressed as mean standard deviation (SD). One-way analysis of variance (ANOVA) was used to compare the continuous variables. Besides, categorical variables were expressed as frequencies and percentages and were compared using chi-square test. In order to assess the diagnostic accuracy of echocardiographic parameters, receiver operator characteristics (ROC) analysis was performed to determine the cut-off value of strain parameters that best distinguished the presence or absence of significant coronary stenosis. An optimal cutoff point maximizing both sensitivity and specificity was also determined for each of the measured parameters. Then, relative diagnostic accuracy of different measurements was evaluated using area under curve (AUC) of the ROC plot. P values less than 0.05 were considered to be statistically significant.
4. Results
4.1. Baseline Characteristics
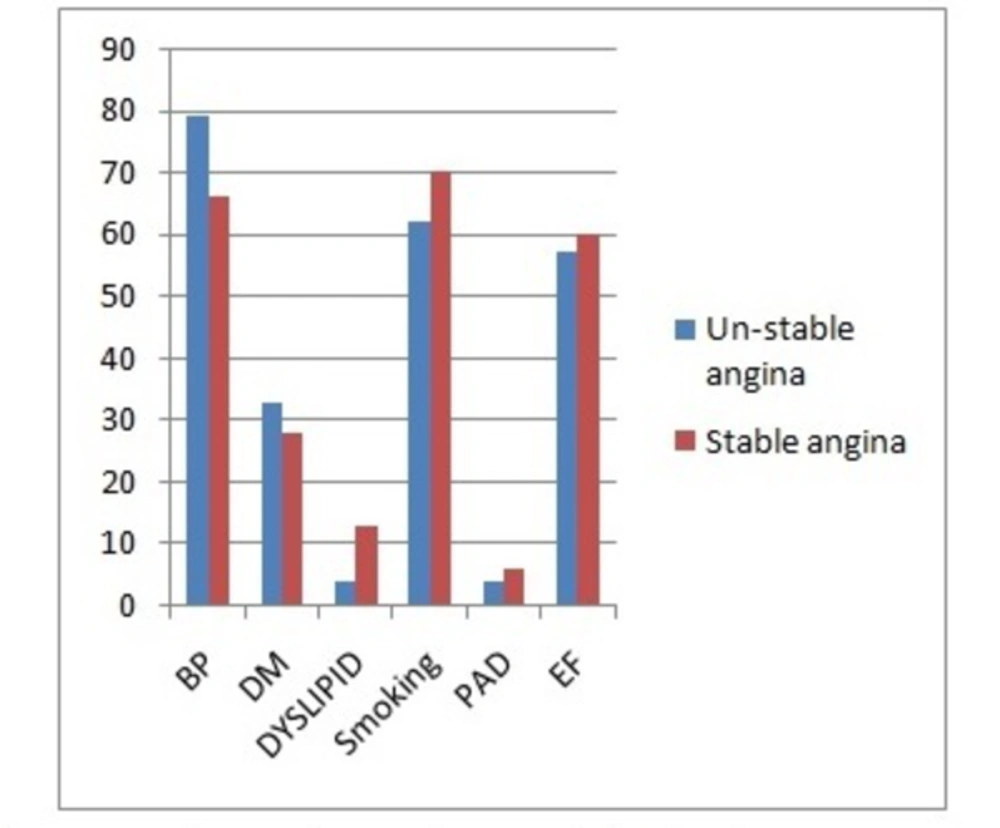
This study was conducted on 91 patients (58 males and 33 females) with SA (n = 67) or UA (n = 24). The major demographic and clinical characteristics of the patients have been presented in Table 1 and Figure 1.
| Unstable Angina N = 24 (26.4%) | Stable Angina N = 67 (73.6%) | Total N = 91 (100%) | |
|---|---|---|---|
| Age, yr | 53.91 ± 10.02 | 53.13 ± 9.1 | 53.34 ± 9.3 |
| Gender, M/F | 14/10 | 44/23 | 58/33 |
| Hypertension (%) | 19 (79%) | 44 (66%) | 63 (69%) |
| Diabetes mellitus (%) | 8 (33%) | 19 (28%) | 27 (30%) |
| Smoking (%) | 15 (62%) | 47 (70%) | 62 (68%) |
| Dyslipidemia | 1 (4%) | 9 (13%) | 10 (11%) |
| PAD | 1 (4%) | 4 (6%) | 5 (6%) |
| EF | 57 ± 4% | 60 ± 5% | 59.3 ± 4.6% |
Abbreviations: EF, ejection fraction; F, female; M, male; PAD, peripheral artery disease.
aValues have been presented as mean ± SD.
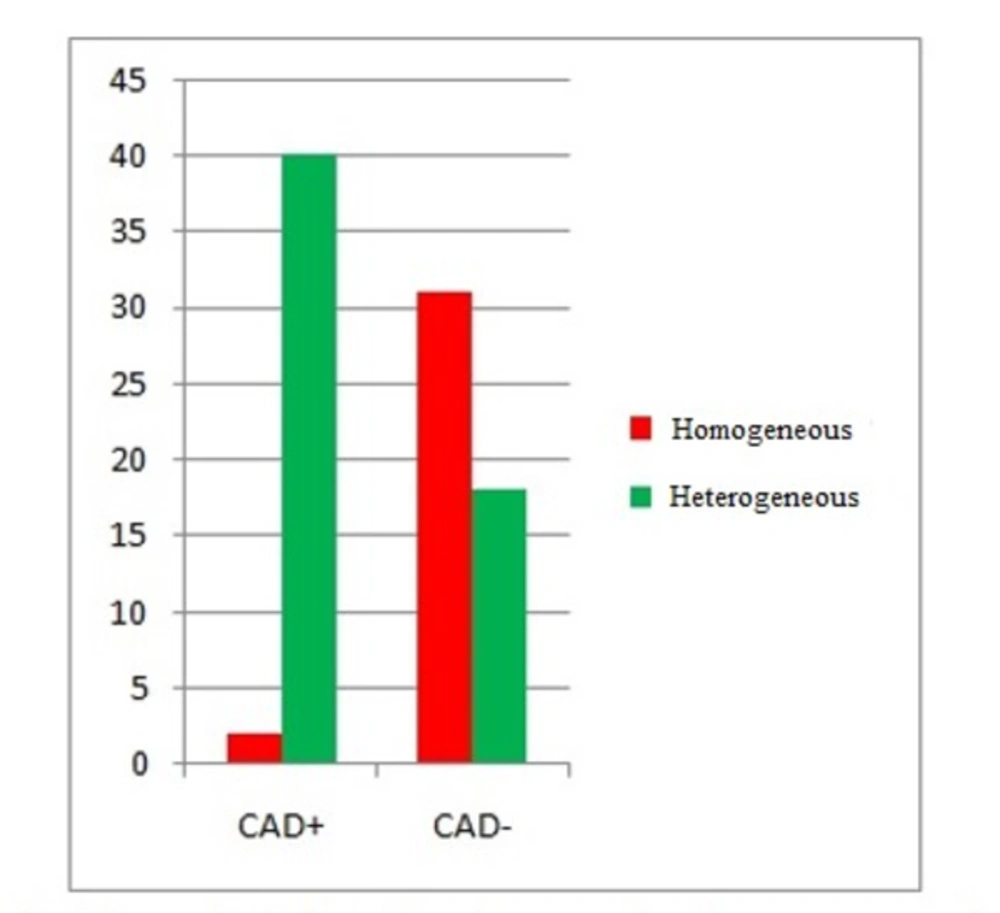
Among the 42 CAD+ patients, 40 ones (95.2%) showed marked heterogeneity of the peak systolic strain, while 2 (4.8%) showed a homogeneous pattern. However, among the 49 CAD- patients, 31 ones (63.3%) showed the homogeneous pattern of the peak systolic strain, while 18 (36.7%) showed a heterogeneous pattern (Table 2 and Figure 2).
| Strain Pattern | |||
| Homogenous (Strain Negative) | Heterogeneous (Strain Positive) | ||
| CAD+ (%) | 2 (4.8%) | 40 (95.2%) | 42 (100%) |
| CAD- (%) | 31 (63.3%) | 18 (36.7%) | 49 (100%) |
| 33 (36.3%) | 58 (63.7%) | 91 (100%) | |
The results of chi-square test indicated a significant difference between the CAD+ and CAD- patients regarding the strain pattern (P < 0.001). The sensitivity and specificity were 93.9% and 68.9%, respectively.
Peak longitudinal systolic strain (εsys) was studied in every segment for each patient. The results showed that out of the 1638 segments, 1175 (71.7%) were normal and 463 (28.3%) were abnormal. Additionally, a significant difference was observed between the two groups with respect to εsys. Accordingly, εsys was higher in the abnormal segments (P < 0.001) (Table 3). The normal segments were also compared to their corresponding abnormal segments in each LV segment regarding εsys. The results demonstrated that εsys was significantly higher in abnormal segments (P < 0.001) (Table 4).
| Normal | Abnormal | Total | ||
|---|---|---|---|---|
| εsys | Number of Segments | 1175 (71.7%) | 463 (28.3%) | 1638 (100%) |
| Mean ± SD | -17.1 ± 5.4 | -9.1 ± 5 | 14.9 ± 6.4 |
| Apical view | Normal | Abnormal | P Value | ||
|---|---|---|---|---|---|
| Count | Mean ± SD | Count | Mean ± SD | ||
| Anterior apical | 61 (3.7%) | -16.4 ± 4.4 | 30 (1.8%) | -6.8 ± 5.4 | < 0.001 |
| Anterior mid | 62 (3.8%) | -16.2 ± 4.3 | 29 (1.8%) | -6.9 ± 4.2 | < 0.001 |
| Anterior basal | 62 (3.8%) | -18.3 ± 4.9 | 29 (1.8%) | -9.9 ± 5.9 | < 0.001 |
| Inferior apical | 60 (3.7%) | -23.7 ± 6.6 | 31 (1.9%) | -13.4 ± 5.3 | < 0.001 |
| Inferior mid | 69 (4.2%) | -17.1 ± 4.1 | 22 (1.3%) | -10.4 ± 3.4 | < 0.001 |
| Inferior basal | 69 (4.2%) | -14.9 ± 4.2 | 22 (1.3%) | -7.8 ± 3.4 | < 0.001 |
| Lateral apical | 60 (3.7%) | -16.3 ± 5.4 | 31 (1.9%) | 6.9 ± 4.5 | < 0.001 |
| Lateral mid | 71 (4.4%) | -15.1 ± 4.3 | 20 (1.2%) | -7.1 ± 4.5 | < 0.001 |
| Lateral basal | 76 (4.6%) | -17.8 ± 4.7 | 15 (0.9%) | -9.9 ± 5.1 | < 0.001 |
| Septum apical | 61 (3.7%) | -21.4 ± 5.6 | 30 (1.8%) | -12.4 ± 5.1 | < 0.001 |
| Septum mid | 72 (4.4%) | -16.2 ± 4.4 | 19 (1.2%) | -8.4 ± 4.7 | < 0.001 |
| Septum basal | 69 (4.2%) | -14.1 ± 4.5 | 22 (1.3%) | -7.7 ± 3.5 | < 0.001 |
| Ant.septum apical | 61 (3.7%) | -19.8 ± 6.3 | 30 (1.8%) | -9.1 ± 4.9 | < 0.001 |
| Ant.septum mid | 61 (3.7%) | -16.8 ± 4.6 | 30 (1.8%) | -9.1 ± 4.3 | < 0.001 |
| Ant.septum basal | 62 (3.8%) | -15.1 ± 5.2 | 29 (1.8%) | -8.1 ± 4.6 | < 0.001 |
| Posterior mid | 60 (3.7%) | -16.9 ± 5.5 | 31 (1.9%) | -8.8 ± 5.6 | < 0.001 |
| Posterior basal | 69 (4.2%) | -15.7 ± 4.5 | 22 (1.3%) | -10.9 ± 3.9 | < 0.001 |
| Total | 70 (4.3%) | -18.5 ± 5.2 | 21 (1.3%) | -10.2 ± 3.3 | < 0.001 |
| Values have been presented as mean ± SD. | 1175 (71.7%) | 17.16 ± 5.45 | 463 (28.3%) | -9.12 ± 5.01 | < 0.001 |
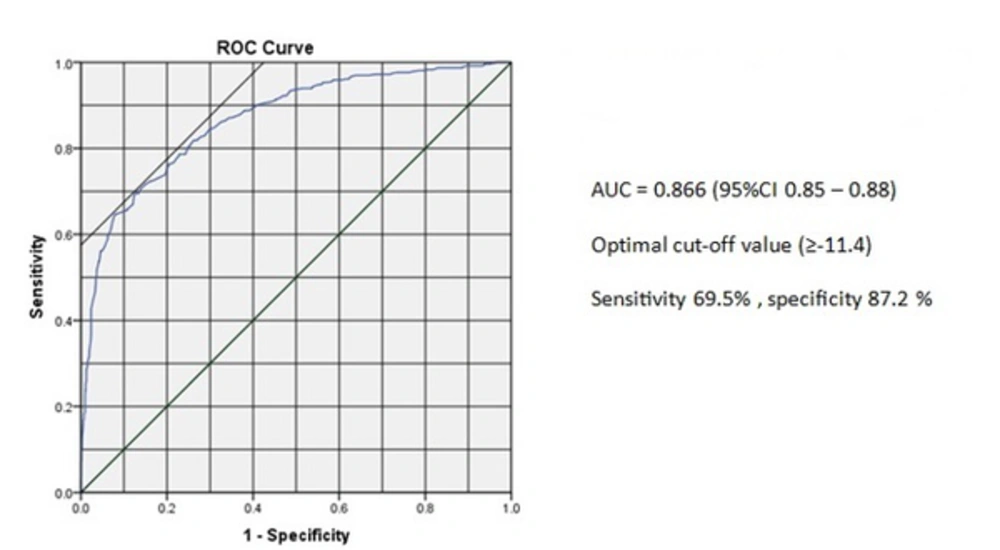
ROC analysis of the peak longitudinal systolic strain yielded the optimal cutoff point of ≥ -11.4 for prediction of CAD (Figure 3). The sensitivity and specificity of the peak longitudinal systolic strain for the optimal cutoff point of ≥ -11.4 were 69.5% and 87.2%, respectively. Area under ROC was also 0.866 [95% CI (0.85 - 0.88)].
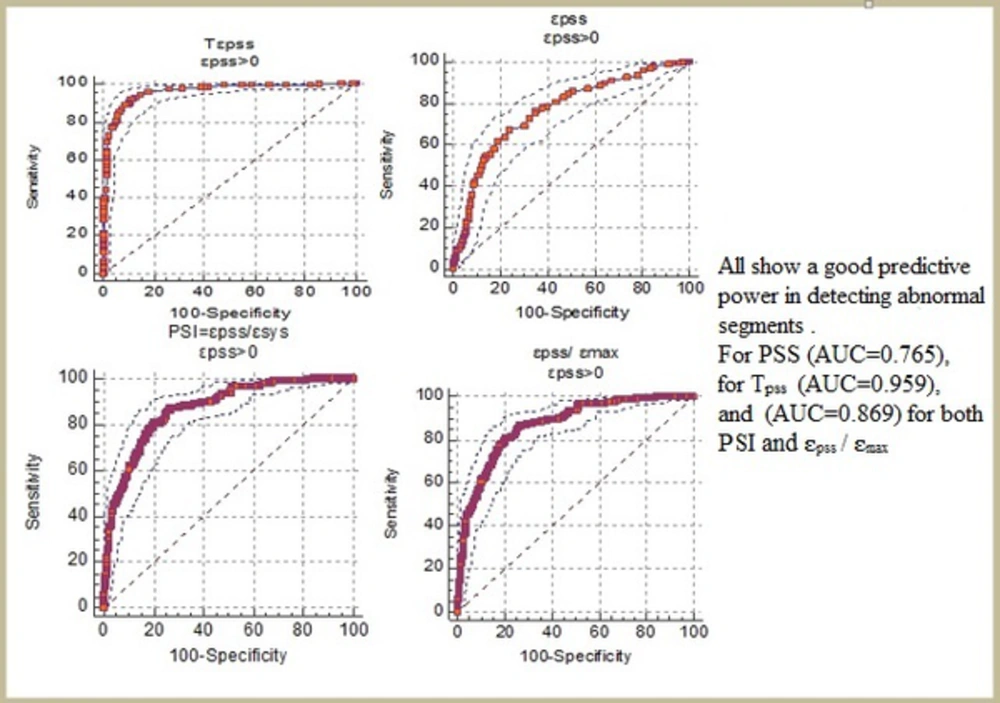
PSS was detected in 266 out of the 1175 normal segments (22.6%) and 299 out of the 463 abnormal segments (64.5%) (Table 5). Moreover, compared to the normal segments, PSS was found significantly more frequently in the ischemic segments (P < 0.001). The absolute magnitudes of ԑpss , ԑpss/ԑsys (PSI), and ԑpss/ԑmax were significantly larger and TPSS was significantly longer in the abnormal segments compared to the normal ones (P < 0.001) (Table 6 and Figure 4).
| Normal | Abnormal | Total | |
|---|---|---|---|
| εpss + | 266 (47.1%) | 299 (52.9%) | 566 (100%) |
| εpss - | 909 (84.7%) | 164 (15.3%) | 1073 (100%) |
| 1175 (100%) | 463 (100%) | 1638 (100%) |
| Normal N = 266 (47.1%) | Abnormal N = 299 (52.9%) | P Value | Optimal Cutoff point | Sens. % | Spec. % | AUC | |
|---|---|---|---|---|---|---|---|
| ԑpss | -2.78 ± 1.5 | -4.41 ± 2.19 | < 0.001 | > -3.3 | 67.2% | 75.9% | 0.765 |
| TPSS | 39.5 ± 10.4 | 76.2 ± 18.9 | < 0.001 | > 47 | 91.8% | 88.8% | 0.959 |
| ԑpss/ԑsys | 0.25 ± 0.31 | 1.03 ± 1.24 | < 0.001 | > 0.29 | 80.9% | 79.7% | 0.869 |
| ԑpss/ԑmax | 0.17 ± 0.11 | 0.40 ± 0.19 | < 0.001 | > 0.23 | 80.9% | 79.7% | 0.869 |
Abbreviations: PSS, post systolic shortening; Tpss, duration of PSS; ԑmax, max systolic strain; ԑpss, post systolic strain; ԑsys, peak systolic strain.
The effects of the risk factors on ԑsys were also evaluated in this study. In doing so, the patients were divided into four groups as follows: normal patients with no risk factors (n = 11), those with hypertension (n = 35), those with dyslipidemia (n = 7), and those with diabetes mellitus (DM) (n = 9). The results indicated that ԑsys was significantly higher in the patients with DM and dyslipidemia compared to those without any risk factors (P < 0.01). However, no significant difference was found between the patients with hypertension and without risk factors regarding ԑsys (P = 0.79) (Table 7).
| Patients with Normal Catheterization | ||||
| No Risk Factors | Hypertension | Diabetes Mellitus | Dyslipidemia | |
| Count | 11 | 35 | 9 | 7 |
| Mean εsys | -18.1 ± 1.59 | -17.9 ± 2.22 | -14.75 ± 2.19 | -15.58 ± 2.63 |
| Comparison to the patients with no risk factors | - | P = 0.79 | P = 0.0009 | P = 0.02 |
5. Discussion
Performing conventional echocardiography for detecting ischemia-related systolic abnormalities involves visually estimating the changes in wall thickening in the circular muscle. However, because regional mechanical events occur every 50 - 60 ms, visual estimation has considerable limitations. Therefore, techniques that quantify regional mechanics are being increasingly investigated as a means of objectively identifying myocardial ischemia. The concept of assessing myocardial stiffness by using a measure of deformation (i.e., strain) was described by Mirsky and Parmley in 1973 (19). Physically, strain has been defined as the relative change in the length of a material related to its original length.
SRI is a new technique developed based on TDI. It can assess regional myocardial function with sufficient temporal and spatial resolution by measuring myocardial strain and strain rate (18). Unlike TDI velocity mode, SRI parameters are relatively homogeneous throughout the myocardium. Besides, SRI is theoretically immune to cardiac translation and respiratory and tethering effects. Thus, SRI is superior to TDI in providing more accurate information about regional myocardial motion (20). Therefore, it has the potential to evaluate the occurrence and characteristics of PSS easily, non-invasively, and accurately (21).
The majority of studies have shown that peak longitudinal systolic strain reduced significantly in the myocardial segments subtended by coronary arteries with > 70% stenosis compared to those in the myocardial segments subtended by coronary arteries with < 70% stenosis and normal arteries, whereas the peak systolic radial and circumferential strain was preserved (22). Generally, myocardial fibers consist of three different anatomical layers (8-10). The innermost subendocardial layer of fibers has an oblique clockwise orientation in the longitudinal direction. Recent studies have demonstrated that subendocardial layer of fibers mainly contribute to cardiac long axis function (7). It has also been reported that in case of reduction of the coronary artery flow, subendocardial myocardium would be the first to suffer and subendocardium is more vulnerable to ischemic damage compared to midmyocardium and subepicardium (3, 23). Furthermore, Yao et al. (2008) (6) used myocardial contrast echocardiography and demonstrated that subendocardial flow began to reduce after 75% stenosis of the left anterior descending coronary artery, whereas the subepicardial flow remained unchanged. This pattern of redistribution of flow away from the endocardium may in part explain the finding obtained in our study.
Comparison of normal and abnormal patients regarding the peak longitudinal strain pattern in the present study indicated that ischemic heart characterized by marked heterogeneity of myocardial systolic strain and tissue Doppler strain imaging demonstrated reduced shortening or stretching in the interrupted vessel territories. Besides, the sensitivity and specificity were 93.9% and 68.9%, respectively. Moreover, ԑSYS was significantly higher in the abnormal segments compared to the normal ones. The ROC curve analysis also yielded the following results: AUC = 0.866 [95% CI (0.85 - 0.88)]. At the optimal cutoff point of ≥ -11.4, the sensitivity and specificity were 87.2% and 69.5%, respectively. In the study performed by Choi et al. in 2008 (24), the AUC was 0.87 and the optimal cutoff point was > -5.7 with sensitivity of 71% and specificity of 93%. Voigt et al. (25, 26) reported that SRI could detect PSS in ischemic myocardium and that ԑPSS might reflect the severity of myocardial ischemia (27). PSS has also been proposed as a convenient marker of regional myocardial viability (28, 29). However, PSS is not pathognomonic of myocardial disease because careful analysis of myocardial deformation pattern revealed that PSS might also occur in normal myocardium of healthy subjects, but not frequently (25). Similar to the previous studies, our research confirmed that PSS occurred significantly more frequently in ischemic compared to normal myocardium (PSS was found in 22.6% of the normal segments and 64.5% of the ischemic segments in this study, while its frequency in normal segments was up to 30% in all the previous studies). In ischemic myocardium, PSS might be an expression of heterogeneity in regional myocardial tension that could result from prolonged contraction or delayed relaxation. This represented a delayed, active, energy-consuming contraction appeared after left ventricle segmental unloading and regional wall stress falling during isovolumic relaxation (30). In normal myocardium, on the other hand, PSS appeared to be a part of a well-balanced and well-synchronized ventricular reshaping process during isovolumic relaxation period (31). Thereby, the magnitude of PSS was larger in the ischemic myocardium than in the normal myocardium.
Moreover, compared to the normal myocardium, the absolute magnitudes of ԑpss and ԑpss/ԑsys [PSI] and ԑpss/ԑmax ratios were significantly larger and duration of PSS (Tpss) was significantly longer in the ischemic myocardium. In fact, TPSS was twice longer and PSI was four times bigger in the ischemic myocardium. This suggests that these parameters may be used to distinguish normal from ischemic myocardium.
Our results also indicated that ԑsys was higher in the normal patients with DM and dyslipidemia compared to those without risk factors. This might be attributed to microvascular disease, altered myocardial metabolism, and structural changes in the myocardium with increased fibrosis (32).
5.1. Study Limitations
A significant limitation of our study was that perfusion scintigraphy, such as single photon emission computed tomography (SPECT), was not performed as a reference standard to define normal or ischemic myocardium. Additionally, the wall motion of the heart is physiologically more dynamic at the base than at the apical segment, tissue Doppler-derived strain echocardiography is strongly angle-dependent, and evaluation of the apex that is a common site of ischemia is difficult because of the angulation issues. Furthermore, the salvage effect of reperfusion that results in normally functioning segments within the affected areas was not take into account. Therefore, in situations with well-developed collateral circulation, such as multi-vessel disease or chronic total occlusion, the systolic deformation might be synchronous. Finally, this study was not blinded because some analyses of the strain parameters depended on clinical information.
In conclusion, in most of the patients with CAD, visual segmental wall motion abnormalities could not be detected at rest with conventional 2-D echocardiography despite the presence of significant coronary stenosis. Our study showed that the peak longitudinal strain declined at rest in the myocardial segments subtended by coronary arteries with more than 70% stenosis. PSS is a common and important feature of the ischemic myocardium. ԑpss, (ԑpss/ԑsys) [PSI], (ԑpss/ԑmax), and TPSS measured by SRI might also be promising markers for quantitative assessment of regional myocardial dysfunction in patients with CAD.


