


1. Background
According to the literature, heat stress and subsequent high body temperature are the main causes of decreased performance during exercise (1). In team sports, when high-intensity repetitive speed movements are required, as well as in hot, humid conditions for 40 to 60 minutes, players are more likely to experience some symptoms of heatstroke (2). Futsal is a heavy exercise that contains intense, repetitive activities and therefore increases the body’s central temperature. When muscles are frequently stimulated to the maximum level of activity, their maximum activity starts to weaken progressively due to increased body temperature (3). In such cases, by changing the blood flow from depth to surface, fewer blood transfers to muscles and other organs necessary to perform the activity, which in turn decreases the function (4). Also, as the body’s temperature rises, sweating increases, and more water expels from the body. In such conditions, plasma and important minerals are lost, and thus the performance reduces. Therefore, it seems that to reach the highest level of performance, the effects of temperature increase should be controlled (5). Recently researchers have considered the pre-cooling technique as a way to control the temperature during the warm-up phase (6). The pre-cooling technique has been considered as a way to reduce the central body and skin temperature, increase muscle blood flow, increase body heat reserves, reduce sweating, and prevent plasma and blood electrolyte depletion (6-8). Pre-cooling reduces the body’s central and peripheral temperature before, during, and after activity and increases the body’s heat reserves. It also delays the onset of heat excretion mechanisms by prolonging the time to reach the threshold of perspiration (6). In these cases, less blood comes to the surface of the body, which in combination with reduced sweating, blood volume, and mineral salts are maintained, and eventually, athletic performance improves (9).
In one study, the pre-cooling technique was examined by wearing an ice vest for 38 minutes, and it was found that pre-cooling improved performance and enhanced the record of the Olympics endurance runners (10). In another study on futsal players, the pre-cooling technique using the ice vest method during special interval training was examined at a temperature of 30ºC. The results of this study showed that performing pre-cooling reduces the heart rate (11). The effect of wearing an ice vest while warming-up for 25 minutes on long-term interval training was explored in another study. The results of this study showed that wearing an ice vest while warming up improves interval training (12). On the other hand, most researchers have examined the effects of pre-cooling on long-term activity, while few studies have investigated the effects of the duration of pre-cooling application (13).
2. Objectives
As a result, since limited research is conducted on the effect of the pre-cooling technique on anaerobic performance indicators in high-intensity short-term activities, the current study aimed to investigate whether the pre-cooling technique for 30 minutes of duration changes the anaerobic performance of futsal players? And in this way, some of the possible mechanisms responsible for regulating and controlling temperature by this technique can be determined, and also the results of this research can be used to take useful steps to improve the performance of players of this sport.
3. Methods
The statistical population of this study was 20 young female active futsal players. The inclusion criteria were have had at least two years of activity in the field of futsal, at least three to four sessions training per week, and participating in all training sessions and measuring research variables. Therefore, 12 female futsal players aged from 22 to 24 years were randomly selected. The characteristics of subjects, including age, height, and weight, are provided in Table 1. In this study, the subjects formed control and experimental groups in two separate sessions at a distance of 3 days from each other using cross-design. In each session, the subjects were randomly divided into two groups, one group with a vest and without an ice and another with an ice vest (performing the pre-cooling for 30 minutes before performing the test). Then two groups were performed the RAST test. In the second session and, again, in the same way, the two groups were formed randomly, and then the RAST test was performed. This research was also conducted based on the ethical standards mentioned in the Helsinki Statement and was approved by the Ethics Committee of the Physical Education group.
| Variables | Mean ± Standard Deviation |
|---|---|
| Age (years) | 22.5 ± 2.2 |
| Height (cm) | 159.1 ± 0.61 |
| Weight (kg) | 55.26 ± 12.7 |
| Body Mass Index (kg/m2) | 21.9 ± 2.3 |
| Body fat (%) | 20.2 ± 4.2 |
| Temperate (ºC) | 27 ± 0.8 |
3.1. Training Protocol
On the first day, the subjects were warming-up for 10 minutes with a submaximal heart rate (120 - 140 beat.min-1), which was equivalent to 40% - 60% of the maximum heart rate, and after that, they performed the RAST test, which is an anaerobic power test. The test was performed six times running with the maximum speed at a distance of 35 meters. At first, the two cones were placed at a distance of 35 meters from each other, and the subjects passed the distance between the two cones at the maximum speed with the sound of a whistle, and again; they sprint the 35-meter route at maximum speed, and this was repeated six times. Also, the sprint time of 35 meters was recorded each time separately (14, 15). Then the anaerobic power was calculated using Equation (1), (1), and the times obtained from sprinting every six times were used to calculate the fatigue index and maximum, medium, and minimum power (16, 17). Also, buerer-FT-70 digital thermometer, polar-FT60 heart rate monitoring, micro lifeblood pressure monitoring, hp-cosmos lactometer, and ELISA technique were used to measure the core temperature, heart rate, blood pressure, blood lactate, and Lactate dehydrogenase, respectively (18, 19).
3.2. Statistical Analysis
T-independent and dependent tests were used to compare changes between and within groups. It should be noted that the difference between pre-test and post-test was considered as the unit number of Delta (∆) with an Interval confidence of α < 0.05, which was considered at all stages of the test. Statistical analysis was performed using SPSS version 21.
4. Results
According to the results of the data analysis, implementing pre-cooling protocol increased the changes (∆) in central temperature in the pre-cooling group compared to the control group, which was significant between the two groups (P = 0.035) (Figure 1 and Table 2). On the other hand, the changes in the heart rate in the pre-cooling group were lower than the control group and this decrease was significant (P = 0.002) (Table 2). These results showed that the pre-cooling increased changes in heart rate and these changes were significant compared to the control groups (Figure 1) (P < 0.05). The findings showed that the changes in lactate dehydrogenase enzymes in the pre-test and pre-test comparisons in the pre-cooling group were significant (Figure 1) (P < 0.05). Also, in the between-groups comparisons, changes in these enzymes were significant (P < 0.05) (Table 2).
| Variables Pre-Cooling Control | Pre-Test, Post-Test, Changes (∆) | Pre-Test, Post-Test, Changes (∆) |
|---|---|---|
| Central temperature (ºC) | 36.2 ± 0.07, 36.5 ± 0.3, 0.29 ± 0.03a, b | 36 ± 5.3, 36.6 ± 0.34, 0.1 ± 0.08 |
| Heart rate (b.min-1) | 71 ± 5, 136 ± 10a, 64 ± 9b | 73 ± 7, 156 ± 11a, 83 ± 14 |
| Blood lactate (mmol.L-1) | 1.6 ± 1.6, 8 ± 1a, 7.5 ± 1.1 | 1.7 ± 0.3, 10.6 ± 2a, 8.8 ± 2.4 |
| Lactate dehydrogenase (IU.L-1) | 220 ± 45, 250 ± 50, 28a, b | 180 ± 42, 190 ± 39, 9 |
| Systolic blood pressure (mmHg) | 10.5 ± 0.5, 13.1 ± 0.9, 2.6 | 10.6 ± 0.9, 12.1 ± 1.2, 1.8 |
| Diastolic blood pressure (mmHg) | 6.4 ± 0.5, 8.2 ± 0.6, 1.8 | 7.1 ± 0.7, 8 ± 0.7, 0.9 |
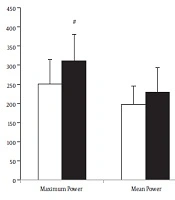
| Maximum power (W) | 311 ± 70a | 251 ± 63 |
| Mean power (W) | 229 ± 63 | 197 ± 48 |
| Minimum power (W) | 169 ± 44 | 140 ± 30 |
| Fatigue index (W.sec-1) | 3.65 ± 1a | 2.54 ± 0.88 |
aSignificant difference with pre-test
bSignificant difference with the control group
. <sup>#</sup>Significant difference with control group (P < 0.05).")
The change in research variables in pre-cooling and control groups. *Significant difference with pre-test (P < 0.05). #Significant difference with control group (P < 0.05).
Besides, according to the results, changes in the systolic and diastolic pressures both within and between groups comparisons were not significant (P > 0.05) (Table 2 and Figure 2). Furthermore, the implementation of the pre-cooling protocol could not significantly change the rate of blood lactate changes before and after the RAST test (P > 0.05) (Table 2). However, this rate of change in the control group was higher than the pre-cooling group (P > 0.05) (Figure 2).
.")
The change in research variables in pre-cooling and control groups. *Significant difference with pre-test (P < 0.05).
Also, the rate of changes in the maximum power output in the pre-cooling group compared to the control group was higher, and these differences were significant (P = 0.018) (Table 2). The results also indicated an increase in the minimum power output in the pre-cooling group compared to the control group (P = 0.75) (Figure 3). Also, no significant difference was observed in mean power output changes in the control and pre-cooling groups (P = 0.199) (Figure 3). The results also showed a significant difference between the two groups concerning the fatigue index (P = 0.013) (Figure 4).
.")
The change in power output in pre-cooling and control groups. #Significant difference with the control group (P < 0.05).
.")
The change in fatigue index in pre-cooling and control groups. #Significant difference with the control group (P < 0.05).
5. Discussion
Based on the results, 30 minutes of pre-cooling technique with the ice vest significantly reduced the central temperature by 3.3ºC degrees. The results of this study are consistent with the results of Clarke et al. who also used the ice vest (11). On the other hand, the results of the current study showed a significant change in the rate of heart rate in the pre-cooling group compared to the control group. This decrease can be attributed to decreased body temperature. As the body’s core temperature decreases, less blood travels to the surface tissues to regulate body temperature. So more blood goes to deep tissues, including skeletal muscle. Which in turn, causes the muscles to receive more fuel and excrete waste faster. This mechanism reduces the heart rate, and the heart directs the blood to the muscles involved with a lower number of beats (20, 21).
The systolic and diastolic blood pressures in the pre-cooling and control groups were not significantly different from the pre-test and the control group. Since, according to the results, the pre-cooling has reduced the central temperature of subjects and subsequently peripheral vasoconstriction, reduced heart rate has prevented significant differences in systolic and diastolic blood pressures between the two groups. The results also showed an increase in plasma lactate dehydrogenase levels in both groups after the RAST test. Most studies have suggested that the secretion of the enzyme lactate dehydrogenase may be stimulated by changes in muscle tissue following intense activity (22, 23). It can be attributed to the decreased body temperature due to the pre-cooling, which in turn has increased the intensity of activity in the pre-cooling group and metabolism is directed toward the anaerobic pathway, and blood lactate dehydrogenase levels in the pre-cooling group have increased (22, 23).
Also, the present study results indicated no significant difference concerning the changes in blood lactate produced in the two groups, which is consistent with the results of the study by vaile et al. (24). The possible mechanism of no change in the amount of lactate produced in this study may be due to the nature of the decreased temperature in the present study so that lowering the temperature in the pre-cooling technique is ineffective in accelerating the production of lactate produced in the muscles involved during the test and factors other than temperature changes are required to affect the lactate production (8). Under conditions of maximum activity, if an increase in the volume of central blood leads to increased muscle access to the blood, this will increase the transfer of oxygen, which will result in greater engagement of the aerobic system to supply energy to any specific power efficiency (25, 26). It may also increase the clearance of metabolic by-products such as blood lactate from the muscles (26). The limitations of this research were the number of subjects and duration of the pre-cooling; however, more research is needed on the effects of gender, level of readiness, number of subjects, and pre-cooling temperature.
Meanwhile, the results showed that the maximum power output and the fatigue index are significantly different among the two groups, but its mean and minimum power were not significant between the two groups. The results of this study are consistent with the results of Hunter et al. (27); Siegel et al. (10), in which reported improved performance after performing the pre-cooling technique. It seems that the decrease in temperature causes muscle stiffness and increases the number of actin and myosin bands and affects the rate of force development, thus results in increased maximum power (25). On the other hand, by decreasing the central body temperature, the subjects could reach the critical temperature threshold later, and this caused less fatigue. All these mechanisms are important in preventing anaerobic power reduction (16).
5.1. Conclusion
Overall, the results of the current study suggest that the pre-cooling technique, by lowering the core temperature, improves the repetition of strenuous activity through vascular blockage of the skin, which may increase blood flow to the working muscles.
