


1. Background
Patients with end-stage renal disease (ESRD) have limited treatment options, and kidney transplantation (KTx) is typically considered the final resort (1, 2). The recipient's immune response determines the success of KTx and the likelihood of post-transplantation complications, which is reduced by immunosuppressive therapy (1-5). Detecting and confirming kidney allograft complications is conventionally done through the invasive method of biopsy (6, 7). However, a new approach that measures immunological mediator expression in recipients' peripheral blood mononuclear cells (PBMCs) early post-transplantation may help detect kidney graft dysfunction in the future. This method has the potential to decrease the need for biopsy, enhance the processes involved in immunosuppressive treatment, and improve graft survival.
Regulatory T-cells (Tregs) are a subset of T-cells with a CD4 + CD25 + forkhead box P3 (FOXP3) + phenotype, constituting approximately 5% to 10% of CD4 + T-cells. They naturally derive from the thymus and mediate self and peripheral tolerance. They suppress effector T-cell responses to establish allograft tolerance in recipients (8-10). The FOXP3, a significant hallmark of Tregs, is the essential component that converts non-Treg cells to Tregs and supports the Treg suppressive function via different mechanisms (11, 12). Interleukin-2 (IL-2) plays a critical role in supporting the function, maintaining the stability, and promoting the survival of CD4 + CD25 + FOXP3 + regulatory T-cells, which are vital for the proper functioning of the immune system (9). The activity of IL-2 is mediated via the high-affinity and heterotrimeric IL-2 receptor (IL2R) to exert its immunomodulatory functions. The IL-2R consists of IL-2Rα (CD25), IL-2Rβ (CD122), and IL-2Rγ (CD132) chain subunits (13). The high constitutive expression of CD25 is another hallmark of regulatory T-cells and sensitizes them to the low amount of IL-2 in the environment (11, 12). FOXP3, CD25, and IL-2 are components of the JAK/STAT signaling pathway in Tregs. These regulatory cells can bind to secreted IL-2 through CD25 and activate the pathway, inducing FOXP3 expression and promoting immune tolerance (9, 11-14).
2. Objectives
The objective of this investigation is to assess the immune tolerance induced by Tregs for the early detection of kidney graft dysfunction. This is achieved through quantifying the expression levels of FOXP3, CD25, and IL-2 early post-transplantation in PBMCs of kidney allograft recipients.
3. Methods
3.1. Patients
The population studied in this research consisted of 39 adults (aged 18 - 76 years) who had undergone KTx and received allografts from cadaver donors between 2019 and 2020 at Abu Ali Sina Hospital. In establishing the exclusion criteria, patients with a history of previous kidney transplants or those who underwent multi-organ transplants, such as kidney-pancreas transplants, were excluded to avoid confounding variables. Additionally, individuals unable to commit to the one-year follow-up period were also excluded, ensuring a more consistent assessment of post-transplantation outcomes.
Blood samples were collected from kidney transplant recipients (KTRs) during the first week after transplantation, and various tests were conducted over a period of six months. Recipients were categorized into two groups: Stable graft recipients (SGR) and non-SGR, based on a combination of laboratory tests [creatinine (Cr), blood urea nitrogen (BUN), proteinuria], clinical status in the first week, and biopsy results (based on Banff score) conducted one year post-KTx. The non-SGR group exhibited biopsy-proven complications, such as T-cell-mediated rejection (TCMR), antibody-mediated rejection (ABMR), mixed rejection, acute tubular injury, glomerulitis, and renal failure. In contrast, recipients in the SGR group had well-functioning grafts and no biopsy history. The study population included 21 individuals in the SGR group and 18 individuals in the non-SGR group. Additionally, a healthy control group of 15 individuals was included. All included recipients tested negative for HCV, HBV, HIV, and COVID-19 prior to transplantation.
In adherence to the principles outlined in the Declaration of Helsinki, the research was carried out and received approval from the Ethical Committee of Shiraz University of Medical Sciences (IR.SUMS.REC.1399.1317).
3.2. Immunosuppressant Regimen
All patients enrolled in the study received the same immunosuppressive regimen during the first week post-KTx. As a potent induction therapy, they were treated with thymoglobulin or anti-thymocyte globulin (rabbit). The administration of thymoglobulin began prior to surgery and continued for 3 - 5 days post-KTx, with a total dose of 4 - 6 mg/dL/kg. The immunosuppressive maintenance regimen included an antimetabolite (mycophenolate mofetil or mycophenolic acid), a type of calcineurin inhibitor (CNI) such as tacrolimus, and a corticosteroid (prednisolone).
Patients were given tacrolimus tablets at a dose of 2 mg every 12 hours. The total tacrolimus dose was measured daily, and the optimal range was 8 - 10 ng/mL. Patients were given mycophenolate mofetil tablets with a total dose of 1 g/day. Additionally, recipients received prednisolone with a dose of 1000 mg in the operating room, followed by a dose of 25 mg in the first week. It should be noted that none of the patients from either group received antibody induction therapy.
3.3. Biochemical Blood Test
The assessment of the recipient's clinical status necessitates the evaluation of various biochemical markers in the bloodstream, including Cr, BUN, uric acid, albumin (ALB), alanine transferase (ALT), aspartate transferase (AST), and alkaline phosphatase (ALP). To analyze the significance of these markers, measurements were conducted in both the SGR and non-stable graft recipient (non-SGR) groups at various time points, including pre-KTx, as well as 1, 3, 5, and 7 days post-KTx. The results are presented in Table 1.
| Patients Indices | Total Patients (n = 39) | Allograft Tolerance | P-Value | |
|---|---|---|---|---|
| SGR (n = 21) | Non-SGR (n = 18) | |||
| Recipient age (y); range (mean ± SD) | 20 - 68 (38.77 ± 17.58) | 20 - 68 (35.33 ± 16.43) | 20 - 68 (42.77 ± 18.48) | - |
| Recipient gender; No. (%) | - | |||
| Female | 8 (20.52) | 5 (23.81) | 3 (16.67) | |
| Male | 31 (79.48) | 16 (76.19) | 15 (83.33) | |
| Recipient blood group; % | - | |||
| A+ | 33.3 | 23.8 | 44.4 | |
| B+ | 12.8 | 9.5 | 16.7 | |
| AB+ | 2.6 | 4.8 | 0 | |
| O+ | 48.7 | 57.1 | 38.9 | |
| O- | 2.6 | 4.8 | 0 | |
| The mean of Cr (mg/dL) | ||||
| Cr0 | 5.85 ± 2.82 | 6.02 ± 3.01 | 5.57 ± 2.58 | 0.671 |
| Cr1 | 5.63 ± 1.74 | 5.71 ± 1.87 | 5.53 ± 1.61 | 0.748 |
| Cr3 | 3.68 ± 1.77 | 3.10 ± 1.42 | 4.36 ± 1.92 | 0.028 |
| Cr5 | 2.78 ± 1.88 | 1.99 ± 1.02 | 3.71 ± 2.22 | 0.006 |
| Cr7 | 2.36 ± 1.59 | 1.65 ± 0.69 | 3.20 ± 1.93 | 0.004 |
| The mean of BUN (mg/dL) | ||||
| BUN0 | 36.07 ± 14.33 | 34.00 ± 13.85 | 38.64 ± 14.92 | 0.331 |
| BUN1 | 35.17 ± 11.39 | 32.57 ± 11.40 | 38.22 ± 10.91 | 0.123 |
| BUN3 | 41.48 ± 13.52 | 37.19 ± 11.81 | 46.50 ± 13.98 | 0.033 |
| BUN5 | 40.61 ± 20.19 | 31.66 ± 13.82 | 51.05 ± 21.73 | 0.003 |
| BUN7 | 39.74 ± 18.42 | 31.42 ± 11.91 | 49.44 ± 20.17 | 0.003 |
| The mean of uric acid (mg/dL) | ||||
| Uric acid1 | 5.32 ± 1.46 | 5.26 ± 1.76 | 5.4 ± 1.00 | 0.827 |
| Uric acid3 | 5.36 ± 1.96 | 4.65 ± 2.04 | 5.65 ± 1.91 | 0.291 |
| Uric acid5 | 5.17 ± 2.01 | 4.56 ± 1.92 | 5.63 ± 2.00 | 0.168 |
| Uric acid7 | 5.63 ± 2.34 | 5.13 ± 1.28 | 5.90 ± 2.75 | 0.376 |
| The mean of ALB (g/dL) | ||||
| ALB1 | 3.58 ± 0.4 | 3.64 ± .40 | 3.48 ± .39 | 0.321 |
| ALB3 | 3.42 ± 0.46 | 3.36 ± .62 | 3.45 ± .39 | 0.773 |
| ALB5 | 3.44 ± 0.41 | 3.60 ± .55 | 3.34 ± .28 | 0.296 |
| ALB7 | 3.54 ± 0.36 | 3.65 ± .40 | 3.48 ± .33 | 0.412 |
| The mean of AST (U/L) | ||||
| AST1 | 24.26 ± 12.18 | 27.20 ± 11.87 | 18.75 ± 11.46 | 0.117 |
| AST3 | 20.22 ± 11.18 | 21.25 ± 3.20 | 19.92 ± 12.67 | 0.729 |
| AST5 | 25.40 ± 26.47 | 27.50 ± 28.61 | 24.00 ± 26.63 | 0.816 |
| AST7 | 22.84 ± 17.69 | 26.20 ± 15.73 | 20.75 ± 19.54 | 0.593 |
| The mean of ALT (U/L) | ||||
| ALT1 | 31.50 ± 26.58 | 29.46 ± 18.10 | 35.28 ± 39.45 | 0.722 |
| ALT3 | 25.61 ± 15.14 | 29.66 ± 9.55 | 22.58 ± 18.08 | 0.259 |
| ALT5 | 71.40 ± 117.52 | 54.80 ± 42.85 | 79.70 ± 142.96 | 0.622 |
| ALT7 | 45.57 ± 62.01 | 66.71 ± 84.64 | 24.42 ± 11.22 | 0.236 |
| The mean of ALP (U/L) | ||||
| ALP1 | 224.36 ± 110.97 | 234.78 ± 126.42 | 206.12 ± 81.63 | 0.526 |
| ALP3 | 236 ± 186.53 | 209.50 ± 54.07 | 243.06 ± 209.42 | 0.586 |
| ALP5 | 182.61 ± 72.07 | 197.00 ± 100.34 | 175.41 ± 57.28 | 0.641 |
| ALP7 | 189.40 ± 97.11 | 228.66 ± 126.25 | 163.22 ± 67.93 | 0.283 |
Abbreviation: SGR, stable graft recipients; ALB, albumin; Cr, creatinine; ALT, alanine transferase; AST, aspartate transferase; ALP, alkaline phosphatase; BUN, blood urea nitrogen.
a Values are expressed as mean ± SD unless otherwise indicated.
b The mean of biochemical lab data at pre (0) and (1, 3, 5, 7 days) post KTx.
3.4. RNA Extraction and cDNA Synthesis
Blood samples from recipients and controls were collected and treated with EDTA, mixed with Ficoll, and centrifuged to extract the white layer (buffy coat). The buffy coat was then washed with ammonium chloride and stored in phosphate-buffered saline (PBS) at -80°C. Total RNA was extracted from each recipient's buffy coat using Trizol reagent (YTzol, Tehran, Iran), and the concentration and purity of the RNA were determined using NanoDrop spectrophotometry (Thermo Scientific, USA) at 260/280 nm. The extracted RNA was then converted to cDNA using the AddScript cDNA synthesis kit (addbio, Korea) and stored at -20°C until it was used for real-time PCR.
3.5. Real-Time PCR
The fold changes (FCs) of FOXP3, CD25, and IL-2 genes were evaluated through SYBR Green real-time PCR. The reactions were duplicated using the optical 96-well plate applied biosystems (Foster City, California, USA) step one plus system. Glyceraldehyde 3-phosphate dehydrogenase (GAPDH) was used as the internal control gene to normalize the data. The PCR amplification mix consisted of a PCR master mix (including hot-start Taq DNA polymerase, SYBR green I dye, dNTPs mixture, protein stabilizers, and enhancers), forward and reverse primers (10 pmol), and cDNA. All real-time PCR tests were repeated three times to ensure the accuracy and reliability of the results. The reverse and forward primer sequences and real-time PCR conditions are detailed in Table 2.
| NCBI Reference Sequence mRNA (NM) and Primers | Primer Sequences (5' - 3') | PCR Product Length (bp) | Thermocycling Program | PCR Mix |
|---|---|---|---|---|
| FOXP3 (001114377.2) | 123 | 95°C/10 min, 40 cycles at 95°C/15 sec, 60°C/35 sec | SYBR green master mix (10 μL; 2x concentration), primers: 0.8 μL/10 p mole, nuclease-free deps water: 6.4 µL, template cDNA: 2µL | |
| Forward | CCC AGA GTT CCT CCA CAA CA | |||
| Reverse | TCA TTG AGT GTC CGC TGC TT | |||
| IL-2 (000586.4) | 105 | |||
| Forward | AAC TCA CCA GGA TGC TCA CA | |||
| Reverse | GCA CTT CCT CCA GAG GTT TGA | |||
| CD25 (001308242.2) | 128 | |||
| Forward | AAT GCA AGA GAG GTT TCC GC | |||
| Reverse | TTT CGT TGT GTT CCG AGT GG | |||
| GAPDH (001256799.3) | 119 | |||
| Forward | GGA CTC ATG ACC ACA GTC CA | |||
| Reverse | CCA GTA GAG GCA GGG ATG AT |
Abbreviations: bp, base pair; FOXP3, forkhead box P3; IL-2, interleukin-2; GAPDH, glyceraldehyde 3-phosphate dehydrogenase.
3.6. Statistical Analysis
Data analysis was performed using SPSS version 22 (SPSS, Chicago, IL, USA). To calculate the expression level of each studied gene, the Livak (2-ΔΔCt) method was used. Nonparametric tests, such as the Mann-Whitney test, were performed to analyze the difference in expression levels between the SGR and non-SGR groups. The independent samples t-test was used to compare the Cr and BUN levels between these groups. For the intragroup comparison of Cr and BUN levels on different days, the paired samples t-test was used. A statistically significant result was considered when P < 0.05. The area under the curve (AUC) value of fold change for studied genes was determined for both the SGR and non-SGR groups, and the specificity and sensitivity of each were reported.
4. Results
4.1. Demographic and Biochemical Characteristics of Recipients
The mean age of all recipients was 38.77 ± 17.58 years, with 35.33 ± 16.43 years for the SGR group and 42.77 ± 18.48 years for the non-SGR group. Most recipients were male (79.48%), with a mean age of 38.74 years. The most common blood group among SGR recipients was O+ (57.1%), while the most abundant blood group in the non-SGR group was A+ (44.4%), as shown in Table 1.
4.2. The Creatinine Levels in Kidney Transplant Recipients: Trends and Comparisons
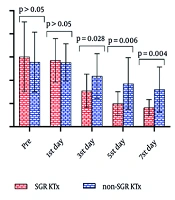
In this study, Cr levels in the blood of KTRs were measured pre-transplantation, as well as on the 1st, 3rd, 5th, and 7th days post-transplantation. The results showed a decreasing trend in the mean Cr levels for both the SGR and non-SGR groups throughout the first week post-KTx. However, Cr levels in the SGR group were significantly lower compared to the non-SGR group on the 3rd (SGR: 3.10 ± 1.42, non-SGR: 4.36 ± 1.92, P = 0.028), 5th (SGR: 1.99 ± 1.02, non-SGR: 3.71 ± 2.22, P = 0.006), and 7th (SGR: 1.65 ± 0.69, non-SGR: 3.20 ± 1.93, P = 0.004) days post-KTx (Figure 1A).
 and B, blood urea nitrogen (BUN) levels between stable graft recipients (SGR) and non-SGR recipients from pre-kidney transplantation (KTx) to 7 days post-KTx")
A, Comparison of creatinine (Cr) and B, blood urea nitrogen (BUN) levels between stable graft recipients (SGR) and non-SGR recipients from pre-kidney transplantation (KTx) to 7 days post-KTx
Additionally, BUN levels were assessed in all KTx patients before and after transplantation at multiple time points (1st, 3rd, 5th, and 7th days post-KTx). The mean BUN levels showed a declining trend in the SGR group but an increasing trend in the non-SGR group from pre-KTx to the first week post-KTx. Comparisons of BUN levels between the SGR and non-SGR groups revealed significantly lower BUN levels in the SGR group on the 3rd (SGR: 37.19 ± 11.81, non-SGR: 46.50 ± 13.98, P = 0.03), 5th (SGR: 31.66 ± 13.82, non-SGR: 51.05 ± 21.73, P = 0.003), and 7th (SGR: 31.42 ± 11.91, non-SGR: 49.44 ± 20.17, P = 0.003) days post-KTx (Figure 1B).
Analysis of non-SGR KTRs revealed a positive correlation between Cr and BUN levels at two different time points post-KTx. On the 3rd day post-KTx, the correlation was observed to be R = 0.39, P = 0.009, while on the 7th day post-KTx, the correlation strengthened, yielding R = 0.65 and P = 0.0004 (Figure 2A and B).
 and BUN levels in the non-stable graft recipients (non-SGR) group. A, on the 3rd day post-kidney transplantation (KTx) (R = 0.39, P = 0.009); B, on the 7th day post-KTx (R = 0.65, P = 0.0004)")
Correlation between creatinine (Cr) and BUN levels in the non-stable graft recipients (non-SGR) group. A, on the 3rd day post-kidney transplantation (KTx) (R = 0.39, P = 0.009); B, on the 7th day post-KTx (R = 0.65, P = 0.0004)
4.3. Outcomes of Non-stable Kidney Graft Recipients
Out of the 18 recipients in the non-SGR group, 14 (77.77%) underwent biopsy within a year following the transplant. The biopsy was conducted based on the results of serologic tests and the clinical status of the recipients. The biopsy results showed that 8 of 18 recipients (44.44%) in the non-SGR group experienced rejection of their kidney grafts. Of these, 7 (38.88%) were primarily affected by TCMR, with grades IA (1), IIA (1), IB (4), and IIB (1), and 1 (5.55%) was affected by ABMR. Five of the 8 rejected recipients (27.77%) showed signs of mixed rejection in their biopsy results. Acute tubular injury, ranging from mild to severe, was detected in 13 of 18 recipients (72.22%). One recipient's kidney graft failed, leading to hemodialysis and nephrectomy. Out of the 18 recipients in the non-SGR group, 4 (22.22%) did not undergo biopsy in the year after the transplant, but their kidney complications were still confirmed through laboratory tests and clinical correlation.
4.4. Expression Levels of Forkhead Box P3, CD25, and Interleukin-2 in Kidney Transplant Recipients
The results showed that all studied genes were up-regulated in all KTRs compared to the healthy control group. The data indicated a non-significant increase in FOXP3 expression (P = 0.475) and a significant increase in CD25 expression (P = 0.001) in the non-SGR group compared to the SGR group (Figure 3A and B). To further analyze CD25 expression, the non-SGR group was divided into rejected and non-rejected subgroups. CD25 expression level increased significantly in both subgroups (rejected, P = 0.03; non-rejected, P = 0.01) compared to the SGR group (Figure 4). Although the non-rejected subgroup had a higher CD25 expression level than the rejected subgroup, the difference was not statistically significant. The IL-2 expression level showed a non-significant decrease (P = 0.374) in the non-SGR group compared to the SGR group (Figure 3C).
, CD25, and interleukin-2 (IL-2) fold changes (FCs) between non-stable graft recipients (non-SGR) and SGR recipients with significance levels (P) of ≥ 0.05, 0.001, and ≥ 0.05, respectively")
Comparison of forkhead box P3 (FOXP3), CD25, and interleukin-2 (IL-2) fold changes (FCs) between non-stable graft recipients (non-SGR) and SGR recipients with significance levels (P) of ≥ 0.05, 0.001, and ≥ 0.05, respectively
 group, rejected (P = 0.03), and non-rejected (P = 0.01) subgroups")
Comparison of CD25 fold change between stable graft recipients (SGR) group, rejected (P = 0.03), and non-rejected (P = 0.01) subgroups
The receiver operating characteristic (ROC) curve analysis of the Treg markers is a powerful tool for evaluating the accuracy of a diagnostic test. In the case of non-SGR and SGR patients, the ability of FOXP3, CD25, and IL-2 to differentiate between the two groups was determined by the AUC value (Figure 5). In addition to the AUC value, other essential parameters, such as sensitivity, specificity, cut-off value, and P-value, were also calculated and summarized in Table 3. Out of the three markers, CD25 was found to have the highest AUC (0.8), sensitivity (81.25%), and specificity (94.12%) for discriminating between non-SGR and SGR patients, making it a potentially valuable tool for future studies in this field.
 curves of Treg markers fold change for non-stable graft recipients (non-SGR) versus SGR group: A, forkhead box P3 (FOXP3) with 50% sensitivity and 60% specificity; B, CD25 with 81.25% sensitivity and 94.12% specificity; C, interleukin-2 (IL-2) with 66.67% sensitivity and 58.33% specificity")
Receiver operating characteristic (ROC) curves of Treg markers fold change for non-stable graft recipients (non-SGR) versus SGR group: A, forkhead box P3 (FOXP3) with 50% sensitivity and 60% specificity; B, CD25 with 81.25% sensitivity and 94.12% specificity; C, interleukin-2 (IL-2) with 66.67% sensitivity and 58.33% specificity
| Treg Markers | AUC | Standard Error | 95% CI | P-Value | Sensitivity (95% CI) | Specificity | Cut-off |
|---|---|---|---|---|---|---|---|
| FOXP3 | 0.59 | 0.12 | 0.34 - 0.84 | 0.45 | 50 (21.52 - 78.48) | 60 (35.75 - 80.18) | > 1.235 |
| CD25 | 0.80 | 0.09 | 0.63 - 0.98 | 0.002 | 81.25 (56.99 - 93.41) | 94.12 (73.02 - 99.7) | > 184.7 |
| IL-2 | 0.59 | 0.10 | 0.38 - 0.81 | 0.36 | 66.67 (43.75 - 83.72) | 58.33 (31.95 - 80.67) | < 6.315 |
Abbreviation: FOXP3, forkhead box P3; SGR, stable graft recipients; IL-2, interleukin-2.
5. Discussion
Early post-transplant immune monitoring is an imperative aspect of KTx as it facilitates the detection of high-risk patients for rejection or other graft complications (3, 15-17). Our results showed higher expression levels of FOXP3 in the non-SGR group, which is consistent with some previous research. Studies have shown higher expression levels of FOXP3 in PBMCs and urine cells in acute rejected KTRs, suggesting its effectiveness in diagnosing rejection episodes and correlating with rejection severity (1, 14). Unlike our results, a prospective study in PBMCs of KTRs showed an up-regulation of the FOXP3 gene in recipients without acute rejection compared to those with acute rejection (18). These discrepancies highlight the need for further research to fully understand the role of FOXP3 in KTx.
In the current study, the non-SGR group showed a lower expression level of IL-2, although previous research by Karahan et al. reported up-regulation of IL-2 leading to rejection in some KTRs (19). The higher expression level of CD25 in our research, in the non-SGR group compared to the SGR group, is confirmed by a study that reported higher expression levels of FOXP3 and CD25 in the urinary cells of kidney recipients with acute rejection compared to those with chronic allograft nephropathy and stable grafts (20).
The immunosuppressive regimen (induction therapy and maintenance treatment) is an influential factor in modifying the expression pattern of immune genes such as FOXP3, CD25, and IL-2 (21-23). For instance, thymoglobulin is a purified polyclonal immunoglobulin used as induction therapy to prevent and treat acute rejection post-KTx (22). In vitro studies showed this immunosuppressive drug promoted immune tolerance and Treg proliferation in PBMC cultures by converting CD4 + CD25- into CD4 + CD25 + T-cells and up-regulating FOXP3 and Th2 cytokines [glucocorticoid-induced TNF receptor (GITR), cytotoxic T lymphocyte-associated antigen-4 (CTLA-4)] (22-24). Another study clarified that thymoglobulin pre-treatment can influence immunosuppression and transplant tolerance by increasing the expression of some immune genes such as CTLA-4, OX40, FOXP3, CD25, IFN-γ, IL-10, and IL-2 in CD4 + cells (25).
Calcineurin inhibitors, including cyclosporine and tacrolimus, are maintenance immunosuppressive drugs received by KTRs. The CNIs actively interfere with T-cell activation and function, including the function of Tregs (26). Calcineurin activates the IL-2 gene transcription by dephosphorylating the nuclear factor of activated T-cells (NFAT) and inducing its translocation into the nucleus. The CNIs bind to calcineurin to block NFAT translocation and T effector function, which leads to a reduction in IL-2 transcription (27-29). However, one major side effect of CNIs is decreased in Treg frequency and depletion of immune tolerance in transplanted patients. This may be due to Tregs' reliance on IL-2 and nuclear NFAT for their function, survival, and FOXP3 expression (21, 23, 30).
Given thymoglobulin's role in promoting Treg proliferation and supporting transplant tolerance, the elevated expression levels of FOXP3 and the CD25 receptor as Treg markers observed in this study may be attributable to this effect. Additionally, thymoglobulin reduces the effector T-cell population (22), the main source of IL-2 (13), which may lead to lower IL-2 expression. However, the effect of thymoglobulin on IL-2 expression is complex.It requires further research, as previous studies have shown results with up-regulation of IL-2 in CD4 + T-cells under the influence of thymoglobulin (19, 22). Additionally, the use of CNIs leads to a reduction of IL-2 expression in T-cell lymphocytes (28, 29) by reducing the Treg population size and depleting the immune tolerance responses (21, 23, 30). These changes might result in a reduction in the expression levels of FOXP3 and CD25 receptors.
Our research suggests that higher levels of FOXP3 and CD25 expression in the non-SGR group may be due to a temporary increase in Tregs induced by thymoglobulin, which has a greater impact on Treg proliferation than CNIs. The lower expression of IL-2 in the non-SGR group may be due to the inhibitory effect of CNIs on IL-2 transcription and thymoglobulin's role in depleting the T effector cells. The high CD25 expression compensated for the low IL-2 level, improving FOXP3 signaling in Tregs, enhancing their function, and improving immune tolerance in non-SGR recipients.
Our study was constrained by the number of recipients and the use of flow cytometry to detect the Treg population and markers.
Consequently, the increased suppressive function of Tregs in the first week post-KTx is indicated by higher levels of FOXP3 and CD25 expression in PBMCs of non-SGR compared to SGR groups of KTRs. Therefore, these factors may have the potential for early detection of kidney graft dysfunction before biopsy.
