1. Background
Outdoor air pollution is one of the main concerns that have a serious impact on human health and the environment. Understanding how air pollution affects health and its role in disease progression shows the motivation and necessity of reforming environmental health policies, reassessing economic decisions, and, most importantly, improving the health and quality of life of residents (1). Motor vehicles and industrial processes play an important role in air pollution. Today, the unfavorable state of air quality has become one of the most important environmental problems in many major cities around the world due to its harmful consequences. Harmful air pollutants are also produced in environments that can be harmful to human health (2, 3). Many epidemiological studies have examined the effect of air pollution on human health (4-6). Amongst air pollutants, PM2.5 has been identified as the most prevalent pollutant emitted from vehicles. PM2.5 is related to negative human health consequences due to the sorption of toxic matters at the level of PM2.5 particles such as volatile organic compounds (VOCs) and polycyclic aromatic hydrocarbons (PAHs) (7, 8). Chronic obstructive pulmonary disease (COPD) is a major reason for complications and mortality in both high- and low-income countries. Although smoking is the most important risk factor in the world, outdoor and indoor air pollutants can exacerbate COPD (9). Many epidemiological studies have consistently shown that PM2.5 is related to an increased risk of COPD outcomes. Cortez-Lugo et al. (10) investigated the impact of personal exposure PM2.5 on respiratory health in a panel of Mexican patients with COPD. All participants stayed in Mexico City and were monitored during follow-up, PM2.5 personal exposure, medications, respiratory sign, and daily activities. It has been estimated that an increase in 10 µg/m3 on average per day of two-day personal exposure to PM2.5 is associated with an increase in respiratory symptoms in adults with COPD (10). Huang et al. (11) examined the association of COPD and PM2.5 in non-smokers in Taiwan. The population-based study included 3,941 unauthorized Taiwanese adults employed between 2008 and 2015 in the Taiwan Biobank project. Exposure to PM2.5 at concentrations above 38.98 µg/m3 increases the susceptibility to COPD in Taiwanese non-smokers. Conflict with COPD involves combining tobacco control and pollution management strategies (11).
Therefore, based on the above, it can be said that it is very important to study the time changes of PM2.5 pollutants in urban air quality and its effects on human health. Many models, including BenMAP-CE, AirQ+, TM5-FASST, and IOMLIFET have been studied to health effects assessment of air pollution. AirQ+ software is developed by the World Health Organization (WHO). The software distinguishes hospital reception and mortality from various air pollutants, including PM2.5, carbon black, PM10, O3, and NO2 (12). The air quality index (AQI) and PM2.5 are two significant indexes amongst air pollution indices. AQI is an index of air quality that reflects and assesses the city’s air quality, which simplifies the concentration of several air pollutants, including PM2.5, in a numerical form (13). Ahvaz is one of the most polluted cities in Iran due to its many sources of pollution, including vehicles, factories, and industrial sites. Therefore, there is a need to assess the air quality in this city (14).
2. Objectives
Therefore, the purpose of this study was to estimate the estimation of COPD outcomes attributed to PM2.5 pollutants in the air of Ahvaz city. Also, based on the AQI index, we will assess the air quality of Ahvaz for PM2.5 pollutants.
3. Methods
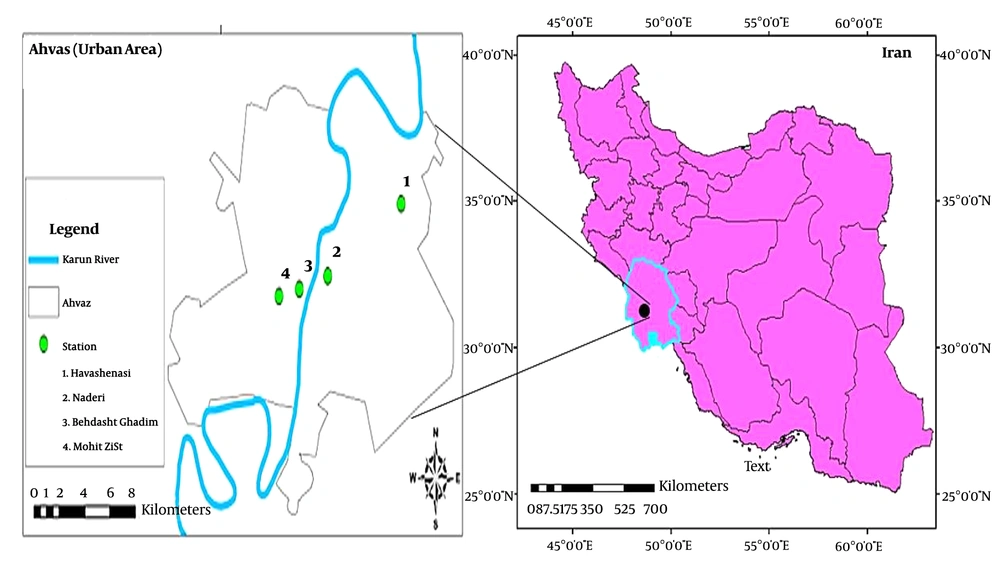
In this descriptive cross-sectional study, estimating the time changes of pollutants, epidemiological, and using the model during the ten-year period (2008 - 2017) in Ahvaz for PM2.5 pollutants. Ahvaz is a city as the capital of Khuzestan Province and the largest city in Southwestern Iran. The city is located at 31 degrees 19 minutes north and 48 degrees 40 minutes east and is about 20 meters above sea level (15). The geographical location of Ahvaz is shown in Figure 1.
3.1. Data Analysis
PM2.5 data from organizations of environmental protection and meteorology and mortality data attributed to COPD outcomes for adults over 30 years were gathered from the Deputy of Health of Khuzestan Province. COPD outcomes of exposure with PM2.5 were surveyed by the AirQ+ model. Data validation was investigated by WHO criteria. Based on this, four stations (Naderi, Mohit Zist, Behdasht Ghadim, and Havashenasi) were elected, including more than 50% of the valid data per year and index of population exposure. After validating the PM2.5 pollutant data, the average of hourly, daily, weekly, monthly, seasonal, and annual for PM2.5 changes was calculated and by entering the annual PM2.5 pollutant data and attributed to population contact, the COPD outcome in AirQ+ software has been applied for ten-years in connection with its health effects. Population contact data per 100,000 population, including the population at risk, BI, and RR for COPD outcomes are shown in Table 1 for the study period. Attributable proportion, the number of cases attributable per 100,000 people at-risk (BE), and the total number of cases attributable to the exposure (NE) are amongst the most important cases in the software output table. Also, their calculation method for COPD outcomes is shown in Equations 1 to 4 (16, 17).
| Year | 2008 | 2009 | 2010 | 2011 | 2012 | 2013 | 2014 | 2015 | 2016 | 2017 |
|---|---|---|---|---|---|---|---|---|---|---|
| Population of at-risk | 545640 | 550460 | 544340 | 560034 | 564446 | 570857 | 574731 | 578295 | 571881 | 585185 |
| BI | 20 | 20 | 20 | 20 | 20 | 20 | 20 | 20 | 20 | 20 |
| RR | ||||||||||
| Lowest | 1.09 | 1.12 | 1.13 | 1.10 | 1.11 | 1.09 | 1.08 | 1.09 | 1.09 | 1.09 |
| Average | 1.22 | 1.27 | 1.29 | 1.23 | 1.25 | 1.22 | 1.19 | 1.21 | 1.21 | 1.21 |
| Highest | 1.37 | 1.44 | 1.46 | 1.37 | 1.40 | 1.36 | 1.32 | 1.36 | 1.36 | 1.36 |
Where AP is the equivalent attributable proportion or proportion of the population in the exposure of pollutants at a certain time; RR (c) is the relative risk of the health effect on the purpose population in the contact category c (Equation 2); and p (c) is the equivalent of the population proportion of the exposure group c.
RR, the elective health outcome, was obtained by contact-response functions from the same epidemiological researches. In this research, we will use the default values of RR in the AirQ+ model.
Where X, X0, and β demonstrate the PM2.5 average concentration in Ahvaz city. Knowing the BI rate and elective health outcome (B), BE is calculated by Equation 3.
Where B demonstrates the number of incidence of health outcomes per 100,000 population at risk, owing to the inability to access hospitals’ data of COPD outcomes, BI values were applied in other same researches. Also, its values were not accessible for the last year, the year that these values were accessible was applied. Finally, NE to the population at risk (N) in the ten-years studied (Table 1), was calculated by Equation 4.
3.2. Mechanisms of PM2.5 on the Human Respiratory System
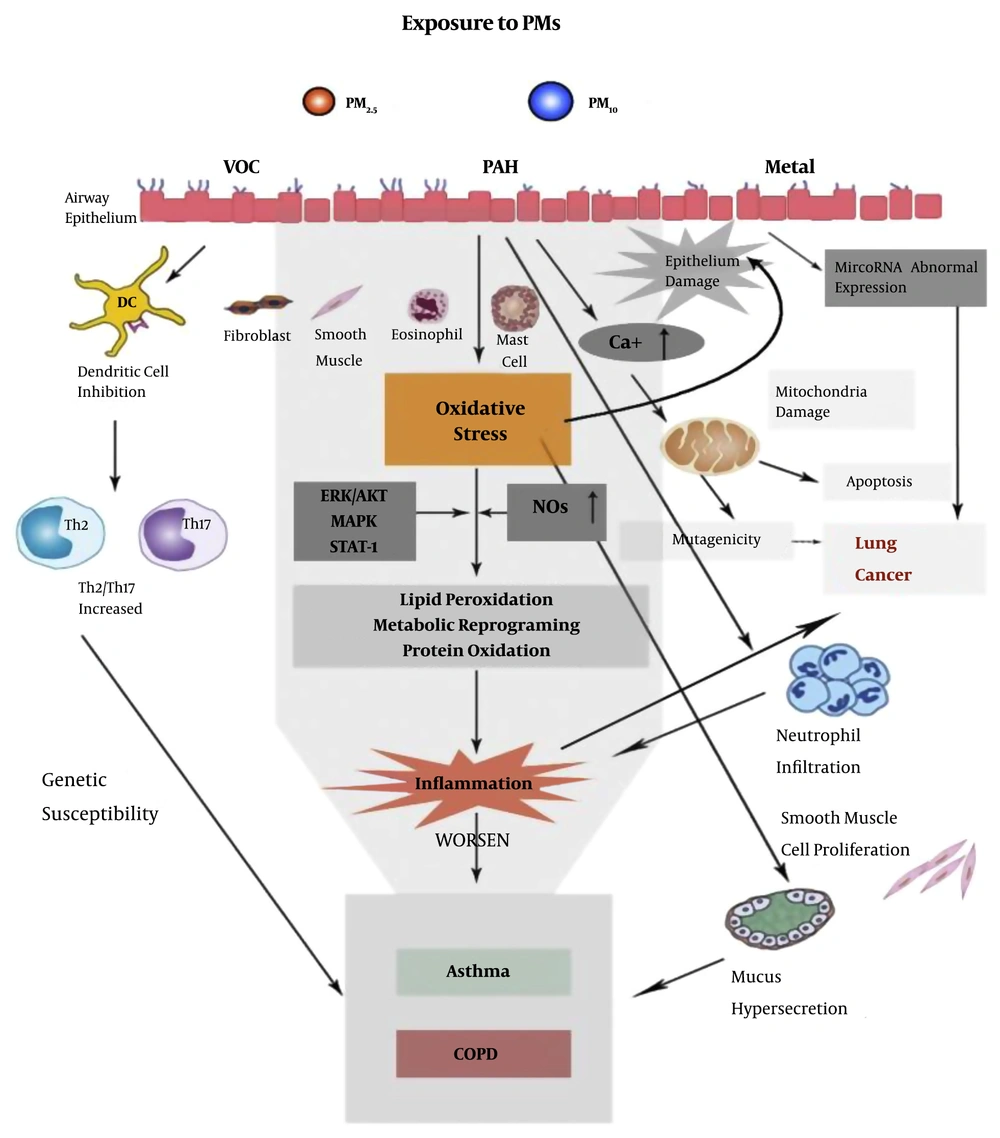
The effects of ambient PM2.5 on mortality in China and other countries have been investigated for decades (18). Current epidemiological data have revealed a robust correlation between fine particle pollutants and respiratory diseases. PM2.5 is known to exacerbate chronic inflammatory lung conditions, including pulmonary hypertension, 31 cardiovascular, and autoimmune diseases. There are several proposed mechanisms of the impact of PM2.5 on human respiratory physiology (18). These include the release of molecular mediators [i.e., extracellular regulated protein kinases (ERK)/protein kinase B (Akt), mitogen-activated protein kinase (MAPK), signal transducers and activators of transcription (STAT)-1] that affect the cells, tissue, and system after PM exposure, and the binding of pathogenic antibodies to pro-inflammatory cell receptors, leading to an exacerbation of chronic inflammation (Figure 2).
The principal route of damage on the human respiratory system after PM2.5 exposures. PM, particulate matter; VOC, volatile organic compounds; PAH, polycyclic aromatic hydrocarbon; ERK, extracellular regulated protein kinases; MAPK, mitogen-activated protein kinase; STAT-1, signal transducers and activators of transcription-1, COPD: chronic obstructive pulmonary disease (18).
4. Results
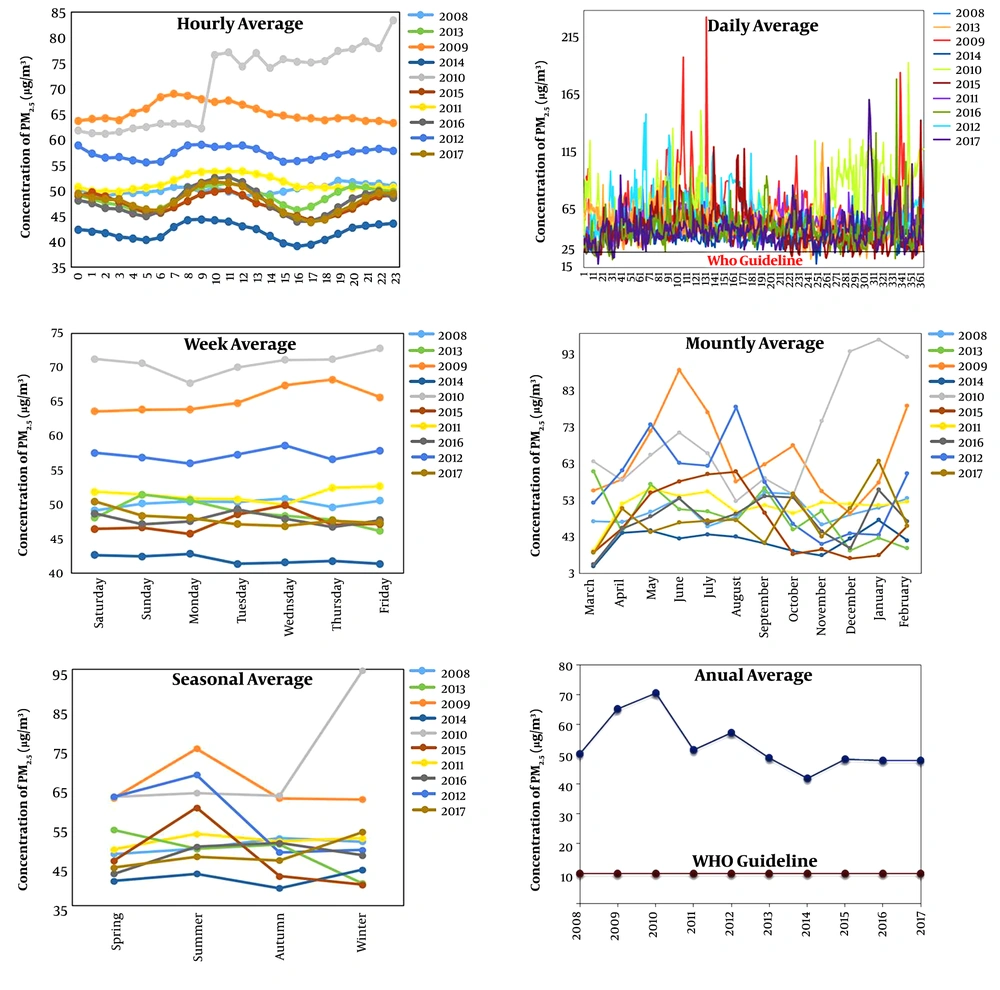
In this research, the PM2.5 time changes and its health effect on COPD outcomes were surveyed by the AirQ+ model in Ahvaz City. The average time of hourly, daily, weekly, monthly, seasonal, and annual for PM2.5 concentrations according to air quality guidelines of WHO was computed, and their results are indicated in Figure 3. The hourly changes average of PM2.5 in Ahvaz was indicated that the maximum concentration was in 2010 (83.35 µg/m3) at 23:00, and the minimum was in 2014 (39.08 µg/m3) at 4 pm. The maximum daily average of PM2.5 concentration was dependent on 2009 (234.19 µg/m3), and the minimum was in 2017 (18.15 µg/m3). According to the average of the weekly change for PM2.5 in Ahvaz City, the maximum concentration of dependent in 2010 (72.85 µg/m3) and the minimum was in 2014 (41.33 µg/m3). The monthly changes average of PM2.5 in Ahvaz were indicated that the maximum monthly concentration of PM2.5 was in February 2010 (97.26 µg/m3), and the minimum was in April 2016 (35.5 µg/m3). According to the average of the seasonal change of PM2.5 in Ahvaz city, the maximum seasonal concentration of PM2.5 was in the winter of 2010 (94.64 µg/m3), and the minimum was in the fall of 2014 (44.439 µg/m3). Also, the average of annual changes of PM2.5 indicated that the maximum annual concentration of PM2.5 was in 2010 (70.72 µg/m3), and the minimum was in 2014 (41.97 µg/m3).
In Table 2 the health effects of PM2.5 pollutants for COPD outcomes are specified in the city of Ahvaz, including attributable proportion, the number of cases attributable per 100,000 people at risk (BE), and the total number of cases attributable to the exposure (NE) the ten-year period by the AirQ+ software. Based on these results, the maximum average of AP was 22.48% in 2010 and the minimum was 7.41% in 2014. The maximum average of BE was 4.5 people in 2010, and the minimum was 3.2 people in 2014. Also, the maximum and minimum average NE were 24 people in 2010 and 18 people in 2014, respectively.
| Year | Attributable proportion (AP) | Attributable cases number per 100000 population of at-risk (BE) | Attributable cases total (NE) | ||||||
|---|---|---|---|---|---|---|---|---|---|
| Lowest | Average | Highest | Lowest | Average | Highest | Lowest | Average | Highest | |
| 2008 | 8.41 | 18.15 | 27.01 | 1.7 | 3.6 | 3.6 | 9 | 20 | 29 |
| 2009 | 10.71 | 21.26 | 30.74 | 2.1 | 4.2 | 4.2 | 12 | 23 | 34 |
| 2010 | 11.5 | 22.48 | 31.85 | 2.3 | 4.5 | 4.5 | 13 | 24 | 53 |
| 2011 | 9.09 | 18.70 | 27.24 | 1.8 | 3.7 | 3.7 | 10 | 21 | 31 |
| 2012 | 9.91 | 20 | 28.73 | 2.5 | 4 | 4 | 11 | 23 | 32 |
| 2013 | 8.26 | 18.03 | 26.89 | 1.6 | 3.6 | 3.6 | 9 | 21 | 31 |
| 2014 | 7.41 | 15.97 | 24.80 | 1.5 | 3.2 | 3.2 | 9 | 18 | 29 |
| 2015 | 8.26 | 17.62 | 26.47 | 1.6 | 3.5 | 3.5 | 10 | 20 | 31 |
| 2016 | 8.26 | 17.95 | 26.47 | 1.6 | 3.6 | 3.6 | 10 | 21 | 31 |
| 2017 | 8.26 | 18.02 | 26.47 | 1.6 | 3.6 | 3.6 | 10 | 21 | 31 |
5. Discussion
In many developing countries, the concentration of air pollutants is much higher than the WHO’s guidelines. In addition, it has been widely suggested that urban air pollution can cause a diversity of diseases. In recent years, despite good measures to control and prevent air pollution, this issue remains a serious threat to human health and the environment (19). Considering the significance of air pollution on human health, in this research, hourly, daily, weekly, monthly, seasonal, and annual changes for PM2.5 pollutants and its effect on the COPD health outcome by the AirQ+ model in Ahvaz city in a period of ten-years was applied.
The average PM2.5 concentration in total time changes studied in the air of Ahvaz City was higher than the standard set (10 µg/m3) by WHO (20). Dust phenomenon is one of the main causes of air pollution due to PM2.5 pollution in Ahvaz City. The city of Ahvaz is close to Iraq, Kuwait, and Saudi Arabia, which are important sources of desert dust, especially in the summer, which is constantly affected by north winds and cyclones. Ahvaz is also affected by dust from the north wind and strong northwest winds, which prevail in the spring and carry large amounts of dust from southern Iraq. The dust has caused considerable problems in multiple aspects of urban life and has also caused economic and environmental problems (including soil turmoil, increased drought, and reduced vegetation cover). Thus, industrial and educational centers have led to the hospitalization of thousands of patients with cardiovascular and respiratory diseases in hospitals (21, 22). Therefore, urban air pollution has been reported by some researchers due to the phenomenon of dust and PM2.5 pollutants in Ahvaz city and many regions of Iran and the world (23, 24). There was a significant relationship between PM2.5, proportion, and cases of attributable to health outcomes of COPD using the AirQ+ model. Accordingly, with increasing annual concentration of PM2.5 over the ten years studied, mortality attributed to this pollutant has increased as a result of the outcome of COPD. In the same research by Jo et al. (25), the epidemiological status of PM2.5 and the risk of COPD-related hospital exposure to particulate matter in Chuncheon, Korea, were investigated. The results indicated that increasing the PM2.5 concentrations and its compounds caused an increase in hospital visitation for COPD in Chuncheon.
5.1. Limitations and Strengths
The major limitations of this study include the limitations of ecological studies, which is the use of aggregated data. Observed trends may not be representing a wider population because of this study had a small sample size. It should be noted that future larger studies are required to verify the observed trends to perform sub-group analyses and further period.
5.2. Conclusions
According to the results of PM2.5 pollutant time changes and health outcomes of COPD in Ahvaz City in the ten-year period, it can be said that the city of Ahvaz needs more attention for reducing the adverse effects of air pollution. As a result, using AirQ+ software to study the health effects of PM2.5 on human health is a safe, useful, and simple way. The results indicate that the authorities should seriously, using short-term and long-term plans, make the necessary efforts to control and reduce the pollution of metropolises and ensure the health of the residents of this city.


