1. Background
Type 2 diabetes mellitus (T2DM) is among the most common forms of chronic metabolic disorders, accounting for about 90% of all people with diabetes. Type 2 diabetes mellitus is associated with a greater risk of cardiovascular diseases (CVD), including coronary artery disease (CAD) with chest pain (angina), heart attack, stroke, atherosclerosis, and hypertension (1). Type 2 diabetes mellitus, along with obesity and insulin resistance, has a pro-inflammatory profile of circulating adipokines and cytokines, leading to the development of CVD (2). In T2DM, close-fitting glycemic control decreases the risk of diabetic complications, but it remains tentative whether the variability of glycemia and its correlates, such as glycated hemoglobin (HbA1c), influences outcomes. Several studies reported that long-term glycemic variability expressed by HbA1c could predict the development of cardiovascular complications (3).
Atherosclerosis-induced vascular complications are the major causes of morbidity and mortality in T2DM patients (4). Carotid Artery Intima-media Thickness (CIMT) measurements are currently performed by ultrasound examination, which offers a high degree of accuracy and precision of the arterial wall thickness estimations (5). This imaging method is a relatively safe, non-invasive, and inexpensive method of assessing sub-clinical atherosclerosis.
Uncontrolled and late-diagnosed vascular atherosclerosis such as carotid artery may increase the risk of cardiovascular complications and their mortality in T2DM patients (6). Globally, several attempts have been made to research in this field, and they have shown that racial/ethnic differences in common CIMT and risk factors associated with CIMT are observed predominantly in middle-aged and older individuals (7, 8). However, it is important to assess the cutoff in the Iranian population, especially in the southwestern region.
2. Objectives
Thus, this study aimed to assess the role of carotid ultrasonography and measure CIMT and its correlation with HbA1c to observe CVD risks in T2DM patients.
3. Methods
3.1. Study Design and Population
In this observational study, 205 consecutive patients with T2DM were included from Golestan Hospital, Ahvaz, Iran, between 2013 and 2017. The study was approved by Ahvaz Jundishapur University of Medical Sciences Ethics Committee (Ethical code: IR.AJUMS.REC.1392.191), and all participants signed informed consent forms before enrollment.
3.2. Inclusion Criteria
We included patients with diabetes, body mass index (BMI) > 25 Kg/m2, age between 30 and 50 years, history of diabetes from 5 to 15 years, systolic blood pressure (SBP), and diastolic blood pressure (DBP) < 140 mmHg and < 90 mmHg, respectively, triglyceride < 200 mg/dL, HDL > 40 mg/dL in males and > 50 mg/dL in females, and no history of smoking.
3.3. Exclusion Criteria
We excluded patients with a history of CVD, smoking, hypertension, age more than 50 years or less than 30 years, diabetes for more than 15 years or less than 5 years, history of radiation therapy, and chemotherapy.
3.4. Data Collection
We collected information including age, sex, weight, height, history of smoking, and hypertension. (BMI) was defined as the person’s body weight divided by the square of the person’s height. Laboratory tests were performed using standard methods. We performed HbA1c measurements using high-pressure liquid chromatography (HPLC) with a thermo-system. The urine albumin was then calculated. Patients were divided into three groups, including normal (< 30 mg), microalbuminuria (30 - 150 mg and 150 - 300 mg), and macroalbuminuria ( > 300 mg).
Carotid Ultrasonography: Carotid arteries ultrasonography was performed with an Aloka SSD 5500 apparatus with a 7.5 MHz transducer. Measurements were done according to the practical protocol defined by Casella et al. in 2008 (9).
3.5. Statistical Analysis
All statistical calculations were done by SPSS 19.0 (SPSS for Windows, version 17.0, Inc., Chicago, IL, USA). Categorical variables were expressed as numbers and percentages, while continuous variables were expressed as mean ± standard deviation (SD). The chi-square (χ2) test was used to compare categorical variables; hence, continuous variables were compared with a Student t-test. Correlation analysis was performed using Pearson or Spearman tests. Levels of statistical significance were set at a P value < 0.05.
4. Results
A total of 205 patients were studied, of whom 120 (58.5%) were females. The mean values of various parameters were expressed between the groups with a CIMT less than and more than 0.7 mm (Table 1). There was no statistically significant difference between the two study groups in the duration of diabetes with CIMT. Besides, creatinine, HbA1c, and urine albumin showed statistically significant differences between the two groups (P = 0.020, P = 0.041, and P = 0.016, respectively). In contrast, the rest variables showed no statistically significant differences (Table 1). The overall mean CIMT was around 0.7 mm, while the mean CIMT was relatively smaller in female patients than in males (0.66 mm vs. 0.69 mm). There was no correlation between age and CIMT (r = 0.19, P = 0.792). There was a non-significant correlation between the duration of diabetes and CIMT (r = 0.125, P = 0.081). Moreover, albuminuria was significantly correlated with CIMT (r = 420, P = 0.000). Furthermore, there was no remarkable association between CIMT and weight (r = 0.12, P = 0.881) and FBS (r = 0.062, P = 0.405). There was also a non-significant negative correlation between HbA1c% and CIMT (r = -0.127, P = 0.127).
| Variable | CIMT < 0.7 mm, N = 99 | CIMT ≥ 0.7 mm, N = 106 | P-Values |
|---|---|---|---|
| Age (y) | 55.57 (10.06) | 57.30 (5.55) | 0.226 |
| Weight (kg) | 75.30 (13.2) | 73.98 (11.4) | 0.546 |
| Diabetes duration | 8.43 (6.73) | 8.87 (5.42) | 0.425 |
| FBS | 163.14 (61.2) | 155.91 (72.2) | 0.223 |
| TG | 179.37 (125.8) | 173.11 (74.6) | 0.080 |
| Cholesterol | 183.41 (58.11) | 164.89 (33.41) | 0.493 |
| LDL | 101.30 (43.12) | 105.12 (34.28) | 0.566 |
| HDL | 45.76 (9.55) | 47.32 (9.57) | 0.727 |
| Cr | 0.83 (0.24) | 1.06 (0.33) | 0.020 |
| HBA1c% | 7.58 (2.02) | 7.38 (11.4) | 0.041 |
| Urine ALB | 36.66 (62.09) | 104.89 (101.83) | 0.016 |
| GFR | 106.23 (35.13) | 103.24 (41.37) | 0.496 |
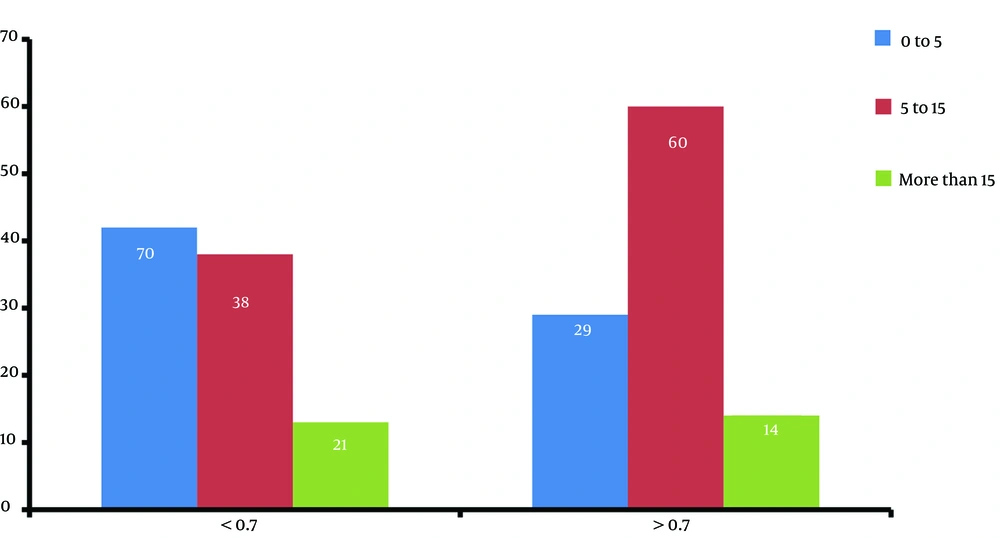
Among those with a diabetes duration of more than 15 years, only 38.5% had increased CIMT; in the group with 5 to 15 years’ diabetes duration, CIMT increased with 56.6% (P = 0.451, Figure 1).
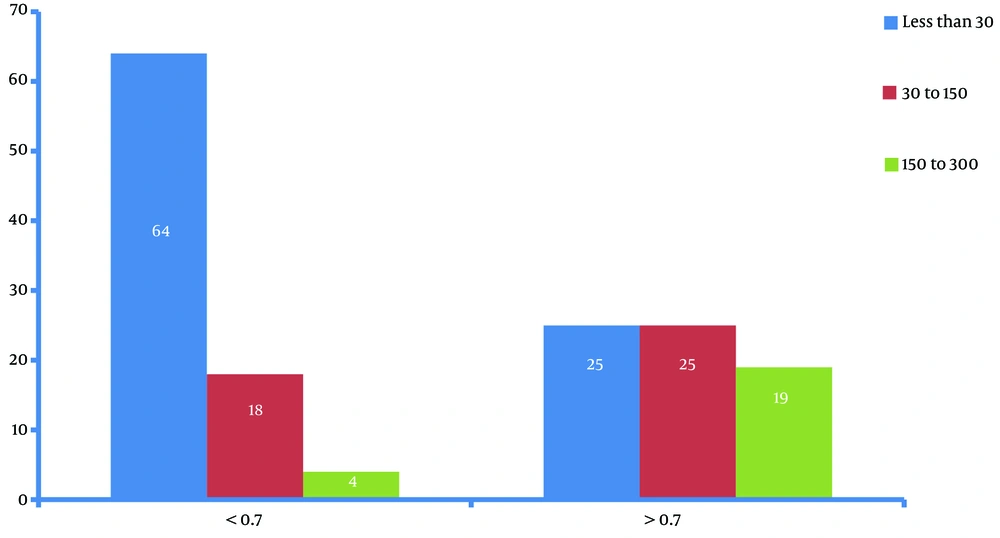
There was a significant difference existed between the two microalbuminuria groups considering the CIMT cutoff (0.7 mm) (22.2% vs. 41.5%, P < 0.001) (Figure 2).
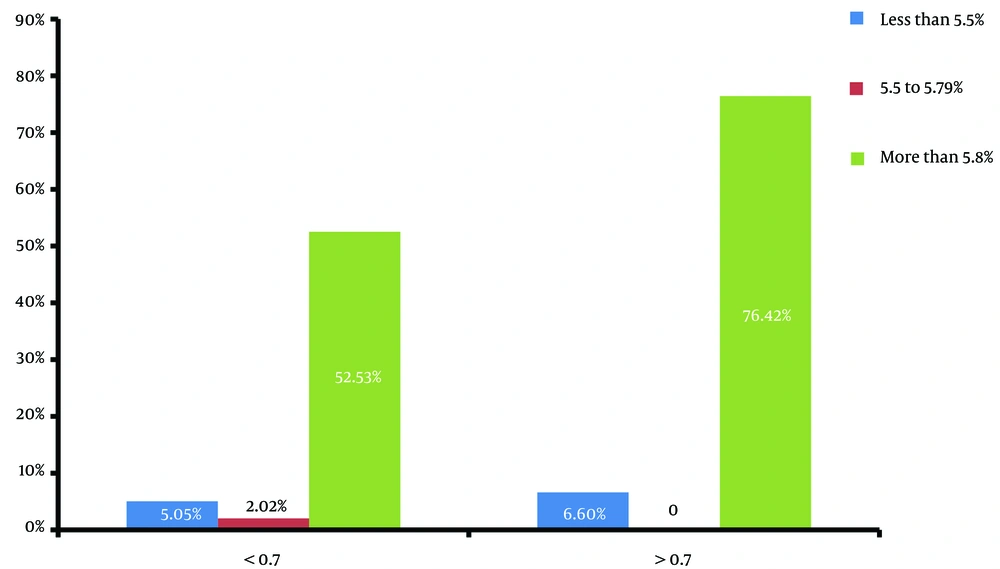
Comparing various HbA1c% values with CIMT showed that increased CIMT (> 0.7 mm) was significantly more prevalent in patients with HbA1C > 5.8% (Figure 3), (76.43 vs. 52.53%, P = 0.006).
Among various variables, the maximum significance was obtained for weight, duration of diabetes, HDL, and Cr with values of 0.012, 0.029, 0.021, and 0.036, respectively (Table 2).
| Variables | Wilk’s Lambda Value | F-Test | P-Value |
|---|---|---|---|
| Duration of diabetes | 0.510 | 4.859 | 0.029 |
| Weight | 0.627 | 5.569 | 0.012 |
| FBS | 0.812 | 2.201 | 0.138 |
| HbA1c | 0.755 | 3.083 | 0.069 |
| LDL | 0.991 | 0.089 | 0.915 |
| HDL | 0.666 | 4.761 | 0.021 |
| Cr | 0.706 | 3.963 | 0.036 |
| Cholesterol | 0.980 | 0.190 | 0.829 |
| TG | 0.975 | 0.242 | 0.787 |
5. Discussion
The CIMT measurement through invasive techniques such as ultrasound can help early diagnose cardiovascular complications such as atherosclerosis, and it may help detect asymptomatic CVD. Thus, an association or an increase in CIMT may increase the risk of cardiovascular complications such as arteriosclerosis. This study aimed to assess the role of carotid ultrasonography and measure CIMT and its correlation with HbA1c to observe the CVD risks in T2DM patients. It showed that the average CIMT in this study was approximately 0.7 mm; whereas, 0.9 mm has been reported in other studies. Besides, the mean CIM in women was less than men, possibly due to female hormones' supportive role, and that males are more prone to arteriosclerosis (10). In the present study, the observed mean CIMT was similarly lower in female patients than in males.
In this study, the association between age and CIMT was not statistically significant. In this context, Drouth et al. (11) and Gayathri et al. (12) reported no association between age and CIMT. But, Dullaart et al. (13) stated that age was an independent predictor positively correlated with CIMT. In this study, we observed a non-significant association between the duration of diabetes and CIMT. At the same time, Gayathri et al. (12) reported greater CIMT values associated with increasing duration of diabetes.
Our findings indicated that weight was significantly correlated with CIMT, and Gayathri et al. (12) confirmed these findings and reported a significant association between BMI and CIMT. De Michele et al.(14) revealed general and central obesity and BMI as independent predictors of CIMT.
The present study showed a significant correlation between FBS and CIMT. Similarly, Mita et al. (15) observed that the level of glycemic control was associated with CIMT. Slyper et al. (16) showed that CIMT was higher in obese adolescents than in normal-weight-matched controls.
The present study showed that HbA1c levels had a significant inverse correlation with CIMT. Haring et al. (17) studied the association between HbA1c and the mean CIMT among 1,798 individuals without diabetes. They reported a positive correlation between HbA1c and the mean CIMT, which may explain the association between high HbA1c levels and the increased risk of cardiovascular diseases and mortality. Larsen et al. (18) considered CIMT as a validated surrogate marker of early atherosclerosis. They assessed the association between CIMT and HbA1c in over 18-year-old patients with diabetes and reported an earlier and more progressive form of atherosclerosis in them than in age- and gender-matched controls.
Bayir et al. studied 50 patients with diabetes and reported a significantly higher CIMT compared to the control group. Diabetes was associated with higher CIMT, especially in a pediatric population, but CIMT was not affected by the mean HbA1c level and median HbA1c level (19). Verdoia et al. (20) evaluated the relationship between HbA1c and CIMT in patients without diabetes mellitus and reported that HbA1c was significantly associated with CIMT. Larsen et al. (18) elucidated the association of CIMT with long-term mean HbA1c and preclinical coronary atherosclerosis using ultrasonography in 39 individuals over 18 years with diabetes. They suggested the crucial role of HbA1c in atherosclerosis development, particularly in females with diabetes, and showed that CIMT reflected preclinical coronary atherosclerosis.
5.1. Limitations
This study, just like other cross-sectional studies, has its limitations. First, it was not possible to determine the frequency of the disease. Second, the results of the study should be considered with caution. Finally, we could not assess a causal relationship between exposure risk factors and CIMT.
5.2. Conclusions
Today, atherosclerosis complications are considered the most common challenges in diabetic management. The ultrasound measurement of CIMT is a safe and relatively cost-effective way of diagnosing atherosclerosis. Thus, the ultrasound's predictive value as a safe and non-invasive examination may alert the experts of the related field early enough to intervene to prevent major cardiovascular complications. Moreover, a healthy lifestyle and reasonable glycemic control can pave the way for significantly reducing such unpleasant events. This may make a considerable change in diabetes-related cardiovascular complications, leading to healthy lives.


