


1. Background
Studies in the field of aging show that the number of menopausal women is increasing (1). Reduced bone density or osteoporosis, commonly found in old-age women, increases bone fracture rates and complications. Osteoporosis is clinically important because it is one of the most important risk factors for fractures. Studies have shown that about 40% of postmenopausal women are affected by osteoporosis, and about 50% may experience osteoporosis fractures throughout their lives. The goal of screening is to find women at increased risk of fracture with minor trauma who benefit from risk reduction. Risk factors of fracture might be found by history and physical examination besides measurement of bone mineral density (1-7). According to a study that was conducted in relation to the risk factors of osteoporosis in postmenopausal women, these risk factors include age, low calcium diet, excessive intake of soft drinks (more than 400 ml daily), family history of osteoporosis in at least one of the close relatives, thyroid disease, excessive coffee intake (more than 2 cups daily), long-term use of steroids, ongoing hormonal replacement therapy, obesity and overweight and prolonged immobilization (8).
The World Health Organization (WHO) has defined osteoporosis based on dual-energy X-ray absorptiometry (DXA) measurements. The relative risk of fracture increases as bone mineral density (BMD) decreases. Clinical risk factors for fracture include advanced age, previous fractures, falls, glucocorticoid drug consumption, a family history of hip fracture, and current smoking (9-13). The main goal of BMD screening is to find and treat asymptomatic osteoporosis to prevent fractures (14). A study confirmed that treating asymptomatic osteoporotic cases reduces fractures (15).
In the present study, we are to assess clinical risk factors for osteoporosis among the Iranian female population in an osteoporosis predictive model. This study can provide a new model with higher sensitivity and specificity than the previous models in Iran for screening women at risk of osteoporosis. And according to the stated complications, this new model can reduce the risk of developing these complications. The average age of screening in the female population with specific characteristics depends on the influence of different risk factors in each population, and the results of this type of study might guide the determination of the target population for screening.
2. Methods
This prospective diagnostic value study was conducted in referral tertiary Imam Hossein Medical Center, screening outpatient clinic, Shahid Beheshti University of Medical Sciences over two years period.
All of the 317 asymptomatic 50 or more years old, menopausal women enrolled in screening BMD by DXA method in these two years. The data was collected with the census method. Patients who were unable or rejected to participate in the study were excluded. Even cases with pre-study diagnosed diseases related to osteoporosis remained in the study. Osteoporosis is diagnosed if, in BMD, the T-score is below 2.5.
Demographic data were completed. All known osteoporosis risk factors asked, including: Age, education, body mass index (BMI), menopause age, parity, nursing, activity level, active and passive smoking, family history of osteoporosis, history of fracture, history of bilateral oophorectomy, history of calcium-vitamin D and dairy product intake, corticosteroids or hormone replacement therapy in drug history, history of infertility, oligomenorrhea, thyroid or other metabolic diseases, liver disease, chronic kidney disease or cardiac disease.
Bone density of the femur and lumbar spine according to standard curves clarified osteoporosis status for each person, and the result was recorded in the questionnaire.
The results are expressed as a mean ± standard deviation (SD) and/or number (percent). In the first step, univariate analysis with osteoporosis as the main outcome used the chi-squared, independent sample t-test. In the next step, factors with a P-value of less than 0.2 were included in the multivariate logistic model, and a predictive model was constructed. The goodness of fit test was applied to assess the model building. The area under the curve (AUC) was calculated for the model, and the best cut-point for risk of menopause according to the Youden index was determined. The sensitivity and specificity of different probabilities were calculated with the Youden method. The significance level was set at 0.05 for statistical analysis. Statistical analyses did use the program SSPS version 17.0 (SPSS, Inc., Chicago, IL, USA).
2.1. Ethical Consideration
The study followed the principles of the Declaration of Helsinki and was approved by the Medical Ethics Review Board of Shahid Beheshti University of Medical Sciences. The study had been approved ethically under the code of 2031. All information about the subjects was kept fully confidential, and all information was released as a group without the participants’ names. Study participants did not incur any costs, and the study protocol did not harm participants. Written informed consent was obtained from volunteers, and the details and purpose of the study were disclosed.
3. Results
In the present study, 317 cases were studied. The mean age of the population was 55.23 ± 5.70 years old, ranged 50 - 86 years old. Ninety-nine (%31.2) of these asymptomatic women revealed osteoporosis in the BMD test, and 80 (%25) were healthy (normal femur and spine); others were osteopenia. Statistically significant items or P value of < 0.2 were included in the multivariate analysis and predictive model construction (Tables 1 and 2).
| Variables | Osteoporosis | P Value | |
|---|---|---|---|
| Negative (n = 218) | Positive (n = 99) | ||
| Age | 53.88 ± 4.87 | 58.21 ± 6.29 | < 0.001 |
| BMI | 29.66 ± 4.71 | 27.67 ± 4.80 | 0.001 |
| Menopause age | 49.11 ± 4.55 | 46.91 ± 6.08 | 0.003 |
| Menarche age | 13.69 ± 1.99 | 13.58 ± 1.78 | 0.887 |
| Education | 0.098 | ||
| ≤ 12 years | 175 (80.3) | 87 (87.9) | |
| Academic | 43 (19.7) | 12 (12.1) | |
| Lactation | 203 (93.5) | 81 (81.8) | 0.001 |
| Smoker | 12 (5.5) | 8 (8.1) | 0.382 |
| Passive smoker | 53 (24.3) | 22 (22.2) | 0.685 |
| family history of osteoporosis | 38 (17.4) | 29 (29.3) | 0.017 |
| Fracture history | 13 (6) | 8 (8.1) | 0.482 |
| History of oophorectomy before 50 years old | 6 (2.8) | 3 (3) | 0.572 |
| Calcium usage | 71 (32.6) | 34 (34.3) | 0.756 |
| Vitamin D usage | 24 (11) | 7 (7.1) | 0.274 |
| Croton usage | 4 (1.8) | 2 (2) | 0.608 |
| Thyroid hormone usage | 24 (11) | 14 (14.1) | 0.426 |
| History of HRT | 7 (3.2) | 6 (6.1) | 0.187 |
| History of infertility | 1 (0.5) | 3 (3) | 0.092 |
| History of oligomenorrhea | 7 (3.2) | 1 (1) | 0.228 |
| History of cardiac disease | 19 (8.7) | 11 (11.1) | 0.500 |
| History of chronic kidney disease | 5 (2.3) | 6 (6.1) | 0.089 |
| History of metabolic bone disease | 6 (2.8) | 1 (1) | 0.301 |
| History of hyperthyroidism | 2 (0.9) | 1 (1) | 0.676 |
| History of hypothyroidism | 17 (7.8) | 7 (7.1) | 0.820 |
| History of malabsorption | 2 (0.9) | 0 (0) | 0.472 |
| history of eating disorder | 1 (0.5) | 0 (0) | 0.688 |
| History of RA | 1 (0.5) | 0 (0) | 0.688 |
| History of DM | 3 (1.4) | 0 (0) | 0.324 |
| Exercise | 0.150 | ||
| No | 180 (82.6) | 90 (90.9) | |
| Swimming | 7 (3.2) | 2 (2) | |
| Other | 31 (14.2) | 7 (7.1) | |
| Parity | 0.061 | ||
| ≤ 2 | 56 (25.7) | 34 (36.2) | |
| > 2 | 162 | (74.3) | 60 (63.8) |
a Values are expressed as mean ± standard deviation or No. (%).
| Variables | Coefficient | Standard Error | P Value | Odds Ratio (95% CI) |
|---|---|---|---|---|
| Age | 0.149 | 0.031 | < 0.001 | 1.16 (1.09 - 1.23) |
| BMI | -0.088 | 0.034 | 0.009 | 0.916 (0.857 - 0.979) |
| Menopause age | -0.097 | 0.029 | 0.001 | 0.907 (0.856 - 0.961) |
| Family history of osteoporosis | 0.963 | 0.365 | 0.008 | 2.62 (1.28 - 5.35) |
| Parity ≤ 2 | -0.800 | 0.343 | 0.020 | 0 .450 (0.229 - 0.881) |
Age and family history of osteoporosis were risk factors, and BMI, parity, and menopause age were protective factors of osteoporosis.
3.1. A Predictive Model of Osteoporosis
(Age 0.149) + (family history 0.963) - (BMI 0.088) - (menopause age 0.097) - (parity 0.80)
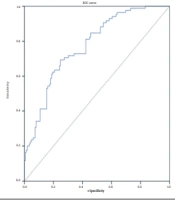
In this model, the sensitivity and specificity of different probabilities are available. Optimal cutoff = 0.3360 in the Youden method was chosen with a sensitivity of 69.4% (58.5% - 79%) and specificity of 75.2% (67.4% - 81.9%). As shown in the Roc curve (Figure 1), the area under the curve was equal to 0.775 (0.715 - 0.835) in the prediction of osteoporosis.

ROC curve of fitted logistic regression model
In more than 59.5 years old women, 61.3% and below this age cutoff, 23.8% of BMD tests revealed osteoporosis (P = 0.044). Considering menopause age, in more than 59.5 years old women with menopausal age after 48.5, osteoporosis was shown in 50% and menopausal age before 48.5 in 75% (P = 0.012). With consideration of BMI, 52.5-59 years old women, if BMI was equal to or less than 21.7 in 100% (all cases) and if BMI was more than 21.7 in 30 % of women, osteoporosis was positive in BMD test (P = 0.020).
4. Discussion
Due to available and effective prevention and treatment modalities, the diagnosis of osteoporosis is substantial. The present study’s predictive model of osteoporosis was based on age, family history, parity, menopausal age, and BMI. BMD test in Iran in women more than 50 years old might be able to find a positive osteoporotic cut of at least 23.8% and more if the menopausal age is less than 48.5 or the case is thin (BMI below 21.7). The model of osteoporosis probability constructed in the present with a cutoff point of more than 0.3360 can predict women at risk of osteoporosis with 69.4% sensitivity and 75.2% specificity.
Clinical risk factor assessment alone may be considered for fracture prediction in world regions without access to BMD measurement (risk assessment) technologies (16). For example, the Fracture Risk Assessment Tool (FRAX website) model allows estimation of the 10-year probability of hip fracture and major osteoporotic fracture with clinical risk factors alone when BMD is not known. The country-specific FRAX prediction algorithms are available for many countries online. FRAX is one of the Fracture Risk Assessment models, along with some other models (17). However, most have not been validated in diverse populations. However, risk assessment is an attractive alternative to BMD, but most societies offer both BMD and clinical risk assessment to evaluate fractures (18, 19).
Different studies have concluded that various ages for starting screening for BMD. In the study by Arab et al., the proper age for BMD screening was 56.5 years or older (2). In another study, the age at which the screening was done was 70 or older (20). The National Osteoporosis Foundation (NOF) suggests screening for all women older than 65 (21). The current status of BMD screening in South Korea is the conduction of the test in 54 - 66 years old (22). Schousboe et al. combined age and weight to provide a threshold based on them for the BMD test (12). In their study, the appropriate age for the BMD test was as follows: 55 years old for women under 74 kg, 65 years old for women under 90 kg, and 80 years old for women under 100 kg. Another study suggested a BMI cutoff equal to 31.8 as the threshold for the BMD exam in postmenopausal women (12, 13, 16-21, 23). Other guidelines prefer the BMD exam for women 65 years or older. Notably, most guidelines have been developed for Western countries, whereas the ethnic and racial differences in the Asian population ask for an assessment protocol based on these discrepancies. In a study on Korean women, the minimal age for osteoporosis assessment was 50, and besides BMD, BMI was measured to conclude the patient’s condition (24). The risk factors for osteoporosis include BMD, a history of fragility fracture, and positive family history (25).
It is important to note that each individual’s characteristics are responsible for different complications developing in osteoporosis patients. Because osteoporosis is a substantial cause of bone fracture in postmenopausal women, early prevention and diagnosis of the disease in the elderly can reduce the risk of fracture and further complications. On the other hand, adequate intake of calcium and vitamin D and lifestyle changes might prevent the progression of osteoporosis and reduce the probability of bone fracture in the case of an osteoporosis diagnosis. There are available treatment modalities and drugs for osteoporosis (21). Many studies are done to find appropriate tools to select women for screening, though there is no approved method (26). All studies agree that screening and treating cases reduce fractures and is part of healthcare improvement (26). Finding at-risk women might improve their outcomes even at 40 (27).
4.1. Conclusions
BMD test in Iran in more than 50 years old might find positive osteoporotic cases in at least 23.8%. A model of osteoporosis probability constructed based on age, family history, menopause age, and parity in the present study can predict women at risk of osteoporosis. This model in regions with different characteristics of osteoporosis, such as Iran, might be used to identify appropriate candidates by clinical risk factors, for BMD tests, especially in poor resource settings.
This study was performed in Tehran and relatively poor population. If the study was designed in a broader geographical region, for instance, in multi-centers and different cities, a generalization of results was more possible. The lack of a large sample size of the population could mention as another potential limitation.
