1. Background
During the last days of 2019, the outbreak of COVID-19 commenced in Wuhan in Hubei Province, China. The COVID-19 pandemic is one of the greatest challenges the world has faced during the last decades; the disease has not only been a heavy burden to the health system, but also it has affected the societal, economic, personal and interpersonal, sports-related, educational, industrial, and even political aspects of the human life (1, 2). While we have learned a great deal from the novel coronavirus SARS-CoV2 to date and its causes, evidence shows that mortality is higher in the elderly and close to zero in children (3).
This pandemic has some relatively unique features, including its very rapid rate of progression possibly due to the durability of the virus on surfaces, relatively very low involvement of children, increased mortality in the elderly and immune-compromised patients, and the determining role of the immune system in the final outcome (4, 5). At the beginning of the epidemic, demographers introduced the young age structure as a safe pattern in terms of mortality. Countries are unable to develop human and economic capital infrastructure and are at risk of all kinds of internal conflicts because more than half of the world's population is under the age of 25. However, the results of studies show that so far, during the corona virus epidemic, the elderly population of countries are structurally more endangered than other age patterns (6). In the age-related mortality pattern, the areas with the most elderly people are at higher risk of more severe illness or death than the areas with younger populations (3). What has been confirmed to date is that the risk of COVID-19-related mortality rises with age. Therefore, if the population of people infected with COVID-19 in one country is more than other countries, the CFR will be higher, even if the specific risk of death is the same for all age groups (7).
However, the role of the median age of the population on the nation-specific and worldwide outcome and mortality has not been defined yet; in other words, could the age-composition of a country or a specific society affect the trend of the outbreak, disease mortality, and the outcome in COVID-19 pandemic? The worldwide estimates of COVID-19-related age-specific mortality rates have grown by leaps and bounds since reporting began two months ago. Yet, the relationship between these rates has remained almost constant. By applying these age-related rates to individual countries, one can account for the differences that might be observed relative to a similar level of infection throughout the world (6, 8). In this article, we sought to summarize regional differences in population age structures among countries in the context of unequal age- and sex-specific death risks associated with the spread of the COVID-19 pandemic. Also, this study was designed and implemented to find the effects of the age-composition of the countries on global mortality and the final outcome of the COVID-19 outbreak.
2. Methods
This is an observational ecological study, which examines the relationship (or correlation) between an exposure and a given outcome measured in populations. Unlike other types of studies, this study does not examine individuals, and the unit under study is population groups instead of individuals. Ecological studies are generally involved in both hypothesizing and testing hypotheses (9, 10). In an ecological study (with cross-sectional design) for information on COVID-19 deaths, the World Health Organization Report No. 70 of March 30, 2020 (Monday, April 11) was used. This information included the total number of confirmed infections, the total number of deaths, the number of new infections, and deaths during one day leading up to the reporting date.
The COVID-19 case-fatality rate (CFR) is defined as the ratio of deaths (D) associated with COVID-19 divided by the number of detected COVID-19 cases (N): CFR = D/N. In our application, the death and case counts are cumulative counted up to a certain date. If case counts and death counts are available by age, which is our situation, the CFR can also be written as the sum of age-specific CFRs weighed by the proportion of cases in a certain age group (7). We use a as an index to denote different age groups. The proportion of deaths for each age group was estimated through dividing the number of deaths by the total number of deaths in the country.
The 2019 World Population Outlook report was also used for demographic and major age groups.
The method used in this study is to calculate the correlation coefficient between age composition pattern and COVID-19 deaths in selected countries. The selected countries were those countries with more than 1000 formal COVID-19 reports in the WHO report, leading to recruitment of 42 countries (Table 1). Data entry and analysis were performed using SPSS, version 16.0. Pearson correlation test was used to examine the relationship between exposure and outcome. A level of 90% was considered statistically significant.
| Country | Total Population | Below 15 Years Age | Percentage Between 15 - 49 Years | Percentage Between 50 - 64 Years | Percentage Above 65 Years | Total Confirmed Cases | Total Deaths |
|---|---|---|---|---|---|---|---|
| United States of America | 331,003 | 18.4 | 46.0 | 19.0 | 16.6 | 122,653 | 2,112 |
| Italy | 60,462 | 13.0 | 41.3 | 22.4 | 23.3 | 97,689 | 10,781 |
| China | 1,439,324 | 17.7 | 49.5 | 20.8 | 12.0 | 82,447 | 3,310 |
| Spain | 46,755 | 14.4 | 44.3 | 21.4 | 20.0 | 78,797 | 6,528 |
| Germany | 83,784 | 14.0 | 41.3 | 23.0 | 21.7 | 57,298 | 455 |
| France | 65,274 | 17.7 | 42.3 | 19.3 | 20.8 | 39,642 | 2,602 |
| Iran (Islamic Republic of) | 83,993 | 24.7 | 55.1 | 13.6 | 6.6 | 38,309 | 2,640 |
| The United Kingdom | 67,886 | 17.7 | 44.4 | 19.3 | 18.7 | 19,526 | 1,228 |
| Switzerland | 8,655 | 15.0 | 44.5 | 21.5 | 19.1 | 14,274 | 257 |
| Netherlands | 17,135 | 15.7 | 43.0 | 21.3 | 20.0 | 10,866 | 771 |
| Belgium | 11,590 | 17.0 | 43.6 | 20.1 | 19.3 | 10,836 | 431 |
| Republic of Korea | 51,269 | 12.5 | 47.8 | 23.9 | 15.8 | 9,661 | 158 |
| Turkey | 84,339 | 23.9 | 52.4 | 14.6 | 9.0 | 9,271 | 131 |
| Austria | 9,006 | 14.4 | 44.3 | 22.1 | 19.2 | 8,813 | 86 |
| Portugal | 10,197 | 13.1 | 43.1 | 21.1 | 22.8 | 5,962 | 119 |
| Canada | 37,742 | 15.8 | 45.6 | 20.5 | 18.1 | 5,655 | 61 |
| Israel | 8,656 | 27.8 | 46.5 | 13.2 | 12.4 | 4,247 | 15 |
| Norway | 5,421 | 17.3 | 46.3 | 18.9 | 17.5 | 4,102 | 22 |
| Australia | 25,500 | 19.3 | 46.7 | 17.8 | 16.2 | 3,966 | 16 |
| Brazil | 212,559 | 20.7 | 53.8 | 15.9 | 9.6 | 3,904 | 114 |
| Sweden | 10,099 | 17.6 | 43.6 | 18.5 | 20.3 | 3,700 | 110 |
| Czech | 10,709 | 15.8 | 45.5 | 18.6 | 20.1 | 2,829 | 16 |
| Ireland | 4,938 | 20.8 | 47.4 | 17.2 | 14.6 | 2,615 | 46 |
| Malaysia | 32,366 | 23.4 | 55.9 | 13.5 | 7.2 | 2,470 | 34 |
| Denmark | 5,792 | 16.3 | 43.6 | 20.0 | 20.2 | 2,395 | 72 |
| Luxembourg | 626 | 15.6 | 50.0 | 20.1 | 14.4 | 1,950 | 21 |
| Chile | 19,116 | 19.2 | 51.1 | 17.4 | 12.2 | 1,909 | 6 |
| Japan | 126,476 | 12.4 | 40.1 | 19.0 | 28.4 | 1,866 | 54 |
| Poland | 37,847 | 15.2 | 46.8 | 19.3 | 18.7 | 1,862 | 22 |
| Ecuador | 17,643 | 27.4 | 52.6 | 12.4 | 7.6 | 1,835 | 48 |
| Romania | 19,238 | 15.5 | 45.2 | 20.1 | 19.2 | 1,760 | 40 |
| Pakistan | 220,892 | 34.8 | 51.6 | 9.2 | 4.3 | 1,625 | 18 |
| Russian Federation | 145,934 | 18.4 | 46.3 | 19.9 | 15.5 | 1,534 | 10 |
| Thailand | 69,800 | 16.6 | 48.9 | 21.6 | 13.0 | 1,524 | 9 |
| Philippines | 109,581 | 30.0 | 52.8 | 11.6 | 5.5 | 1,418 | 71 |
| Saudi Arabia | 34,814 | 24.7 | 60.2 | 11.6 | 3.5 | 1,299 | 8 |
| Indonesia | 273,524 | 25.9 | 53.3 | 14.5 | 6.3 | 1,285 | 114 |
| South Africa | 59,309 | 28.8 | 54.4 | 11.3 | 5.5 | 1,280 | 1 |
| Finland | 5,541 | 15.9 | 42.1 | 19.4 | 22.6 | 1,218 | 11 |
| Greece | 10,423 | 13.7 | 43.1 | 20.9 | 22.3 | 1,156 | 38 |
| India | 1,380,004 | 26.2 | 54.4 | 12.8 | 6.6 | 1,071 | 29 |
| Iceland | 341 | 19.4 | 46.6 | 18.3 | 15.6 | 1,020 | 2 |
2.1. Ethical Considerations
In the present study, no intervention was performed on individuals in the community, only the reports of the World Health Organization were examined. According to the research ethics statement, the publication of information that has been made available to the public in advance and in a correct manner does not require informed consent (13).
3. Results
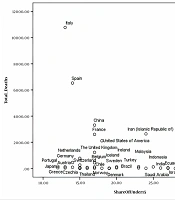
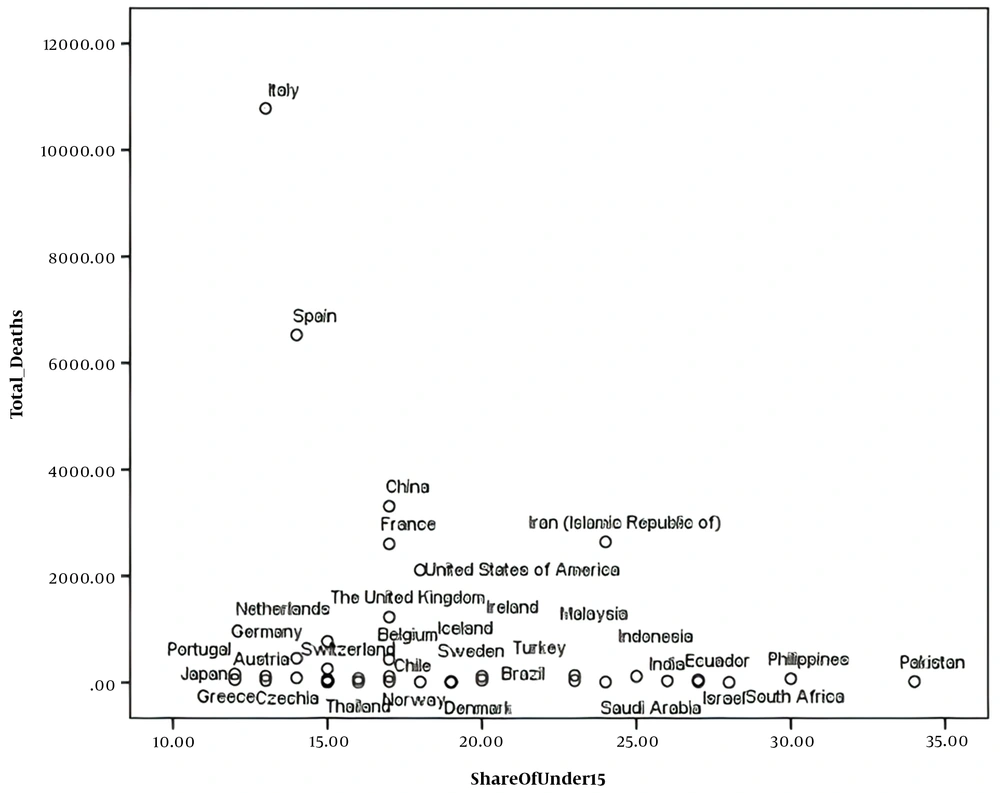
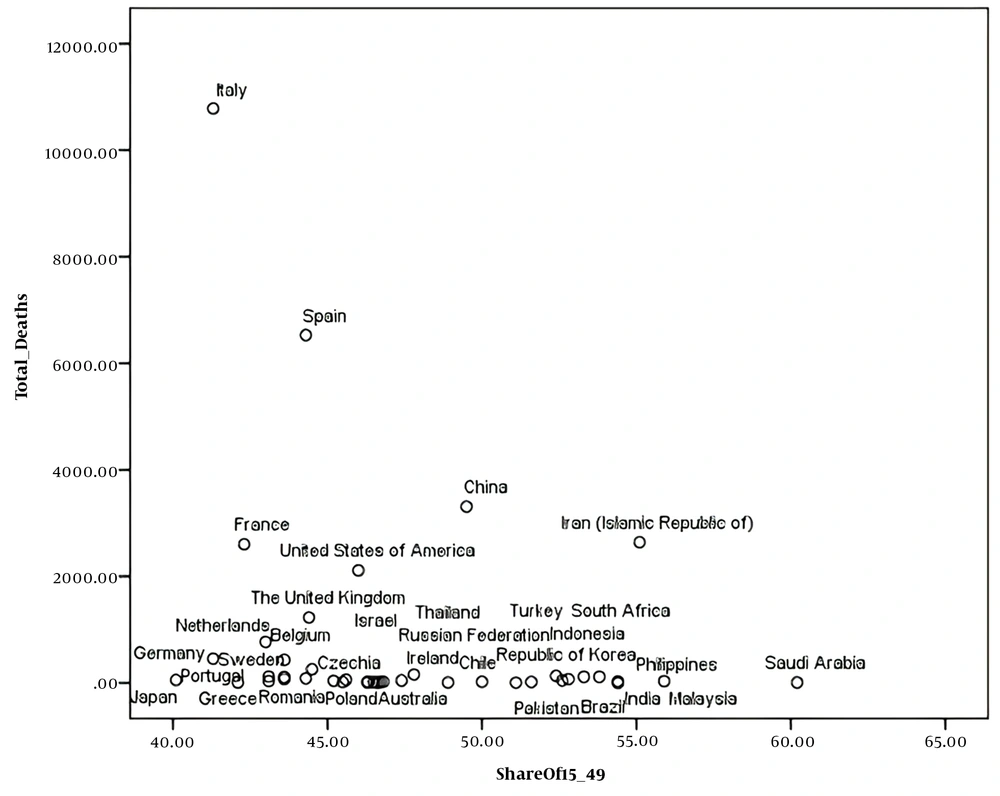
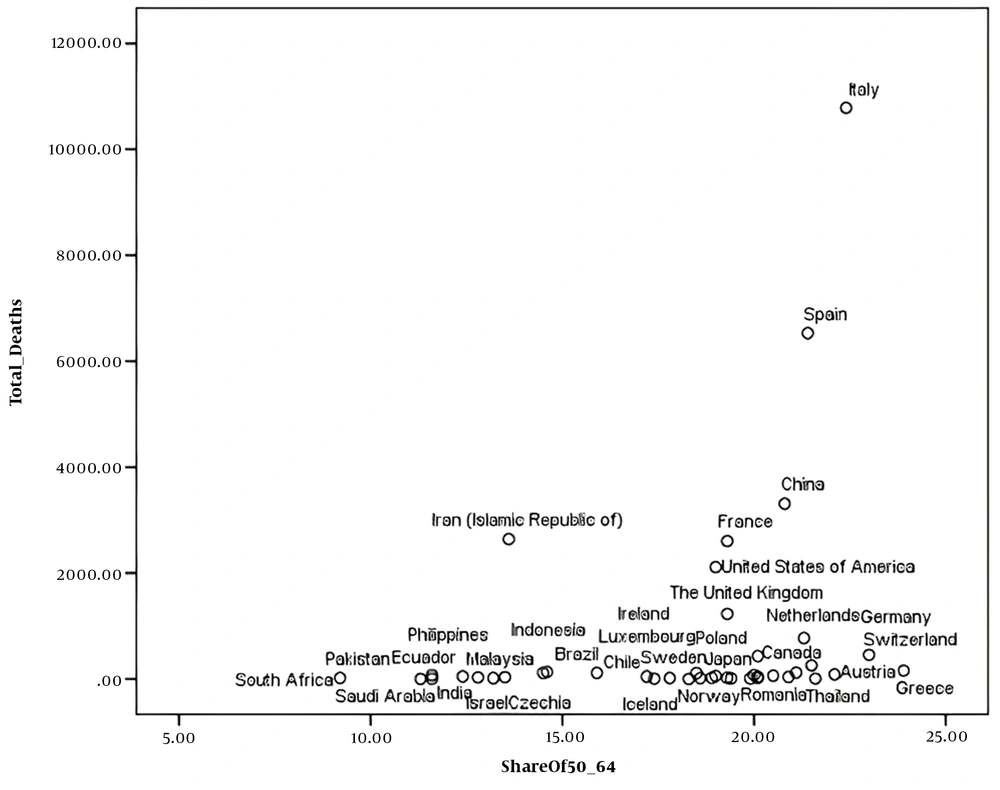
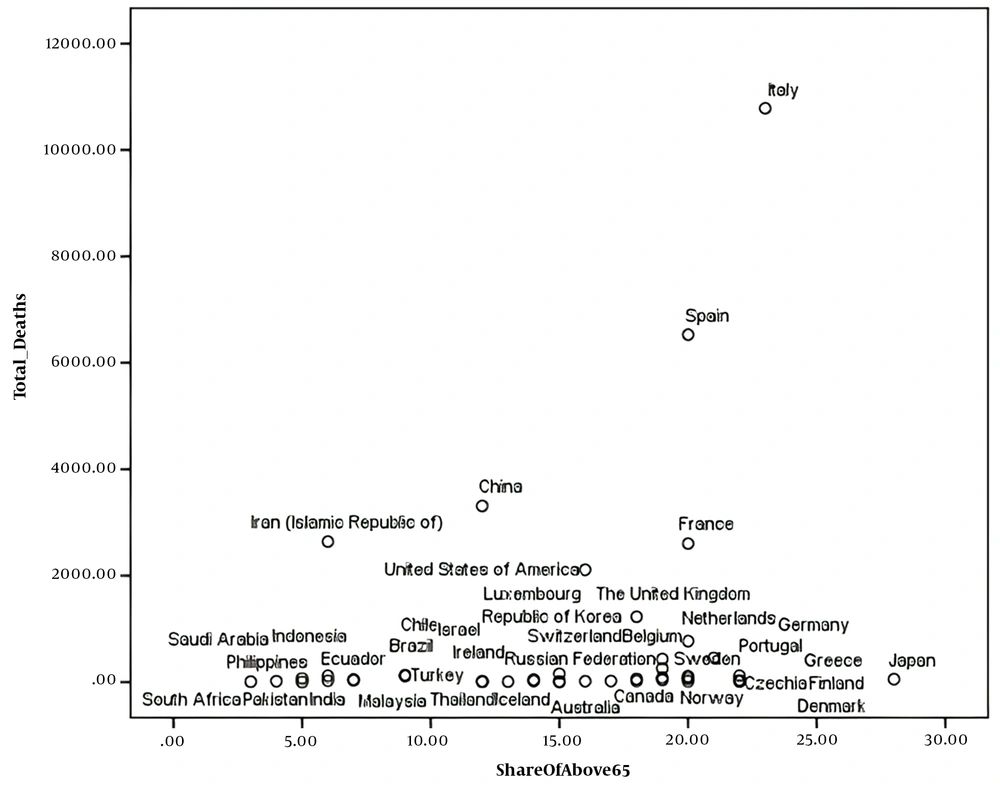
The scatter plot of the number of deaths caused by COVID-19 in the population share of under 15 years, the population share of 15 - 49 years, the population shares of 50 - 64 years and 65 years, or older age group are visible in Figures 1 - 4.
Based on the above scatter plots, Pearson, Kendall, and Spearman correlation coefficients between COVID-19 deaths and the following variables was calculated: (1) country population percentage under 15 years; (2) country population percentage between 15 to 49 years; (3) country population percentage between 50 to 64 years; (4) country population percentage 65 years and over.
The correlation coefficient between COVID-19-attributed death and country population percentage under 15 years was negative at the significance level of 85.2%; also, the correlation coefficient between COVID-19-attributed death and country population percentage between 15 to 49 years was negative at the significance level of 86.1%. The two latter analyses demonstrate that those countries with higher country population percentage under 49 years had lower COVID-19-attributed death rates.
The correlation coefficient between COVID-19-attributed death and country population percentage between 50 to 64 years was positive at the significance level of was 90.8%, which means that the latter two variables had a positive relationship.
The correlation coefficient of COVID-19-attributed death with country population percentage 65 years and over was not significant, with a significance level of 83.8, which means that we could not prove that countries with higher country population percentage 65 years and over had more COVID-19-related deaths.
4. Discussion
Various factors affect the prevalence and outbreak of COVID-19 in a country, including population health conditions, the effectiveness and efficiency of government response, and the availability of care resources. Age structure (the share of the total population in each age group) alone cannot determine which countries will suffer the most during a pandemic. However, it can provide a good understanding of how to respond to a crisis. If the age-specific mortality rates of two countries is the same in terms of COVID-19 virus, the country with the highest elderly population will have more deaths per 1,000 people (3, 14). The available statistics show that the majority of deaths due to COVID-19 in the elderly are in the United States, Italy, Spain, France, and the United Kingdom (15). Using population pyramids, Dowd et al. (2020) showed how the age structure of the population correlates with the high mortality rate of COVID-19 (16). By keeping the prevalence of infection constant at 10% and using only age-specific mortality rates (17), they exhibited that the mortality rate of COVID-19 varies among communities due to age structure. It is worth noting that this calculation is not an epidemiological prediction. Rather, it provides a demographic perspective on the role that age population structures alone can play in the spread of the disease, assuming that other factors remain constant.
This study demonstrated a positive relationship between COVID-19-attributed death and the country population share of the 50 - 64 years age group. In other words, the only age range that could affect the nationwide mortality rate is the age range of 50 - 64 years. The correlation between COVID-19-attributed death and population share of below and above 15 years (divided at the age of 15) has been examined in previous studies, which have claimed the lower rate of COVID-19 incidence in the population below 15 years of age. The findings of Cincotta in New York City showed that deaths per million residents in the population aged 75 and older have remained about 74 to 76 times the rates among 18 to 44-year-olds over the past month. The elderly are more at risk of death than the young population (6), which is consistent with the results of the present study. The study of Medford and Trias-Llimós revealed that a higher share of deaths was observed in the 80 - 89 age group than in the other countries, except for China (18). In contrast, Onder et al. showed that in China, 17% of the population is 60 years of age and older, and only 1% of the population is 85 years of age or older. The death toll from COVID-19 in the age group of 85 years and older has been reported to be six times higher than the overall rate. As a result, if China's share of the elderly was higher, the death rate would be much higher than it is today (14). Medford and Trias-Llimós indicated that deaths in China occur at slightly younger ages than in Europe, and they are split slightly more evenly across the older ages, with 30% of deaths in age bands 60 - 69 and 70 - 79 and 20% of deaths at ages above 80. Above age 80, the proportion of deaths is 50, 58, 59, and 59% for Italy, the Netherlands, Spain, and France, respectively. These differences between the countries persist after adjustment for age structure (18).
On the other hand, age-specific incidence rate (ASIR) has been demonstrated to work as an efficient epidemiological index in epidemiological studies, which could save money, time, and effort (19, 20). Besides, age-specific mortality rate (ASMR) has been used as a critical index in studying the characteristics of previous pandemics (21-23). In this study, we could not retrieve the required data to calculate ASIR and ASMR, which is one of the shortcomings of the study.
Based on the results of this study, the young population is protective against COVID-19-related death, and they are productive and responsible for community needs during this pandemic crisis.
Cincotta exhibited that people who are less likely to die from the coronavirus are usually young people who seem likely to exhibit fewer symptoms (6). Also, according to recent studies, low CFRs in low- and middle-income countries show the distribution of young population, and high CFRs in some countries, such as Italy, is due to high elderly population and mortality in this age group (14, 24). Nowadays, any level of planning for communities is critical to be aware of their age structure. Population structure is literally equivalent to the composition of a population, and in terms of terminology, is the set of elements and features and relatively stable relationships of a population that have evolved over time (25-27).
Population aging and the increasing share of the elderly in the population is one of the most critical social changes in the 21st century, and its consequences affect almost all sections of the society (28). Population aging has been one of the major concerns of the last century around the world. The importance of addressing the issue of population aging, which has increasingly emerged around the world, is not hidden from anyone (25, 29). The global population aging, which is now accelerating, has significant effects in cultural, economic, social, political, and medical areas, which should be fully considered. Issues such as lack of social support, lack of job and social role, living expenses, and especially high health care costs are among the numerous factors that show the need to pay special attention to old age (30-32).
Elderly people are also more vulnerable to disease. In fact, as people grow older, their risk of chronic and epidemic diseases surges. Increasing health costs of the world's elderly communities can lead to some critical challenges, especially in providing health care for the elderly (32, 33).
4.1. Conclusions
In addition to numerous economic and social challenges, the Coronavirus pandemic has highlighted the importance of social and demographic inequalities in health. Given that statistics indicate an increase in coronavirus mortality in elderlies, this affects the age structure of societies, especially those whose age pyramid is old, because the elderly are more susceptible to underlying diseases. We recommend authorities to support the policy of encouraging the total fertility rate and even change policies of United Nations agencies and non-governmental organizations regarding family planning and young population growth. Future studies are suggested to examine the relationship between exposure and outcome to examine the age pyramid structure of populations. In addition, data by age and sex should be included in regular mortality statistics. It is also necessary to compare and identify the best policy practices to ensure consistency in data and metrics across countries.
