


1. Background
Medical care imposes a high cost on patients and their families. High healthcare costs can increase patients' out-of-pocket (OOP) payments in suboptimal insurance coverage. When households share a high percentage of their healthcare cost in OOP, they are more likely to come upon impoverishment and catastrophic health expenditure (CHE) (1-4). Therefore, factors contributing to the OOP and, consequently, CHE are important for health policymakers looking for ways to decrease them. To this end, countries worldwide have conducted different healthcare plans; for instance, Vietnam launched a healthcare system reform focusing on promoting social insurance in 1992 (5). Colombia performed healthcare reform to reduce healthcare financing through out-of-pocket payments and to decrease financial barriers to access in 1993 (6). Since 2003, Turkish health policymakers conducted a program with the purpose of financial protection and enhancement of equity (7, 8). Besides, health policymakers in Iran decided to implement the health sector evolution plan (HSEP) on 5 May 2014 to reduce OOP payments for inpatient services and eradicate informal payments (9).
Heart disease is a major source of health loss and death worldwide, and coronary atherosclerosis, as a major representative of heart problems, is the most expensive state treated (10, 11). The majority of cases of coronary atherosclerosis involve patients who underwent percutaneous coronary intervention (PCI) or cardiac revascularization (coronary artery bypass graft (CABG)) during their hospitalization (12).
2. Objectives
This study aimed to determine CHE and OOP payment of heart disease patients who underwent CABG or PCI in Shiraz public and public-private partnership (PPP) hospitals after the HSEP.
3. Methods
3.1. Study Design
This cross-sectional study with two prospective follow-ups was conducted in hospitals F, K, and A, some of Shiraz's main heart surgery centers. Since we aimed to determine CHE and OOP, certain hospitals were selected among many Shiraz hospitals where heart surgery and heart care activities are performed. Hospitals F and A represent public (governmental) teaching hospitals, and hospital K represents PPP, non-teaching hospitals.
3.2. Study Population
All patients hospitalized in the hospitals from May 2019 to January 2021 comprised our study population. After receiving an ethical approval code for research and coordination with the Treatment Deputy and the Security Center, Health Policy Research Center (HPRC) investigators visited the mentioned hospitals daily in particular periods. The eligibility criteria were as follows:
(1) Families of admitted patients undergoing CABG surgery with stable conditions and the ability to speak intending to participate in the study.
(2) Families of patients undergoing PCI with stable conditions intending to participate in the study.
Families of patients with unstable conditions were not included in this inquiry.
3.3. Data Collection
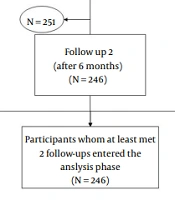
In this research, CHE and OOP were asked from the most informed family member, who was aware of the household expenditures and financial affairs, besides the state of the members' insurance and jobs and their health service usage. The word 'household' is used since the mentioned factors involve the whole family. The world health survey (WHS) is a valid, reliable, and comparative instrument developed by the World Health Organization to help countries monitor their health system performance (13-15). The initial part of this questionnaire gathered demographic information. The patient was reminded that the study is prospective and (s)he will be called several times. Three valid phone numbers were taken. Afterward, the main part of the questionnaire again from the most informed family member, three, six, and nine months later prospectively (via a telephone call). The flowchart of the study is found in Figure 1.

Flowchart of the study
3.4. Study Variables
The study variables regarding the household included economic status based on household total expenditure, having health insurance or not, household head (father, mother, or others), having a member aged ≥ 65 years, having a member aged ≤ 5 years, the number of household members, having a disabled member, expenditure on dentistry service in the previous month, expenditure on inpatient service in the previous year, expenditure on outpatient service in the previous month, type of intervention (CABG or PCI), and hospital's category (public and PPP).
3.5. Catastrophic Health Care Expenditure Definition
According to Xu et al., we considered healthcare expenditure catastrophic if it was equal to or higher than 40% of the household capacity to pay and defined a second variable to capture this. Capacity to pay was defined as effective income (measured by total expenditure) minus basic subsistence needs adjusted for household size. Xu et al. have explained the methodology in detail (1, 13, 14, 16).
Another factor that must be considered is the amount spent on outpatient services, inpatient expenses besides the mentioned surgeries, and dentistry since they increase the percentage of CHE facing.
3.6. Statistical Analysis
In this research, generalized estimating equation (GEE) modeling, which is an extension of the generalized linear model and quasi-likelihood procedure, was employed to identify the main factors related to CHE and OOP (17, 18). Binary distribution with logit link and gamma distribution with log link were used for CHE and OOP, respectively. Moreover, the socioeconomic status (SES) variable was created using latent class analysis (LCA) in Mplus (ver. 7.0) (19-21). The number of owned cars, access to Wi-Fi internet, number of rooms, number of TVs, and ownership of dishwasher and microwave were used to construct SES clusters. Akaike information criteria (AIC), Bayesian information criteria (BIC), and the Bootstrap Likelihood Ratio Test (BLRT) were used to determine the optimal number of clusters. The optimal model was chosen based on the lower values for AIC and BIC and the significant P-values for BLRT. Costs in Iranian Rials were converted to the purchasing power parity adjusted US Dollars using the World Bank's data (world economic outlook database 2020). The significance level was set at 0.05.
4. Results
According to the AIC, BIC, and BLRT measures, the model with two clusters was selected to build the SES variable (Appendix 1). We named the clusters poor and middle/rich based on the frequency of assets in clusters. The frequency of assets in poor and middle/rich clusters is provided in Appendix 2. The patient characteristics based on hospital groups are represented in Table 1. The frequency of CHE and descriptive statistics of OOP based on the type of operation (PCI and CABG) are presented in Table 2.
| Subgroups | Qualitative Variables | |
|---|---|---|
| PPP Hospital | Public Hospitals | |
| Catastrophic health expenditure | ||
| Baseline | ||
| No | 6 (3.7) | 47 (55.3) |
| Yes | 155 (96.3) | 38 (44.7) |
| After three months | ||
| No | 77 (47.8) | 39 (45.9) |
| Yes | 84 (52.2) | 46 (54.1) |
| After six months | ||
| No | 67 (41.6) | 26 (30.6) |
| Yes | 94 (58.4) | 59 (69.4) |
| After nine months | ||
| No | 62 (38.5) | 22 (25.9) |
| Yes | 99 (61.5) | 63 (74.1) |
| Gender | ||
| Male | 108 (67.1) | 64 (75.3) |
| Female | 53 (32.9) | 21 (24.7) |
| Breadwinner | ||
| No | 45 (28.0) | 17 (20.0) |
| Yes | 116 (72.0) | 68 (80.0) |
| Informed person | ||
| Other | 98 (60.9) | 40 (47.1) |
| Father | 63 (39.1) | 45 (52.9) |
| Marital status | ||
| Unmarried | 28 (17.4) | 12 (14.1) |
| Married | 133 (82.6) | 73 (85.9) |
| Employment | ||
| Unemployed | 49 (30.4) | 23 (27.1) |
| Employed | 36 (22.4) | 34 (40.0) |
| Disabled or retired | 76 (47.2) | 28 (32.9) |
| Education | ||
| Illiterate | 27 (16.8) | 19 (22.4) |
| Diploma or under diploma | 119 (73.9) | 58 (68.2) |
| Academic | 15 (9.3) | 8 (9.4) |
| Ethnicity | ||
| Persian | 110 (68.3) | 65 (76.5) |
| Other | 51 (31.7) | 20 (23.5) |
| Province | ||
| Fars | 116 (72.0) | 74 (87.1) |
| Other | 45 (28.0) | 11 (12.9) |
| Complementary insurance | ||
| No | 29 (18.0) | 53 (62.4) |
| Yes | 132 (82.0) | 32 (37.6) |
| Operation | ||
| PCI | 148 (91.9) | 48 (56.5) |
| CABG | 13 (8.1) | 37 (43.5) |
| Habit | ||
| Never smoked | 113 (70.2) | 50 (58.8) |
| Ex-smoker | 13 (8.1) | 6 (7.1) |
| Current smoker | 20 (12.4) | 18 (21.2) |
| Hookah | 9 (5.6) | 6 (7. 1) |
| Opium | 6 (3.7) | 5 (5.9) |
| Surgical history | ||
| No | 38 (23.6) | 28 (32.9) |
| Yes | 123 (76.4) | 57 (67.1) |
| Other health problems | ||
| Without health problems | 30 (18.6) | 25 (29.4) |
| One health problem | 55 (34.2) | 29 (34.1) |
| Two or three health problems | 59 (36.6) | 27 (31.8) |
| More than three health problems | 17 (10.6) | 4 (4.7) |
| House care | ||
| Yes | 3 (1.9) | 2 (2.4) |
| No | 158 (98.1) | 83 (97.6) |
| Socioeconomic status | ||
| Poor | 107 (66.5) | 64 (75.3) |
| Middle/rich | 54 (33.5) | 21 (24.7) |
| Quantitative Variables | ||
| Out-of-pocket (baseline) | 89386600 R/2911.81 $ ± 94866800 R/3090.33 $ | 13861900 R/651.56 $ ± 15793200 R/514.47 $ |
| Out of pocket (after three months) | 21372400 R/696.21 $ ± 68300000 R/2224.90 $ | 29163100 R/950 $ ± 87382200 R/284651 $ |
| Out of pocket (after six months) | 22246300 R/724.68 $ ± 72080500 R/2348.05 $ | 24312100 R/791.98 $ ± 51088300 R/1664.22 $ |
| Out of pocket (after nine months) | 20429500 R/665.50 $ ± 61645100 R/2008.11 $ | 15700000 R/511.43 $ ± 16853900 R/549.02 $ |
| Age | 61.16 ± 9.58 | 58.49 ± 10.59 |
| Number of family members | 3.70 ± 1.55 | 3.41 ± 1.26 |
| Admission duration (days) | 1.40 ± 1.15 | 2.13 ± 2.78 |
Patient Characteristics Based on Hospital Groups (N = 246) a
| PCI | CABG | |||
|---|---|---|---|---|
| PPP Hospital | Public Hospitals | PPP Hospital | Public Hospitals | |
| Catastrophic health expenditure | ||||
| Baseline | ||||
| No | 5 | 25 | 1 | 22 |
| Yes | 143 (95.56%) | 23 (47.92%) | 12 (92.31%) | 15 (40.45%) |
| After three months | ||||
| No | 68 | 24 | 9 | 15 |
| Yes | 80 | 24 | 4 | 22 |
| After six months | ||||
| No | 61 | 13 | 6 | 13 |
| Yes | 87 | 35 | 7 | 24 |
| After nine months | ||||
| No | 52 | 14 | 10 | 8 |
| Yes | 96 | 34 | 3 | 29 |
| Out-of-pocket | ||||
| Baseline | 76953100 R/2506.78 $ ± 53247600 R/1734.52 $ | 15083800 R/491.36 $ ± 18637600 R/607.13 $ | 230937700 R/7522.89 $ ± 248295200 R/8088.32 $ | 12276800 R/399.92 $ ± 11131900 R/362.63 $ |
| After three months | 21827000 R/711.02 $ ± 70934400 R/2310.72 $ | 25874400 R/842.87 $ ± 80267700 R/2614.75 $ | 16196900 R/527.62 $ ± 22992900 R/749.00 $ | 33429500 R/1088.98 $ ± 96808100 R/3153.56 $ |
| After six months | 18308900 R/596.42 $ ± 43173300 R/1406.39 $ | 20721300 R/675.00 $ ± 24378000 R/794.12 $ | 67073100 R/2184.93 $ ± 209936300 R/6838.76 $ | 28970500 R/943.73 $ ± 72626900 R/2368.85 $ |
| After nine months | 21070300 R/686.37 $ ± 63983000 R/2084.27 $ | 16177700 R/527.00 $ ± 19462500 R/634.00 $ | 13134600 R/427.87 $ ± 21360400 R/695.82 $ | 15080300 R/491.25 $ ± 12944800 R/421.68 $ |
The Frequency of Catastrophic Health Expenditures and Descriptive Statistics of Out-of-pocket Based on Operation Type a
4.1. Generalized Estimating Equation
The results of the GEE model for CHE are displayed in Table 3. According to Table 4, patients admitted to hospital K (a PPP hospital) and hospital A (a public hospital) had higher odds of having CHE compared to hospital F (a public hospital). Patients with middle or rich SES had a lower chance of CHE than poor ones. Moreover, the results of the GEE model for OOP are illustrated in Table 4. As observed, patients admitted to hospitals K and A paid significantly more OOP than those admitted to hospital F. In addition, an increase in admission duration was associated with higher OOP payments. On the contrary, an increase in participants' age was linked to lower OOP payments. In addition, current smoker patients spent significantly less OOP than non-smokers.
| Variables (Reference) | Odds Ratio | Std. Err. | P > z | 95% Confidence Interval | |
|---|---|---|---|---|---|
| Admission duration | 0.979 | 0.050 | 0.682 | 0.886 | 1.082 |
| Age | 0.998 | 0.012 | 0.856 | 0.975 | 1.021 |
| Number of family members | 0.930 | 0.064 | 0.287 | 0.813 | 1.063 |
| Hospital (hospital F) | |||||
| Hospital K a | 3.463 | 1.622 | 0.008 | 1.383 | 8.673 |
| Hospital A a | 3.221 | 1.520 | 0.013 | 1.278 | 8.120 |
| Informed person (other) | 0.756 | 0.168 | 0.209 | 0.488 | 1.170 |
| Father | |||||
| Breadwinner (no) | 1.562 | 0.536 | 0.194 | 0.797 | 3.060 |
| Yes | |||||
| Sex (female) | 0.879 | 0.462 | 0.806 | 0.314 | 2.462 |
| Male | |||||
| Job (unemployed) | |||||
| Employed | 0.711 | 0.362 | 0.504 | 0.262 | 1.929 |
| Disabled or retired | 0.831 | 0.399 | 0.699 | 0.324 | 2.129 |
| Education (illiterate) | |||||
| Diploma or under diploma | 0.782 | 0.238 | 0.418 | 0.431 | 1.419 |
| Academic | 0.684 | 0.318 | 0.414 | 0.276 | 1.700 |
| Ethnicity (other) | |||||
| Fars | 1.073 | 0.229 | 0.742 | 0.706 | 1.631 |
| Marital status (unmarried) | |||||
| Married | 1.221 | 0.357 | 0.494 | 0.689 | 2.165 |
| Complementary insurance (not have) | |||||
| Have | 0.959 | 0.240 | 0.867 | 0.587 | 1.566 |
| Operation (CABG) | 1.449 | 0.384 | 0.162 | 0.861 | 2.437 |
| PCI | |||||
| Habits | |||||
| Ex-smoker | 0.693 | 0.241 | 0.292 | 0.350 | 1.371 |
| Current smoker | 0.747 | 0.203 | 0.284 | 0.438 | 1.274 |
| Hookah | 1.128 | 0.467 | 0.771 | 0.501 | 2.541 |
| Opium | 0.981 | 0.463 | 0.968 | 0.389 | 2.474 |
| Surgical history (not have) | |||||
| Have | 1.081 | 0.234 | 0.719 | 0.708 | 1.651 |
| Other health problems (without) | |||||
| One health problem | 0.882 | 0.231 | 0.630 | 0.528 | 1.473 |
| Two or three health problems | 0.784 | 0.222 | 0.390 | 0.451 | 1.365 |
| More than three health problems | 0.620 | 0.255 | 0.246 | 0.277 | 1.389 |
| House care (no) | |||||
| Yes | 1.841 | 1.301 | 0.387 | 0.461 | 7.351 |
| Socioeconomic status (poor) | |||||
| Middle/rich a | 0.515 | 0.110 | 0.002 | 0.339 | 0.782 |
The Results of Generalized Estimating Equation Modeling for Catastrophic Health Expenditure
| Variables (Reference) | Exp(b) | Std. Err. | P > z | 95% Confidence Interval | |
|---|---|---|---|---|---|
| Admission duration a | 1.077 | 0.036 | 0.024 | 1.010 | 1.149 |
| Age a | 0.983 | 0.007 | 0.026 | 0.969 | 0.998 |
| Number of family members | 0.963 | 0.042 | 0.386 | 0.883 | 1.049 |
| Hospital (hospital F) | |||||
| Hospital K a | 5.302 | 1.606 | 0.000 | 2.929 | 9.601 |
| Hospital A a | 2.641 | 0.809 | 0.002 | 1.449 | 4.814 |
| Informed person (other) | |||||
| Father | 0.877 | 0.125 | 0.357 | 0.664 | 1.159 |
| Breadwinner (no) | |||||
| Yes | 0.980 | 0.213 | 0.926 | 0.640 | 1.500 |
| Sex (female) | |||||
| Male | 1.465 | 0.500 | 0.263 | 0.751 | 2.858 |
| Job (unemployed) | |||||
| Employed | 0.980 | 0.324 | 0.950 | 0.512 | 1.875 |
| Disabled or retired | 0.972 | 0.304 | 0.926 | 0.526 | 1.793 |
| Education (illiterate) | |||||
| Diploma or under diploma | 0.781 | 0.145 | 0.183 | 0.543 | 1.124 |
| Academic | 0.868 | 0.257 | 0.631 | 0.486 | 1.550 |
| Ethnicity (other) | |||||
| Fars | 1.194 | 0.164 | 0.196 | 0.912 | 1.564 |
| Marital status (unmarried) | |||||
| Married | 1.017 | 0.191 | 0.927 | 0.704 | 1.469 |
| Complementary insurance (not have) | |||||
| Have | 0.878 | 0.138 | 0.410 | 0.645 | 1.196 |
| Operation (CABG) | |||||
| PCI | 0.765 | 0.133 | 0.124 | 0.545 | 1.076 |
| Habits | |||||
| Ex-smoker | 0.923 | 0.209 | 0.724 | 0.592 | 1.439 |
| Current smoker a | 0.607 | 0.108 | 0.005 | 0.428 | 0.860 |
| Hookah | 0.608 | 0.155 | 0.051 | 0.369 | 1.003 |
| Opium | 1.027 | 0.305 | 0.930 | 0.574 | 1.837 |
| Surgical history (not have) | |||||
| Have | 1.119 | 0.155 | 0.416 | 0.853 | 1.468 |
| Other health problems (without) | |||||
| One health problem | 1.191 | 0.198 | 0.294 | 0.860 | 1.649 |
| Two or three health problems | 1.104 | 0.198 | 0.581 | 0.777 | 1.569 |
| More than three health problems | 0.964 | 0.256 | 0.892 | 0.573 | 1.622 |
| House care (no) | |||||
| Yes | 1.756 | 0.751 | 0.188 | 0.759 | 4.059 |
| Socioeconomic status (poor) | |||||
| Middle/rich | 0.791 | 0.111 | 0.093 | 0.601 | 1.040 |
The Results of Generalized Estimating Equation Modeling for Out-of-pocket Payment
5. Discussion
This study aimed to determine the proportion of patients facing CHE and estimate the OOP payments among the households of patients who underwent PCI and CABG in Shiraz, Iran, during 2019 - 2021 in public and PPP hospitals. We found that OOP payment among PPP hospitals was 76953100 R/2506.78 $ (SD = 53247600 R/1734.56 $) in the PCI group and 230937700 R/7522.89 $ (SD = 248295200 R/8088.32 $) in the CABG group. This value in public hospitals was 15083800 R/491.36 $ (SD = 18637600 R/607.13 $) in the PCI group and 12276800 R/399.92 $ (SD = 11131900 R/362.63 $) in the CABG group. Our results showed that admission duration, age, type of hospital, and being currently a smoker significantly impacted OOP payment.
During baseline assessment, we found that the percentage of PCI patients that faced CHE was 95.56% and 47.92% in PPP and public hospitals, respectively. This value in the CABG patients was 92.31% and 40.45%. Our study showed that the type of hospital and SES were significant factors that push a family facing CHE.
We estimated the OOP payments among households of patients who underwent CABG and PCI in different hospital types. A study conducted in 2016 compared OOP costs in 8 Asian countries and showed that OOP payments had a broad range across countries. For example, in Malaysia, mean OOP costs were 69 US$ for ST-elevation myocardial infarction (MI), while in China, this value was 4047 US$ (22). Another study during 2018 - 2019 in Iran showed that the direct medical costs of CABG were about 183,907,460 Rials, and PCI was about 122,508,920 Rials in Tehran Heart Center, which is different from our finding (23). It could be due to the type of hospitals the study has not mentioned and different medical services prices in both cities (Tehran vs. Shiraz). In another study, OOP costs were estimated to be 16 million Rials per year for cardiovascular patients in 2015 (24).
Our results showed that admission duration, age, types of hospital, and being a smoker significantly affected OOP costs. The longer the duration of stay, the higher the OOP costs. Other studies confirmed our findings (25-27). When a patient's hospital stay is prolonged, their medical costs increase. In our study, age was inversely associated with OOP expenditure. In contrast, a study from Bangladesh found that age group was significantly associated with higher OOP costs (28). One explanation for this result is that we analyzed the data of households for OOP, and the age variant is only for the patients who underwent the procedure.
Our study showed that types of hospitals have an association with OOP expenditures. The PPP hospital has a 5.3 times higher chance of having more patients with OOP costs. That is because the insurance coverage for PPP hospitals is lower than that for public hospitals. Implementing the "health system reform" in Iran significantly reduced the proportion of OOP expenses for patients undergoing operations in public hospitals. The costs are now covered by the Ministry of Health in Iran (29). Hospital A is also a public hospital, and our results showed that patients' OOP was about 2.6 times higher in this hospital than in hospital F. Another study by Maharlou et al. showed the same results that hospital types have a significant effect on OOP (29). One explanation is the possibility of severity of the disease. Severe patients may be referred to hospital A, so the OOP expenditures differ. Another explanation is the possible effect of hospital A being a teaching center for cardiologist residents, which may affect the OOP expenditures. However, we recommend further investigations and research.
We found that being a current smoker was an independent predictor of less OOP. This was also correct for the hookah; however, it was non-significant. No previous research has assessed "being a smoker" and its impact on OOP. The possible explanations need more investigations with a larger sample size and on the difference of the elasticity of demand for healthcare compared to the cigarette in households of current smokers compared to the normal population. As mentioned before, we analyzed the variables on a household level, and "being a current smoker" is a characteristic specific to the patient only.
We estimated the proportion of patients who underwent CABG and PCI that faced CHE. Worldwide, a cross-sectional study performed in Ibadan, Nigeria, in 2022 found that catastrophic OOP payments ranged between 3.9% and 54.6% (30). Also, in another study, CHE was reported by 66% of those without insurance versus 52% of those with health insurance (22). In Iran, a cohort study showed that the proportion of households facing CHE had no significant change from 2003 (12.6%) to 2008 (11.8%) (14). Also, another study in Iran in 2017 demonstrated that 55% of patients faced catastrophic expenditures (24). In our study, CHE was above 90% in PPP hospitals and about 40% in public hospitals at the baseline, which is too much for patients who face it. The government must pay special attention to facilitating cardiovascular services for patients. Decimals of the population can be a good indicator for policymakers to be concerned about this problem.
Our study showed that the type of hospital and SES significantly affected the likelihood of patients facing CHE. As we discussed the types of hospitals and OOP before, the same applies to the chance of CHE. The more one pays for medical expenses, the higher the likelihood of facing CHE.
Our study categorized patients as poor, middle, and rich concerning SES. The results showed that having poor status doubles the chance of facing CHE. A systematic review conducted by Azzani et al. found that socioeconomic inequality plays an important role in facing CHE, and low-income households are at a high risk of financial hardship of medical expenditures (31). Also, Emamgholipour et al. found that income level negatively impacts CHE (24).
5.1. A Picture of OOP and CHE Over Time
Looking at the goals of HSEP, it seems that the CHE proportions found in this study are far more than its goal. Assessment of Iran's HSEP shortly after implementation showed a decreased percentage of direct patients' costs and OOP. However, the net value of payment and expenses were even increased. Most previous studies were cross-sectional and could not present a picture of the OOP and CHE during time. For this group of patients, we emphasize further investigation into the causes of the non-success of HSEP toward its goal (32).
The biggest strength of our study was its design, which followed patients prospectively. We followed our participants for one year by making phone calls every three months. Our sample size was another strength. We also included socioeconomic factors in our analytic methods to find effective factors in facing CHE. We even used appropriate and strong models to analyze our data.
The limitation of our study was the loss of participants during follow-up periods. We suggest that future studies should include private hospitals, other cities, and other factors that can affect CHE and OOP, such as insurance coverage, in their analysis.
In conclusion, we found that the baseline CHE is very high for both PCI and CABG patients. Thus, the government should pay special attention to this issue. We also found that admission duration, age, type of hospital, and being a smoker significantly affected OOP, and type of hospital and SES significantly affected CHE. The baseline CHE was very high, so the government should pay special attention to this issue. Finally, we recommend further investigating the effect of "age" and "being a smoker" on OOP.
