


1. Background
Despite national vaccination efforts for Coronavirus disease 2019 (COVID-19), early detection and identifying the most effective treatment strategy remain challenges. The mortality rate of COVID-19 in the past year is comparable to the mortality rates of the acquired immuno deficiency syndrome (AIDS) epidemic and drug abuse in recent decades (1, 2). Most expired COVID-19 patients suffered from comorbidities. Additionally, factors such as health behaviors, access to healthcare, and physiological and genetic factors can contribute to susceptibility to COVID-19, alongside comorbidities and demographic characteristics (3-5). The relationship between COVID-19 and comorbidities is two-way: Infection with coronavirus increases mortality due to underlying diseases, while individuals with comorbidities may avoid healthcare centers due to fear of COVID-19 exposure (6). It has been shown that the interaction between COVID-19 and underlying disorders, such as diabetes mellitus (DM), can result in cardiovascular adverse events (7).
Diabetes mellitus is considered a leading cause of mortality in developing countries (8, 9). According to the latest reports, the overall prevalence of DM in Iran is 10.8%, with the highest frequency in Khuzestan Province (15.3%) (10). Additionally, DM significantly increases mortality (488%) and disability-adjusted life years (DALY) (417%) (11). Despite significant advancements in COVID-19 management, DM remains one of the primary causes of mortality among patients infected with SARS-CoV-2. A comprehensive study in India reported that 85.1% of expired COVID-19 patients had DM (12). Furthermore, long-term adverse outcomes following COVID-19 are significantly higher in patients with DM (13). However, there are conflicting findings regarding the impact of comorbidities on the mortality rate of COVID-19 (14-16). Sorci et al. also showed that COVID-19 mortality varies across countries due to socioeconomic and political factors (17). In life-threatening conditions like COVID-19, the impact of DM on disease pathogenesis and progression is significant and cannot be overlooked.
2. Objectives
In this investigation, we aimed to evaluate the effect of DM on the survival of COVID-19 patients in southwest Iran.
3. Methods
3.1. Participants
The present study evaluated patients with COVID-19 who were referred to the Razi Hospital in Ahvaz from February 2020 to October 2020. The inclusion criteria were patients with confirmed COVID-19 and comorbidities who required hospitalization. The definitive diagnosis of COVID-19 was based on clinical examination, molecular tests, and radiological findings. Chronic underlying conditions due to impairments in various organs, such as the liver, kidney, gastrointestinal tract, cardiovascular system, immune response, and nervous system, which cause interference with the immune response, were considered underlying disorders (18). Coronavirus disease 2019 infected patients with comorbidities such as DM, cardiovascular disorders (CVD), kidney dysfunction, nervous system impairments, malignancy, liver dysfunction, hypertension (HTN), and chronic obstructive pulmonary disease (COPD) were included. The definitive diagnosis of these underlying disorders was based on laboratory findings, clinical manifestations, and radiological evidence. Patients with comorbidities who did not require hospitalization and hospitalized subjects without comorbidities were excluded.
3.2. Data Collection
All documented information, including length of hospitalization, comorbidities, survival, and clinical and laboratory findings, was collected. Demographic data were also gathered. All patients signed informed consent prior to participation. The study was approved by the Ethical Committee of Ahvaz Jundishapur University of Medical Sciences (ethics approval: IR.AJUMS.REC.1399.764).
3.3. Statistical Analysis
The normality of the data was evaluated using the Kolmogorov-Smirnov test. Continuous variables are presented as mean ± standard deviation (SD) and were compared using one-way analysis of variance (ANOVA). Categorical variables are presented as frequency and percentage and were compared using the chi-square test. t-tests and Mann-Whitney tests were used for parametric and non-parametric data analysis, respectively. For comparisons involving more than two independent variables, the Kruskal-Wallis test was used. A P-value less than 0.05 was considered statistically significant. Data were analyzed using SPSS software (V26).
4. Results
In the present study, 500 diabetic patients with COVID-19 infection were included. The mean age of participants was 59.61 ± 14.88 years. Of the subjects, 192 (38.4%) were female, and 308 (61.6%) were male. Diabetes mellitus alone was the most frequent underlying disorder (46.2%), followed by the co-occurrence of DM and HTN (43%) (Table 1). The most frequent clinical symptoms were cough (68%) and fever (66%).
| Underlying Diseases | Number (%) |
|---|---|
| DM | 231 (46.2) |
| DM, HTN | 215 (43.0) |
| DM, CKD | 12 (2.4) |
| DM, HTN, CKD | 28 (5.6) |
| DM, HTN, COPD | 14 (2.8) |
| Total | 500 (100.0) |
The Frequency of Underlying Diseases
The mean hospitalization duration was 6.69 ± 4.49 days. Among all patients, 75% (425) were discharged, and the mortality rate was 15%. Our data revealed that the death rate was more frequent in patients with simultaneous DM and HTN (66%) (P-value < 0.001) (Table 2). Additionally, the mortality rate was significantly higher in males (72%) compared to females (28%) (P-value = 0.042) (Table 2).
| Variables | Survival | P-Value | |
|---|---|---|---|
| Discharged | Death | ||
| Underlying disorder | < 0.001 | ||
| DM | 214 (50.4) | 17 (22.7) | |
| DM, HTN | 165 (38.8) | 50 (66.7) | |
| DM, CKD | 6 (1.4) | 6 (8) | |
| DM, HTN, CKD | 26 (6.1) | 2 (2.7) | |
| DM, HTN, COPD | 14 (3.3) | 0 | |
| Gender | 0.042 | ||
| Female | 171 (40.2) | 21 (28) | |
| Male | 254 (59.8) | 54 (72) | |
| Age (y) | 58.08 ± 14.79 | 68.24 ± 12.32 | < 0.001 |
Evaluating the Effect of Underlying Disorders and Gender on the Mortality Rate of Coronavirus disease 2019 Patients a
There was no significant difference between discharged and deceased patients in terms of length of hospitalization, with discharged patients having a mean stay of 6.58 ± 3.89 days and deceased patients having a mean stay of 7.35 ± 6.96 days (P-value = 0.16). Additionally, no significant difference was observed between various underlying disorders (P-value = 0.073) (Table 3).
| Variables | Hospitalization Length (Mean ± SD) | P-Value |
|---|---|---|
| Survival | 0.16 | |
| Discharged | 6.58 ± 3.89 | |
| Death | 7.35 ± 6.96 | |
| Underlying disorder | 0.073 | |
| DM | 6.75 ± 4.09 | |
| DM, HTN | 6.95 ± 5.09 | |
| DM, CKD | 4.33 ± 3.11 | |
| DM, HTN, CKD | 5.86 ± 3.76 | |
| DM, HTN, COPD | 5.50 ± 1.91 |
Evaluating the Correlation Between Hospitalization Length with Survival and Underlying Disorders
The white blood cell (WBC) count was significantly lower in surviving patients compared to deceased patients (7.92 vs 10.47) (P-value < 0.001), while the neutrophil count was significantly higher in deceased patients (8514.09 vs 5861.09) (P-value < 0.001). Additionally, the mean values of blood urea nitrogen (BUN) (32.24 vs 27.61), glucose (245.3 vs 213.05), creatinine (Cr) (2.81 vs 1.75), and aspartate aminotransferase (AST) (44.08 vs 41.70) were significantly higher in deceased patients (P-value < 0.05) (Table 4). However, no significant differences were observed between the two groups for hemodynamic parameters, including pulse rate (PR), respiratory rate (RR), and oxygen saturation (SPO2) (P-value > 0.05) (Table 4).
| Laboratory and Hemodynamic Parameters | Survival | P-Value |
|---|---|---|
| WBC, 103/UL | < 0.001 | |
| Survived | 7.92 ± 5.08 | |
| Expired | 10.47 ± 6.71 | |
| Hb, (g/dL) | 0.211 | |
| Survived | 11.98 ± 1.99 | |
| Expired | 11.76 ± 2.05 | |
| Hct, (%) | 0.199 | |
| Survived | 35.07 ± 6.99 | |
| Expired | 34.22 ± 5.60 | |
| PLT, 103/UL | 0.09 | |
| Survived | 186.87 ± 89.82 | |
| Expired | 164.06 ± 80.28 | |
| Neutrophil (per microliter) | < 0.001 | |
| Survived | 5861.09 ± 4190.84 | |
| Expired | 8514.09 ± 6278.67 | |
| Lymphocyte (per microliter) | 0.06 | |
| Survived | 1559.24 ± 1065.14 | |
| Expired | 1298.86 ± 796.12 | |
| CRP | 0.063 | |
| Survived | 46.38 ± 35.56 | |
| Expired | 53.10 ± 32.05 | |
| Glucose (mg/dL) | 0.03 | |
| Survived | 213.05 ± 125.21 | |
| Expired | 245.30 ± 125.22 | |
| BUN, (mg/dL) | 0.01 | |
| Survived | 27.61 ± 21.49 | |
| Expired | 32.24 ± 20.25 | |
| Cr, (mg/dL) | < 0.001 | |
| Survived | 1.75 ± 1.93 | |
| Expired | 2.81 ± 3.52 | |
| Total bilirubin (mg/dL) | 0.96 | |
| Survived | 1.03 ± 0.78 | |
| Expired | 1.02 ± 0.49 | |
| AST, (IU/L) | 0.025 | |
| Survived | 41.70 ± 38.13 | |
| Expired | 44.08 ± 25.82 | |
| ALT, (IU/L) | 0.25 | |
| Survived | 27.38 ± 19.86 | |
| Expired | 28.63 ± 17.37 | |
| ALP, (IU/L) | 0.98 | |
| Survived | 218.92 ± 108.20 | |
| Expired | 215.71 ± 96.17 | |
| RR | 0.54 | |
| Survived | 26.49 ± 5.95 | |
| Expired | 26.74 ± 5.47 | |
| PR | 0.42 | |
| Survived | 88.18 ± 15.04 | |
| Expired | 85.82 ± 10.41 | |
| SPO2 | 0.61 | |
| Survived | 98.29 ± 1.29 | |
| Expired | 98.2 ± 1.32 |
Comparing Laboratory Variables Between Discharged and Dead Patients
Our analysis demonstrated significant differences between various comorbidities for RR and PR (P-value = 0.03) (Table 5). Post-hoc analysis revealed the highest PR and RR in patients with DM, HTN, and COPD (P-value < 0.001).
| Laboratory and Hemodynamic Parameters | Underlying Disorders (Mean ± SD) | P-Value | ||||
|---|---|---|---|---|---|---|
| DM | DM, HTN | DM, CKD | DM, HTN, CKD | DM, HTN, COPD | ||
| RR | 26.30 ± 5.45 | 26.64 ± 6 | 24.1 ± 3.31 | 25.36 ± 5.59 | 34.27 ± 8.84 | 0.03 |
| PR | 86.54 ± 16.08 | 88.49 ± 11.9 | 88.8 ± 8.62 | 88.07 ± 12.87 | 99.64 ± 25.27 | 0.03 |
| PSO2 | 98.31 ± 1.29 | 98.24 ± 1.27 | 98.17 ± 1.4 | 98.18 ± 1.38 | 98.43 ± 1.34 | 0.78 |
| WBC, 103/UL | 7.32 ± 3.54 | 8.62 ± 5.3 | 19.36 ± 15.74 | 9.06 ± 6.65 | 9.33 ± 5.69 | 0.006 |
| Hb, (g/dl) | 12.44 ± 1.76 | 11.47 ± 2.04 | 11.9 ± 1.87 | 11.25 ± 1.96 | 12.6 ± 3 | < 0.001 |
| Hct, (%) | 36.2 ± 5.24 | 33.71 ± 8 | 34.49 ± 5.38 | 32.77 ± 5.64 | 37.8 ± 8.77 | < 0.001 |
| PLT, 103/UL | 195.16 ± 87.62 | 178.55 ± 88.41 | 160.91 ± 104.5 | 156.82 ± 92.46 | 137.71 ± 61.63 | 0.047 |
| Neutrophil (per microliter) | 4547.06 ± 2415.43 | 6018.73 ± 3425.47 | 7931.62 ± 6760.23 | 5735.41 ± 2798.13 | 7554.71 ± 5254.23 | < 0.001 |
| Lymphocyte (per microliter) | 1632.91 ± 1007.9 | 1361.17 ± 939.66 | 1921.92 ± 1598.1 | 1740.65 ± 1495.88 | 1330.04 ± 808.09 | 0.065 |
| CRP | 48.58 ± 37.56 | 48.47 ± 32.55 | 36.87 ± 30.11 | 49.56 ± 36.02 | 14 ± 14.4 | 0.002 |
| Glucose (mg/dL) | 220.11 ± 131.06 | 205.85 ± 105.17 | 256.58 ± 106.08 | 224.32 ± 145.69 | 305.31 ± 230.29 | 0.17 |
| BUN, (mg/dL) | 27.7 ± 21.19 | 27.03 ± 20.35 | 42.93 ± 33.45 | 36.67 ± 21.09 | 28.5 ± 20.28 | 0.062 |
| Cr, (mg/dL) | 1.57 ± 1.66 | 2.3 ± 2.69 | 2.99 ± 3.53 | 2.59 ± 2.23 | 1.62 ± 1.75 | 0.002 |
| Total bilirubin (mg/dL) | 0.93 ± 0.41 | 1.08 ± 0.86 | 0.93 ± 0.46 | 1.46 ± 1.53 | 0.95 ± 0.5 | 0.046 |
| AST, (IU/L) | 45.03 ± 40.35 | 38.31 ± 21.47 | 36 ± 16.95 | 34.86 ± 30.94 | 69.93 ± 105.72 | 0.16 |
| ALT, (IU/L) | 28.55 ± 22.45 | 27.34 ± 16.4 | 20.92 ± 11.67 | 25.04 ± 18.27 | 25.5 ± 18.83 | 0.44 |
| ALP, (IU/L) | 205.46 ± 78.26 | 218.84 ± 108.44 | 265 ± 100.65 | 302.78 ± 217.7 | 213.92 ± 61.64 | 0.03 |
Comparing the Laboratory and Hemodynamic Parameters Between Various Underlying Disorders
The WBC count significantly differed between underlying disorders (P-value = 0.006). Further analysis indicated the highest WBC levels in patients with DM and HTN (P-value < 0.001). We also observed significant differences between various comorbidities when adjusted for hemoglobin (Hb), hematocrit (Hct), and platelets (Plt) (P-value < 0.05). Post-hoc analysis revealed higher Hb, Hct, and Plt levels in patients with DM compared to others (P-value < 0.05).
Additional analysis demonstrated significant differences between various underlying disorders for neutrophil count, C-reactive protein (CRP), and Cr (P-value < 0.05). Based on LSD analysis, the neutrophil count and Cr were lowest in patients with DM; however, the lowest CRP levels were observed in patients with DM, HTN, and COPD (P-value < 0.05).
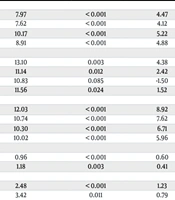
Finally, we detected that total bilirubin and alkaline phosphatase (ALP) levels significantly differed between underlying disorders (P-value < 0.05) (Table 5). Further analysis indicated the highest levels of total bilirubin and ALP in patients with DM, HTN, and chronic kidney disease (CKD) (P-value < 0.05) (Table 6).
| Underlying Disorder | Mean Difference | Sig. | 95% Confidence Interval | |
|---|---|---|---|---|
| Lower Bound | Upper Bound | |||
| DM, HTN, COPD (RR) | ||||
| DM | 7.97 | < 0.001 | 4.47 | 11.47 |
| DM, HTN | 7.62 | < 0.001 | 4.12 | 11.13 |
| DM, CKD | 10.17 | < 0.001 | 5.22 | 15.13 |
| DM, HTN, CKD | 8.91 | < 0.001 | 4.88 | 12.95 |
| DM, HTN, COPD (PR) | ||||
| DM | 13.10 | 0.003 | 4.38 | 21.82 |
| DM, HTN | 11.14 | 0.012 | 2.42 | 19.87 |
| DM, CKD | 10.83 | 0.085 | -1.50 | 23.17 |
| DM, HTN, CKD | 11.56 | 0.024 | 1.52 | 21.61 |
| DM, CKD (WBC) | ||||
| DM | 12.03 | < 0.001 | 8.92 | 15.15 |
| DM, HTN | 10.74 | < 0.001 | 7.62 | 13.86 |
| DM, HTN, CKD | 10.30 | < 0.001 | 6.71 | 13.89 |
| DM, HTN, COPD | 10.02 | < 0.001 | 5.96 | 14.09 |
| DM (Hb) | ||||
| DM, HTN | 0.96 | < 0.001 | 0.60 | 1.33 |
| DM, HTN, CKD | 1.18 | 0.003 | 0.41 | 1.94 |
| DM (Hct) | ||||
| DM, HTN | 2.48 | < 0.001 | 1.23 | 3.74 |
| DM, HTN, CKD | 3.42 | 0.011 | 0.79 | 6.05 |
| DM (Plt) | ||||
| DM, HTN | 16.60 | 0.04 | 0.11 | 33.10 |
| DM, HTN, CKD | 38.34 | 0.03 | 3.71 | 72.97 |
| DM, HTN, COPD | 57.45 | 0.01 | 9.81 | 105.08 |
| DM (neutrophil) | ||||
| DM, HTN | -1444.67 | < 0.001 | -2046.78 | -842.57 |
| DM, HTN, CKD | -3357.56 | < 0.001 | -5275.25 | -1439.87 |
| DM, HTN, COPD | -2980.65 | < 0.001 | -4691.65 | -1269.66 |
| DM, HTN, COPD (CRP) | ||||
| DM | -34.58 | < 0.001 | -54.09 | -15.08 |
| DM, HTN | -34.47 | < 0.001 | -54.0 | -14.95 |
| DM, HTN, CKD | -35.56 | 0.002 | -58.49 | -12.62 |
| DM (Cr) | ||||
| DM, HTN | -.55 | 0.01 | -0.97 | -0.13 |
| DM, CKD | -1.41 | 0.03 | -2.72 | -0.10 |
| DM, HTN, CKD | -1.01 | 0.02 | -1.90 | -0.13 |
| DM, HTN, CKD (total bilirubin) | ||||
| DM | 0.52 | < 0.001 | 0.23 | 0.81 |
| DM, HTN | 0.37 | 0.01 | 0.08 | 0.66 |
| DM, CKD | 0.52 | 0.04 | 0.02 | 1.03 |
| DM, HTN, COPD | 0.50 | 0.03 | 0.02 | 0.98 |
| DM, HTN, CKD (ALP) | ||||
| DM | 97.31 | < 0.001 | 55.57 | 139.07 |
| DM, HTN | 83.94 | < 0.001 | 42.04 | 125.85 |
| DM, HTN, COPD | 88.85 | 0.012 | 19.72 | 157.99 |
Subgroup Analysis of Underlying Disorders
5. Discussion
Management of COVID-19 patients with underlying disorders is a challenging issue at any time. The present survey investigated the mortality rate of COVID-19 patients with various underlying disorders. Our data revealed that the mortality rate in patients with both DM and HTN is higher. Diabetes mellitus, through the reduction of neutrophil chemotaxis and the disruption of monocyte activity and phagocytosis, leads to immune system suppression. The interaction of SARS-CoV-2 and lung cells is mediated by angiotensin-converting enzyme (ACE) 2, which is highly expressed in the lungs and cardiovascular systems. SARS-CoV-2 infection of monocytes plays a role in COVID-19 pathogenesis by initiating cytokine storms, with infected monocytes expressing more ACE2, the receptor for SARS-CoV-2. In COVID-19, monocyte activation upregulates Hypoxia-inducible factor-1-α (HIF-1α), which is induced in hypoxia, leading to increased glycolysis (19, 20). SARS-CoV-2 replication is fueled by adenosine triphosphate (ATP) and pyruvate produced in the glycolysis pathway, especially in diabetic patients (21). In type I DM, elevated glucose levels during COVID-19 infection alter insulin needs, accompanied by increased pro-inflammatory cytokines, such as interleukin-1β (22). Additionally, glucose increases monocyte function and virus replication in a dose-dependent manner, worsening COVID-19 in diabetic patients (21, 23).
The present study showed that the mortality rate is significantly higher in patients with both DM and HTN compared to those with DM, HTN, and CVD. The exact mechanisms through which HTN affects COVID-19 pathogenesis are not well understood, but several pathways have been reported. Hypertension exacerbates COVID-19 progression by influencing endovascular system inflammation and anti-inflammatory responses. By causing vessel stiffness, increasing inflammatory cytokines (e.g., IL-1β), and promoting oxidative stress, HTN worsens COVID-19 pathogenesis (24). Conversely, increased T regulatory cells and anti-inflammatory cytokine secretion reduce SARS-CoV-2 clearance (25).
There are disagreements regarding the role of Angiotensin II (Ang II) and Ang II receptor blockers in COVID-19. Some studies have suggested that Ang II receptor blockers, used for treating HTN, increase ACE2 expression, potentially heightening susceptibility to COVID-19 infection (26). However, it has also been shown that Ang II blockers may reduce inflammation caused by HTN in COVID-19 patients (27, 28). A recent study found that using renin-angiotensin-aldosterone system (RAAS) inhibitors does not increase the risk of COVID-19 infection (29). In contrast, Ang II may enhance B-cell and plasma cell activity, worsening COVID-19 (27).
A comprehensive investigation in Italy showed that HTN was more common in hospitalized COVID-19 patients. However, a considerable number of discharged patients had negative risk factors such as DM, HTN, COPD, kidney failure, and older age (30). These findings suggest that HTN is an independent factor in COVID-19 development (31). Hypertension has also been associated with reduced antibody production after vaccination (16-18), leading to increased vulnerability to COVID-19 due to lower immunity. Chronic kidney disease, lung disease, COPD, DM, and immunocompromising conditions reduce vaccine effectiveness, causing breakthrough infections and increased hospitalization risk (32). A recent study confirmed that HTN, DM, and older age significantly increase the mortality rate of COVID-19 (33).
We observed that patients with DM had lower WBC counts, which were significantly higher in deceased patients. A significant borderline difference in lymphocyte count was noted, likely due to sample size. The number and type of underlying disorders influence the immune response and lymphocyte production (34). C-type lectin receptors (CLRs) are key in regulating the immune response. These receptors recognize pathogenic antigens by their glycans, initiating an inflammatory response (35). In diabetic patients, high glucose levels activate CLRs, triggering inflammatory pathways and cytokines, which contribute to cytokine storms in COVID-19 (36). This explains our finding that glucose levels were significantly higher in deceased patients.
A nationwide study in India, involving 40,691,059 COVID-19 patients, identified mortality risk factors over 25 months, revealing a 0.7% mortality rate and 8.5% hospitalization rate. The study found that DM, HTN, older age, and CVD significantly increased the COVID-19 mortality rate (37). A similar nationwide investigation by Isath et al. found that the mortality rate (13.6%) was significantly higher in ventilated COVID-19 patients, with socioeconomic and racial disparities impacting survival (38). The frequency of major adverse cardiovascular events was notably higher in COVID-19 patients aged 18 - 39 (39), supporting our findings that comorbidities worsen prognosis. Myocardial injury during COVID-19 was more common in men, aligning with our finding that the mortality rate was higher in males (40).
5.1. Limitations
The main limitation of the present survey is the lack of data on the survival of patients without comorbidities. Additionally, investigating the effect of comorbidities on COVID-19 patients following vaccination could provide valuable insights. Treatment strategies for comorbidities may vary across countries, influencing outcomes. This study did not account for treatment strategies, which may have confounded the results.
5.2. Conclusions
In this study, after evaluating 500 patients with comorbidities, we observed a 15% mortality rate. Our findings indicate that a history of HTN and DM are important risk factors for the outcome and survival of COVID-19 patients. Lower WBC counts, neutrophilia, higher BUN, Cr, and AST levels were associated with survival outcomes. Therefore, more attention is required for COVID-19 patients with HTN and DM. Given the discrepancies with recent investigations, further studies with longer follow-up are recommended.
