1. Background
β-oxidation of fatty acid contains 4 different steps that happen in four different kinds of mitochondrial enzymes. The oxidation is a catabolic reaction that breaks down the fatty acids into acyl-CoA and acetyl CoA. There are three kinds of hydroxyl CoA dehydrogenase (HAD) in mitochondria, medium-chain HAD (MCHAD), short-chain HADH (HADHSC), and long-chain HAD (LCHAD) (1). HADH helps to produce nicotinamide adenine dinucleotide (NADH) from NAD during the fatty acid β-oxidation. AMPK is an energy-sensing enzyme sensitive to the increase in the ratio of AMP/ATP. AMPK increases ATP generating pathways, such as fatty acid β-oxidation, in the cells, and in spite, decreases the anabolic pathways that consume the ATP (2).
Different variants of the HAD genes are involved or might be involved in type 2 diabetes. The HADHSC gene is leading to produce an enzyme named L-3-hydroxy acyl-CoA dehydrogenase (SCHAD), which has a crucial role in fatty acid β-oxidation in mitochondria. Furthermore, in children with unregulated HADHSC gene expression and HADHSC knockdown mice (HADHSC-/-), the glucose level in plasma drops despite the insulin level, which increases dramatically (3). Using RNA interference against HADHSC RNA in β pancreatic cells illustrates the increase of insulin unrelated to glucose fluctuation (4). According to the literature, the diversity of HAD genes is associated with diseases such as Alzheimer’s, Parkinson’s, other retarded brain problems (1), and autism (5). However, the importance of HADH genes has been revealed in mentioned diseases, but its importance in cancer cells metabolism requires more effort and devotion. A newly published paper has unveiled the effect of the HADH gene on gastric cancer progression. Gastric cancer patients with different stages of gastric cancer are studied for expression of the HADH gene. It’s demonstrated that during the cancer cell progression, the HADH gene expression was reduced. Also, while the HADH is knocked, the ability of the gastric cancer cells to migrate down raise abruptly (6).
The cancer metabolism and Warburg effect during the downregulation of the HADH gene is necessary to be focused, and the hypothesis in this study was to check the role of HADHSC in human non-small lung carcinoma cell lines H1299 metabolism and DNA replication.
2. Objectives
In this case, shRNA was used to knock down the HADHSC. Metabolism of cancer cells and their DNA replication were analyzed by comparing them to the control cells with an intact HADHSC gene.
3. Methods
3.1. Cell Culture and Transfection
Human non-small lung carcinoma cell line, H1299, and 293 T cells were kept in the Department of Biotranslational Medicine, Jinan University, Guangzhou, China. They were maintained at 37 C with 5% CO2 in Roswell Memorial Institute (RPMI) medium (Invitrogen) and supplemented with fetal bovine serum (FBS) (Invitrogen). psPAX2 viral expression and packaging system was used to transfect H1299 cells. In summary: the 293 T cells were infected by pMD2.G (500 ng) (expressing plasmid) 1ul, psPAX2 (500 ng) (packaging plasmid) 1 µL, and pLKO.1-shRNA (500 ng) (plasmid). Later viral particles were used to induce HADHSC to knockdown.
3.2. shRNA and Cloning
shRNA sequence against HADHSC (GenBank Accession no. NM-057186) was designed and synthesized by Guangzhou Ribobio Co. Ltd. (Guangzhou, China) based on the previous paper (7), and it suppressed the HADHSC gene completely; the sense strand for the selected HADHSC shRNA was 5’-gatccgcac cgatgaccagccagaattcaagagattctggctggtcatcggtgtttttt-gga aa-3’.
3.3. Western Blot (WB)
Whole cells were lysed and to do western blot. The concentration of µ50 -100 µg/µL. Then, SDS buffer and β-mercaptoethanol were added. The mixture then boiled at 100 C, and centrifuged Protein separation was done using the polyacrylamide/ SDS page (10%). The samples were loaded into the wells and run for 90 minutes, with a voltage of 90. Polyvinylidene difluoride (PVDF) membrane (Merck, cat.10600123) was used for transferring the gel. The PVDF and gel were added into the transfer machine and run for 90 minutes with a voltage of 90. After blocking the membrane in five present skimmed milk (Merck, cat.115363), mouse monoclonal antibodies against actin (Cell Signaling Technologies cat.3700), HADHSC (Abcam, cat.ab154088), glucose-6-phosphate dehydrogenase (G6PD, rabbit Cell Signaling Technologies cat.12263), and 6-phosphogluconate dehydrogenase (6PGD, Cell Signaling Technologies cat.13389) were used. Later on, the polyclonal antibody for anti-mouse (Cell Signaling Technologies cat.7076) and anti-rabbit (Cell Signaling Technologies cat.7074) antibodies were applied as a secondary antibody. Negative films were used to check the protein bands.
3.4. Relative HADHSC Activity Assay
The cells were treated with 25 mM phosphate, 0.2 mM EDTA (Merck, cat.324503), and 0.2% vol/vol Triton X-100 (Merck, cat.9002-93-1) (pH = 8.0). Later they were centrifuged, and the supernatant was used to do the assay at the disappearance of NADPH at 340 nm (8).
3.5. Relative DNA Synthesis Assay
5-ethynyl 2’-deoxyuridine (EDU) DNA synthesis Assay and 4’-6 diamidino-2-phenylindol (DAPI) staining were used to check DNA synthesis (EdU labeling kit, containing EdU labeling media, Apollo reaction buffer, Apollo catalyst solution, Apollo fluorescent dye solution, and Apollo buffer additive (cat. no. C10310-3; Guangzhou RiboBio Co., Ltd.). Incubate 1 × 10⁴ cells into 96 wells plate with EDU marked medium. The cells later were fixed in formaldehyde and then treated with glycine. After washing with PBS, the Apollo reagent was prepared and added to the cells, while protected from light. Cells were washed with PBS, and the F master mix was added to the cells. Then, the cells were incubated and watched under an inverted fluorescent microscope.
3.6. Glucose Uptake Assay
Cells 15 × 104 were cultured overnight, and the cells medium was discarded. Then, the medium without phenol red was added and incubated for three days. Then the medium was used to check the glucose consumption. Glucose uptake assay kit (AAT Bioquest’s Screen QuestTM Colorimetric Glucose Uptake Assay Kit (cat, 36503) was used to check the glucose uptake. In summary, glucose standard (GS) 1 nmol/µL was mixed with glucose assay buffer (GAB), and then was added sample into a 96 wells plate. In the following, the plate was read at 570 nm every 10 minutes, and OD was taken from the microplate reader divided into their related cell number.
3.7. Relative Lipogenesis Assay
The cells (20 × 104) were seeded into six wells plate. Then, the cells were washed with PBS and fixed in formalin. Then the excess formalin was removed, and cells were washed with distilled water and treated with isopropanol. Later on, the cells were dried and treated with 1 ml oil red working solution. After washing, the cells were washed with distilled water and let to be dried and incubated with oil red dye (eluted in isopropanol). The cells were collected into 96 wells and read at 500 nm in the microplate reader (9).
3.8. Reactive Oxygen Species
Cells (72 × 104) were seeded into a six-well plate, and reactive oxygen species (ROS) reagent (carboxy-H2DCFDA, the final concentration of 5 µM) was added to them. After incubation for 1 hour, the medium and reagent were evacuated, and the cells were trypsinized and centrifuged. Cells, then, were collected into a fluorescent activated cell sorting (FACS) tube and analyzed by a FACS (Calibur, Becton Dickinson, San Jose, CA) machine (10).
3.9. Relative Intracellular ATP Assay
The assay was done based on the kit (Abcam, ATP assay kit, Cat: ab83355) as follows; The cells were lysed (1 × 10⁶) in the ATP assay buffer. Then, the samples were deproteinized using a 10 KD MWCO spin filter. After that, the cells were added into 96 wells plate. The reaction mix was Added (ATP assay buffer, ATP probe, ATP converter, and developer mix) to them, and the plate was read with a microplate reader at 570 nm.
3.10. Relative Lactate Assay
Cells (15 × 104) were seeded into a six wells plate with RPMI without phenol red and incubated for an hour. The cells were harvested and counted by hemocytometer and homogenized in the lactate assay buffer. Lactate assay buffer was added into six wells 96 wells plate. Then, samples were added into the wells. A mixture of lactate assay buffer, lactate enzyme mix, and lactate probe was made (Abcam, Lactate assay kit, Cat: ab65331). The mixture was added into the wells and read the plate at 570 nm every 10 minutes.
3.11. q-PCR
To analyze the mRNA levels of CS, H6PD, HK1, IDH1, LDHA, MDH2, ME, OGDH, PFKM, PGI, PFKM2, IDH2, PGAM, HADHSC, G6PD, and 6PGD in both controls, and HADHSC KD, qPCR method was used. First of all, the total RNA of the cells was extracted using the RNA extraction mini kit (Qiagen). The cDNA of the total RNA, 1ug, was made. Utilizing the SYBR Green method, the qPCR was done, and actin was used as the control. The primer sequences for CS, H6PD, HK1, IDH1, LDHA, MDH2, ME, OGDH, PFKM, PGI, PFKM2, IDH2, PGAM, HADHSC, G6PD, and 6PGD: CSF: 5’-GGACAATTTTCCAACCAATCTGC-3’, and CS_R: 5’-TCGGTTCATTCCCTCTGCATA-3’; H6PDF: 5’-AGCCTTTTAACTGGCACCCA-3’, H6PDR: 5’- GTTCTGGTCTCGGAAAGGCA -3’, HK1F: 5’-TGGCCTATTACTTCACGGAGC-3’, HK1R: 5’-TGGCCTATTACTTCACGGAGC-3’, IDH1F: 5’-TGCAAAAATATCCCCCGGCT-3’, IDH1R: 5’-TACATCCCCATGGCAACACC-3’, LDHAF: 5’-TTGTCTCTGGCAAAGTGGAT-3’, LDHAR: 5’-CAGCCTTTCCCCCATTAGGT-3’, MDH2 F5’-CTCGGCCCAGAACAATGCTA-3’, MDH2R: 5’-AAGGGAGAAGACAAAGCGGG-3’, MEF: 5’-ATGAAGAGGGGCTACGAGGT-3’, MER: 5’-TGTCCCCGGTCATGGATAGT-3’, OGDHF: 5’-CCATGCACAGTCCCTGGTAG -3’, OGDHR: 5’-ACATGGGGCCTTGACGATCT-3’, PFKMF: 5’-CCGTGGTTCTCGTCTCAACA-3’, PFKMR: 5’-ATACCGGGGGTCTGACATGA-3’, PGIF: 5’-CCGTCAAGTACAGCACTGGT-3’, PGIR: 5’-CTCGTACAGCGCAATCAACG-3’, IDH2F: 5’-CCAAACCGTGACCAGACTGA-3’, IDH2R: 5’-AAGCCACCCGAAGACTTGAG-3’, PGAMF: 5’-TGTGGTGATGGACGGACTTG-3’, PGAMR: 5’-CCCTGCTCATCGACTACGAC-3’, HADHSCF: 5’-AGCTAATGCCACCACCAGAC-3’, HADHSCR: 5’-AGCCCAAACCCGAGTTAGAA-3’, G6PDF: 5’-GACGACGAAGCGCAGACA-3, G6PDR: 5’-GGTAGTGGTCGATGCGGTAG-3, PGLSF: 5’-TCGGTGTTCTCGAGTTCCCA-3, PGLSR: 5’-GTCGAAAACCGGGATGGAGT-3.
The methodology for the PCR was as follows: total volume of 20 µL treated with 95°C for 10 mins for DNA polymerase activation, denature time 30 second at 95°C and annealing 55°C for 30 seconds (40 cycles), followed by one cycle melting, which starts from 55°C - 95°C and every 5 seconds the temperature increased 0.5°C. To analysis the data, the 2-ΔΔCT method was used to calculate the relative gene expression. In this case, the β-actin was used as the reference sequence.
3.12. Statistics
All the experiments were done three times independently. Graphpad prism software has been used to analyze the data, student t-test. A P value of less than 0.05 has been considered to be the criterion.
4. Results
4.1. Cell Culture and Transfection
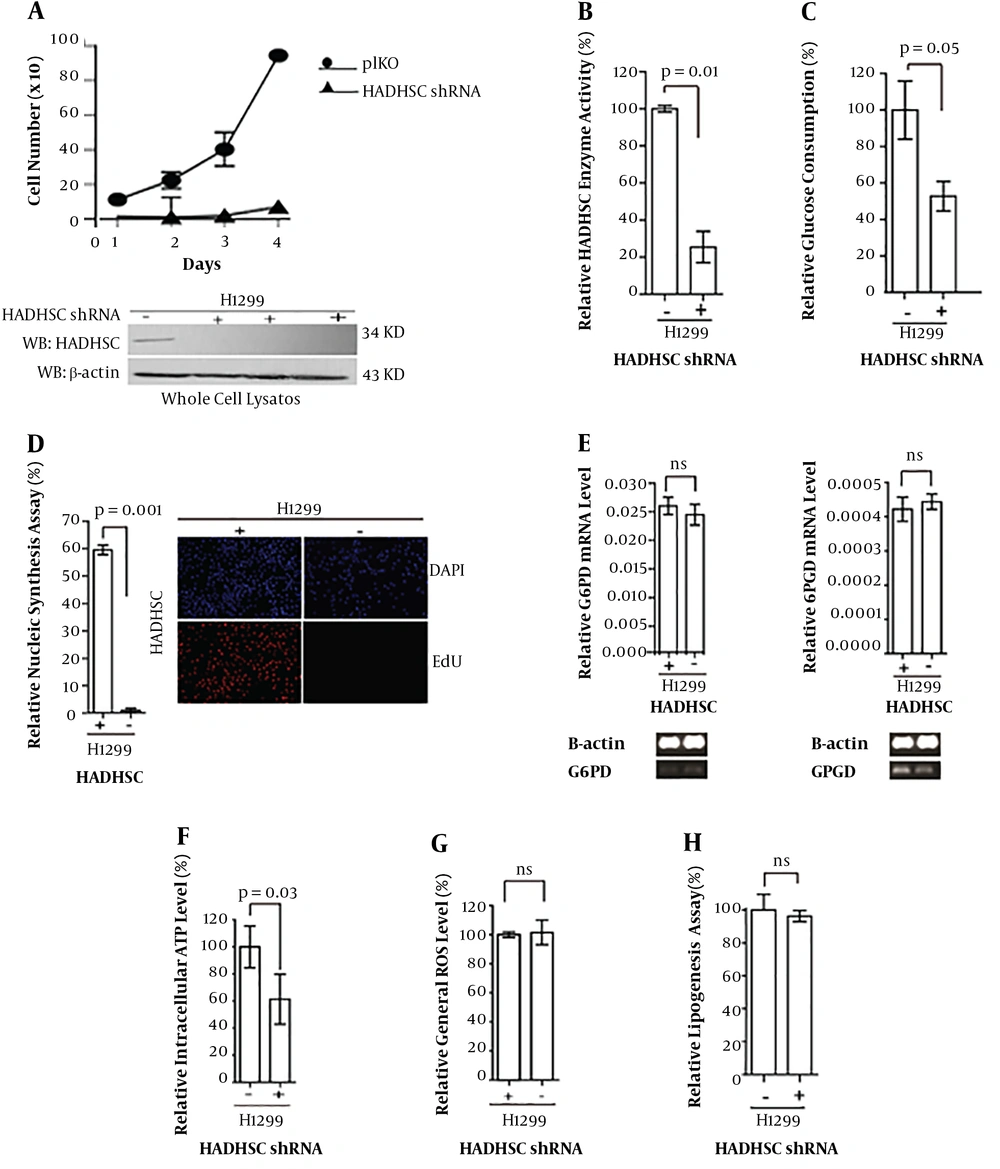
After using shRNA to knock down the HADHSC, the cells were cultured, HADHSC KD, and control cells. A dramatic delay was observed in the division of KD cells (Figure 1A).
A, Cell proliferation and western blot analysis (bottom) of HADHSC KD and control cells; B, comparing HADHSC enzyme activity between control and knockdown cells; C, relative glucose consumption by knockdown and control cells; D, EDU/DAPI assay and its relevant fluorescent microscope photos (right); E, G6PD and 6PGD mRNA and protein levels were checked to see if the DNA synthesis deregulation is due to G6PD or 6PGD malfunction; F, as can be seen, ATP in the knockdown cell was decreased; G and H, ROS, lipogenesis, and lactate relative assay did not show any differences. Short-chain hydroxyl CoA dehydrogenase knockdown by short hairpin RNA (HADHSC shRNA), short-chain hydroxyl CoA dehydrogenase (HADHSC) reactive oxygen species (ROS), 5-ethynyl 2’-deoxyuridine (EDU) 4’-6 diamidino-2-phenylindol (DAPI).
4.2. Western Blot
To be sure that our knockdown is working appropriately, western blot was done to see if the gene expression at the protein level also was decreased (Figure 1A down).
4.3. HADHSC Enzyme Assay
The enzyme activity of HADHSC was checked to see if the enzyme activity level also had been decreased due to the HADHSC KD with shRNA (Figure 1B).
4.4. Glucose Uptake Assay
As the cell proliferation had plummeted, so we were puzzled if there is something wrong with glucose uptake by the cells. As shown in Figure 1C, glucose uptake was dropped sharply.
4.5. Relative DNA Synthesis Assay
Then we assumed that as glucose uptake decreased and cell mitosis had been decreased, so probably it is caused by DNA replication arrest or down-regulation. We have checked DNA synthesis in the cells with EDU-DAPI method. We were amazed by the results as we saw that DNA synthesis had been dived in HADHSC KD cells (Figure 1D). Later it was checked if the pentose pathway hampered, and consequently, DNA synthesis dived. So, mRNA levels of 6PGD and G6PD in the cytoplasm have been examined (Figures 1D and E, respectively).
4.6. Adenosine Triphosphate Assay
As the cell division was decreased dramatically in the cells, we suspected the energy level in the cells. Thus, the best way was to monitor if the amount of adenosine triphosphate (ATP) that is necessary for the cells to be proliferated is enough or not (Figure 1F).
4.7. Reactive Oxygen Species Assay
We thought that probably reactive oxygen species (ROS) was increased in the HADHSC KD cells, so as a result, the cell proliferation was decreased, and DNA synthesis also was declined subsequently (Figure 1G).
4.8. Relative Lipogenesis Assay
However, one of the genes in the fatty acid oxidation was disrupted, but in the case of lipogenesis, we could not see a difference between controls and knockdown cells (Figure 1H).
4.9. Relative Lactate Assay
As HADHSC is very important in energy balance in the cells, we had investigated the amount of lactate in the cells. Lactate dehydrogenase consuming NADH was used to produce lactate from pyruvate. Based on our result, the amount of lactate was not changed in comparison to the control cells (Figure 1I).
4.10. Q-PCR Analysis
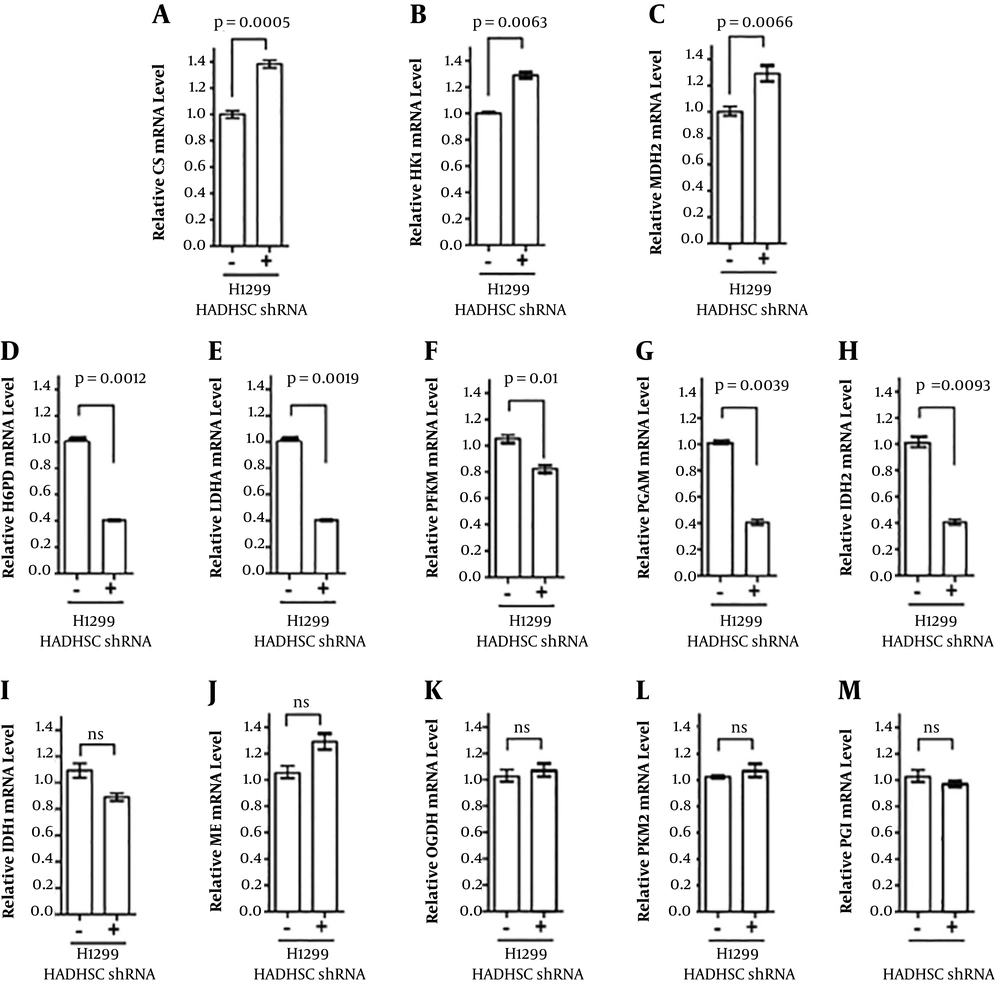
The 2-ΔΔCT method was applied for qualitative q-PCR data analysis mRNA. In this case, β-actin was used as the reference gene and levels of some of the essential genes in glycolysis and Krebs cycle were determined. Our data showed that at the level of mRNA, most of the glycolysis and Krebs cycle enzymes were plummets, except for some of the genes that are highly involved in NADH production, such as MDH2 and HK1 (Figure 2B and C). However, the amount of lactate was not changed according to the lactate assay method, but the mRNA level of LDHA decreased compared to the control one (Figure 2D). We also found that one of the key enzymes in glycolysis, PFKM, decreased in HADHSC KD cells.
mRNA levels of some essential genes in glycolysis and Krebs cycle were studied. As can be seen, CS, HK1, and MDH2 mRNA levels were increased. In spite, H6PD, LDHA, PFKM, PGAM, and IDH2 mRNA levels were down-regulated in knockdown cells. Citrate synthase (CS), hexose-6-phosphate dehydrogenase (H6PD), hexokinase-1 (HK1), isocitrate dehydrogenase-1 (IDH1), lactate dehydrogenase (LDHA), malate dehydrogenase 2 (MDH2), malic enzyme (ME), alpha-ketoglutarate dehydrogenase (OGDH), 6-phosphofructokinase (PFKM), PGI, phosphofructokinase 2 PFKM2), isocitrate dehydrogenase 2 (IDH2), phosphoglycerate mutase (PGAM), short-chain hydroxyl CoA dehydrogenase (HADHSC), short-chain hydroxyl CoA dehydrogenase knockdown by short hairpin RNA (HADHSC shRNA), glucose-6-phosphate dehydrogenase (G6PD), and 6-phosphogluconate dehydrogenase (6PGD), glucose 6 phosphate dehydrogenase (G6PD).
5. Discussion
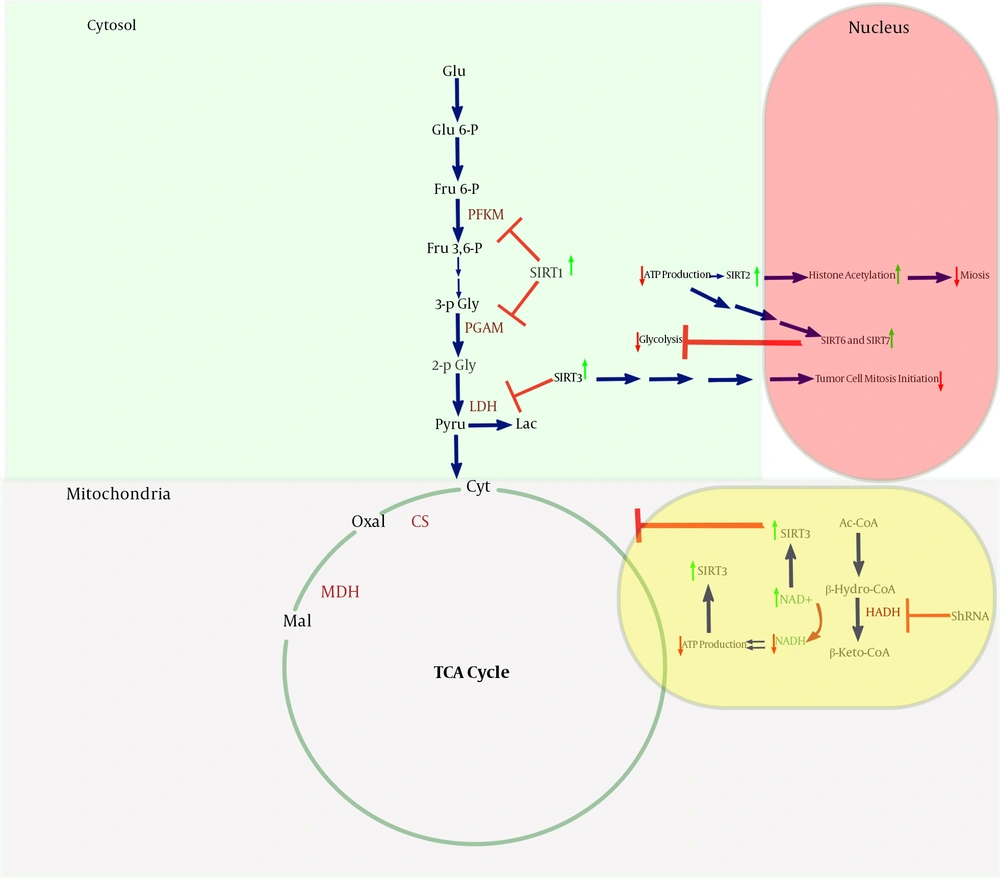
The data revealed that after HADHSC KD, the most critical sign could be seen in cell mitosis progression. In HADHSC KD, the cell division stopped dramatically in comparison to the control cells. It also could be seen that some of the most pivotal genes in glycolysis and TCA cycle down-regulated, especially the ones that needed to spend ATP for their work. It was interesting that the LDHA mRNA level were decreased. Besides, the glucose uptake also was decreased sharply. In spite, one of the most crucial enzymes in the TCA cycle MDH2 mRNA level increased. HADH has a primary role in generating the NADH reservoir of the cells. As a result of HADHSC KD NAD+ piled up in cells, so, probably the main factor missing here is the sirtuins group, especially SIRT3, which has a crucial role in controlling mitochondrial metabolism. Also, the PGAM mRNA level decreased, so as demonstrated previously (11), we think SIRT1 is highly involved in lysine residue deacetylation of PGAM. Also, Sirtuins are highly involved in DNA repair and cell proliferation. In the cells with a lack of HADHSC KD that NAD+ was increased, it gave a signal to sirtuins and caused DNA replication to be arrested (Figure 3).
As can be seen in HADH, knockdown probably has up-regulating effects on the NAD+/NADH ratio. In contrast, the ATP reservoir of the cell drops. The phenomena probably lead to activate sirtuins such as SIRT1 (12), 2 (13), 3 (14), 6 (15), and 7 (16); SIRT1, SIRT3, SIRT6, and SIRT7 have an inhibitory effect on the glycolysis pathway enzymes such as PGAM. SIRT2 and SIRT3 activation probably impact on DNA replication and cell mitosis and suppress the cells’ proliferation. Krebs cycle was mostly controlled by SIRT3.


