1. Background
As one of the most complicated diseases, cancer is characterized by uncontrolled cell division, which through dissemination, causes invasion to distant organs. In 2018, all around the world, 18.1 million new cases of cancer were registered, and various types of cancer claimed nearly 9.6 lives (1). At the same time, 110,000 new cases of cancer and 56,000 cancer-related death are recorded in Iran (2). Chemotherapy and radiotherapy was the most common treatment approaches for cancer available today that cause many side effects and create resistant tumor cells (3). Hence, developing more effective treatments with lower side effects are of crucial importance for researchers (4). Recent studies have indicated some plant components have favorable biological properties, which makes them potential anticancer agents (5, 6).
Although several studies have investigated the plant-derived antioxidants that contain appropriate pharmaceutical properties. Antioxidant potential of E. angustifolia is reported by various studies. Okmen and Turkcan reported that flavonoids isolated from methanolic extracts of E. angustifolia leaves have extensive antioxidant functions (7, 8). Elaeagnus angustifolia is a flowering plant from the Oleaster family growing to 2 - 5 m (even more) and has thorns or no thorns. The trunk of old and young branches are dark brown and gray and silver, respectively. Oleaster has long, pointed elliptical leaves with short petioles. The color of the petiole is greyish green on the upper surface but silver-white on the lower surface (9).
Based on the literature, leaves, and fruits of Oleaster have antibacterial, antioxidant, anti-inflammatory activities, can reduce gastrointestinal spasm and increase blood flow in the coronary arteries, and contain wound healing, anti-mutagenic, and anti-tumor effects (7, 10-14). It’s well documented that the methanolic extract of E. angustifolia leaves is a potent inhibitor of sodium azide mutagen (7). In vitro studies on the effect of fruits on the proliferation of HepG2 have yielded inhibitory effects. Besides, methanolic extract of E. angustifolia can suppress the growth of H22 hepatocytes and improve the pathological condition of spleen tissue and the thymus index in models of mice containing H22 cells. Furthermore, studies conducted on Wistar rats reported delayed tumor emergence and increased survival (15).
2. Objectives
The current study investigated the effects of alcoholic extract of Oleaster leaf on liver cancer cells to evaluate its potential use as an anti-cancer drug.
3. Methods
This study is registered and approved in Payame Noor University and Iranian Research Institute for Information Science and Technology (IranDoc) (code: 12687626).
3.1. Preparation of Alcoholic Extract of Oleaster Leaves
Initially, Oleaster leaves were washed and air-dried. Then, the leaves were grounded. The powder was mixed with 500 ml of 80% alcohol for 4 days on a shaker. Then, solutions were stood and filtered by Whatman paper. The extract was poured into a petri dish and incubated. The dried samples were collected and maintained at temperature of -20°C. Then, 1 mg of the extract powder was dissolved in 1 mL of PBS.
3.2. Cell Culture
The human hepatocellular carcinoma cell line of HepG2 was provided from the cell bank of the Iranian Biological Resource Center. The cells were cultured in Dulbecco’s Modified Eagle’s Medium (DMEM) (Gibco) medium supplemented with 100 U/mL penicillin and 100 mg/mL streptomycin (Gibco), and 10% heat-inactivated fetal bovine serum (FBS). The cells were incubated at 37ºC and 5% CO2. The culture medium was replaced three times a week.
3.3. MTT Assay
The cytotoxicity effect of E. angustifolia leaf extract was evaluated using the MTT test. Briefly, 3 × 10⁴ cells/well were cultured in a 96-well plate. After overnight incubation, the medium was removed, and the cells were treated with various concentrations (50, 100, 200, 400, and 600 µg/mL) of the extract. The untreated cells (cells without extract) were considered as negative controls, and treated cells with cisplatin anticancer drug (48 µg/mL) were used as positive controls. After incubation for 48 h, MTT (5 µL of 5 mg/mL solution) was inserted into wells, and the solutions were incubated again for 1 h at 37°C. Subsequently, 100 µl of DMSO was added and incubated for 2 h at room temperature. The absorbance at 570 nm was determined by a microplate reader (BioRad, USA). The IC50 parameter was used to measure the concentration needed to decrease cell proliferation by 50%. The simplest and most common method to calculate the IC50 parameter is to plot x - y. Hence, we plotted the x - y graph (concentration – growth inhibition). In the linear equation, the Y was considered as 50 (Y = mX + n).
In the present study, MTT data were used to calculate the IC50 value by GraphPad InStat software V. 8 and expressed as µg/mL.
3.4. Neutral Red Assay
The viability of HepG2 cells was analyzed by the neutral red assay. 3 × 10⁴ cells were cultured in a 96-well plate, incubated overnight, and treated with various concentrations of extract for 48 h. Negative and positive controls were used as previously described. Subsequently, neutral red (5 µL of 5 mg/mL solution) was added and incubated for 1 h at 37°C. After removing the medium, the stabilizing solution was inserted for 1 min. Finally, the formed red crystals were dissolved, applying solvent buffer, and the absorbance was assessed at 540 nm by a microplate reader.
3.5. Assessment the Nitrite Oxide (NO)
The NO assay was used to evaluate the amount of released nitrite in the HepG2 culture medium over time. As mentioned above, the HepG2 cells were seeded in a 96-well plate and treated with various concentrations of extract for 48 h. Negative and positive controls were used, as previously described. Then, the culture medium was collected, centrifuged for 5 min at 500 × g, and the supernatant was obtained. Then, an equal amount of Griess reagent solution was added to the supernatant. After 10 min of incubation at room temperature, the absorbance was assessed at 540 nm.
3.6. Catalase Activity Assay
The concentration of the catalase enzyme was measured using the Zellbio commercial kit. After culturing the cells (5 × 10⁵ cells/well) in a 24-well plate and overnight incubation, the HepG2 cells were treated with various concentrations of extract for 48 h. The negative and positive controls were also used. Then, all cells were collected, centrifuged for 5 min at 5000 g, and incubated at -20°C for 30 min. After the addition of cold lysis buffer (200 mL) and 30 min incubation at room temperature, sonication of the cells was done for 15 min. The supernatant was obtained after centrifugation at 2000 × g for 10 min. Subsequently, the kit steps were completed, and the absorption of samples at 410 nm was measured by a microplate reader.
3.7. Reduced Glutathione (GSH) Assay
The Sedlak and Lindsay method was applied to quantify the level of reduced glutathione (GSH). After culturing the cells and overnight incubation, the cells were treated with various concentrations of extract for 48 h. Negative and positive controls were used as previously described. Then, the cells were washed with PBS, collected by centrifuge, and kept at -20°C for 20 min. Next, the addition of chilled cell lysis buffer (200 µL), 30 min incubation at room temperature, 10 - 15 min sonication, and centrifuge at 2000 × g for 10 min were performed to obtain the supernatant. The total protein concentration was measured by the Bradford protein assay method (16). Subsequently, the supernatant was mixed equally with TCA (Trichloroacetic acid) 10%. After 2 h incubation at 4°C, samples were centrifuged for 15 min at 500 × g. Next, 75 µl of lysis buffer and 55 µL of Tris buffer (pH 8.5) were added to 20 µl of obtained supernatant, and the absorbance was assessed at 412 nm by a microplate reader.
3.8. Bax and bcl-2 Expression Analysis
The real-time PCR was used to evaluate the expression level of bax and bcl-2 genes. HepG2 cells were cultured in a 24-well plate and treated with 50, 100, 200, 400, and 600 µg/ml of extract for 48 h. The negative and positive controls were used, as previously described. Then, RNA extraction was performed by the total RNA purification kit (TaKaRa, Korea). The purified RNA was used for cDNA synthesis using the random hexamer primer, dNTP mix, 5x buffer, RNase Inhibitor, M-MLV enzyme (Promega, USA), and DEPC water. After measuring the cDNA concentration with a Picodrop spectrophotometer, Real-time PCR was performed with ABI step-one thermocycler (Life Bioscience, USA) in a reaction volume of 20 mL containing 5 ng of cDNA, 1X SYBR Green qPCR Mix, 0.2 µM of each primer, and RNase-free distilled water. The amplification condition was as follows: 3 min at 95°C for initial denaturation, followed by 40 cycles of quantification step containing: 5 s at 95°C for denaturation, 20 s at 60°C for annealing, and 20 s at 72°C for the extension. GAPDH gene was utilized for internal control. The primer sequences were as following:
bax; forward: 5’-CCCGAGAGGTCTTTTTCCGAG-3’, reverse: 5’-CCAGCCCATGATGGTTCTGAT-3’.
bcl-2; forward: 5’-GGTGGGGTCATGTGTGTGG-3’, reverse: 5’-CGGTTCAGGTACTCAGTCATCC-3’.
GAPDH; forward: 5’-CTGGGCTACACTGAGCACC-3’, reverse: 5’- AAGTGGTCGTTGAGGGCAATG -3’.
3.9. Statistical Analysis
All experiments were performed in triplicate. The results were expressed as mean ± standard error. Data were analyzed using the GraphPad InStat software V. 8 (CA, USA). The one-way ANOVA and Tukey test were used to compare treated samples and controls. Statistical significance was considered when P-value < 0.05.
4. Results
4.1. MTT Test
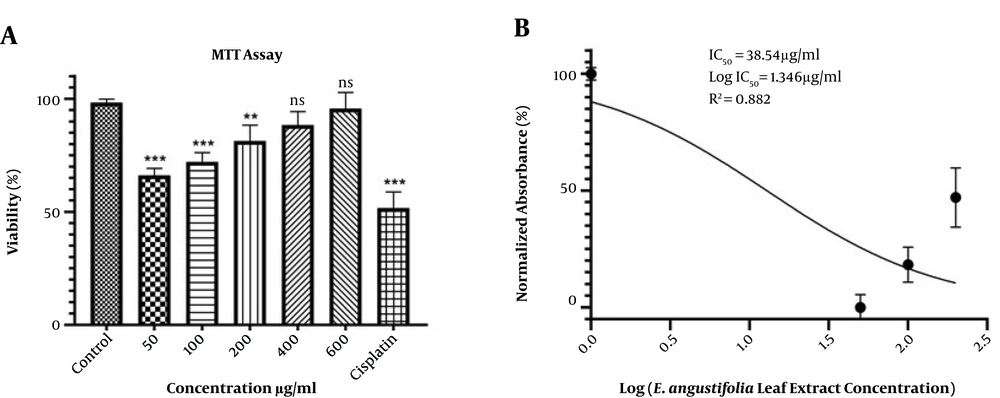
According to the results, the viability of HepG2 cells was significantly decreased at concentrations of 50 and 100 μg/mL compared to controls (P < 0.001). The survival rate of the HepG2 cells was directly associated with the extract concentration. However, compared to the controls, the decrease in viability at the 400 and 600 μg/mL was not statistically significant. Additionally, cisplatin could significantly (P < 0.001) reduce the viability of HepG2 cells (Figure 1A). The IC50 value for the extract of Oleaster leaves was 38.54 μg/mL (Figure 1B).
4.2. Neutral Red Uptake Assay
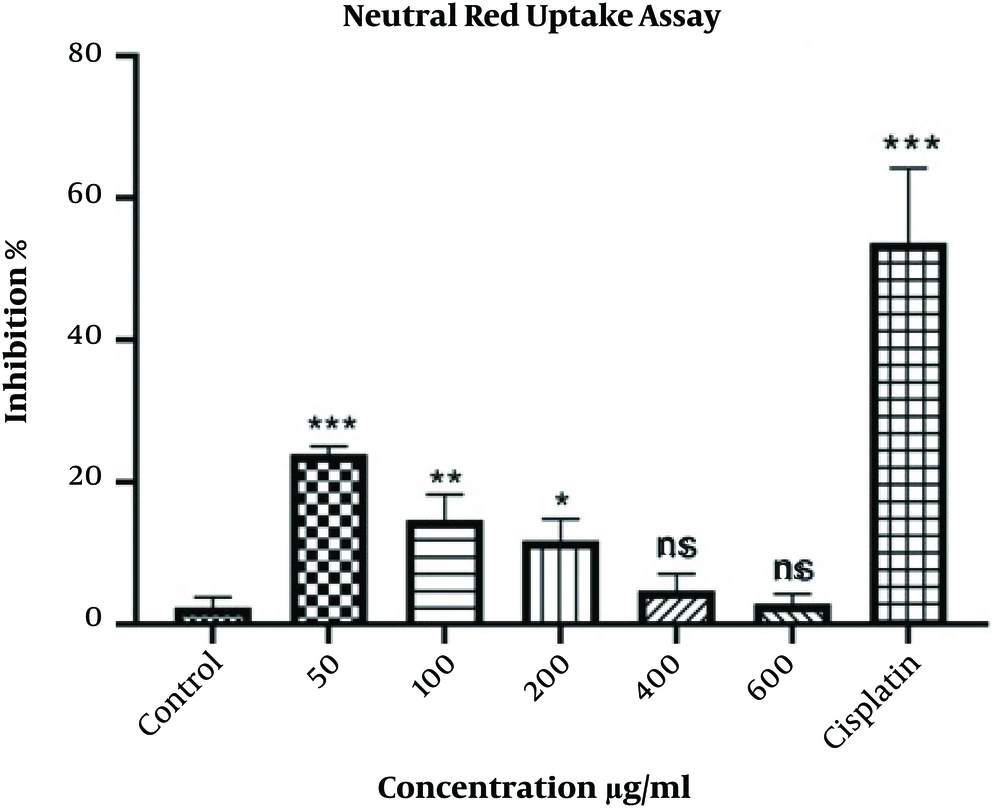
According to the results, the growth of HepG2 cells was significantly inhibited at the concentration of 50 μg/mL (P < 0.001) compared to controls. Meanwhile, the higher the concentration of the extract, the lower was the inhibitory percentage. There was no significant difference concerning the concentrations of 400 and 600 μg/mL. Furthermore, cisplatin could significantly (P < 0.001) inhibit the proliferation of HepG2 cells (Figure 2).
4.3. Nitrite Oxide (NO) Assay
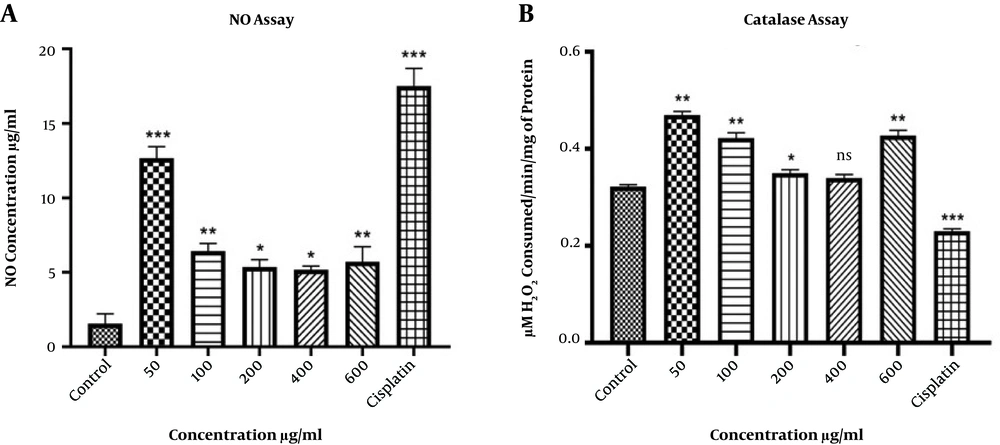
The extract of Oleaster leaves increased the amount of released NO from HepG2 cells (Figure 3A). The maximum amount of released NO was observed at the concentration of 50 μg/mL. Moreover, treatment with cisplatin significantly (P < 0.001) increased the level of released NO from HepG2 cells.
A, The level of released NO from HepG2 cells after treatment with various concentrations of Oleaster leaf extract and cisplatin for 48 h. B, The catalase activity in HepG2 cells treated with different concentrations of Oleaster leaf extract and cisplatin for 48 h. (*P < 0.05, **P < 0.01, ***P < 0.001, ns: non sense)
4.4. Catalase Activity Assay
The activity of the catalase enzyme was significantly increased at the concentrations of 50, 100, 600 μg/mL (P < 0.01), and 200 μg/mL (P < 0.05) of Oleaster leaf extract. Nevertheless, no significant change was observed at the concentration of 400 μg/mL. Moreover, the activity of the catalase enzyme was significantly reduced after treating cells with cisplatin (Figure 3B).
4.5. Reduced Glutathione (GSH) Assessment
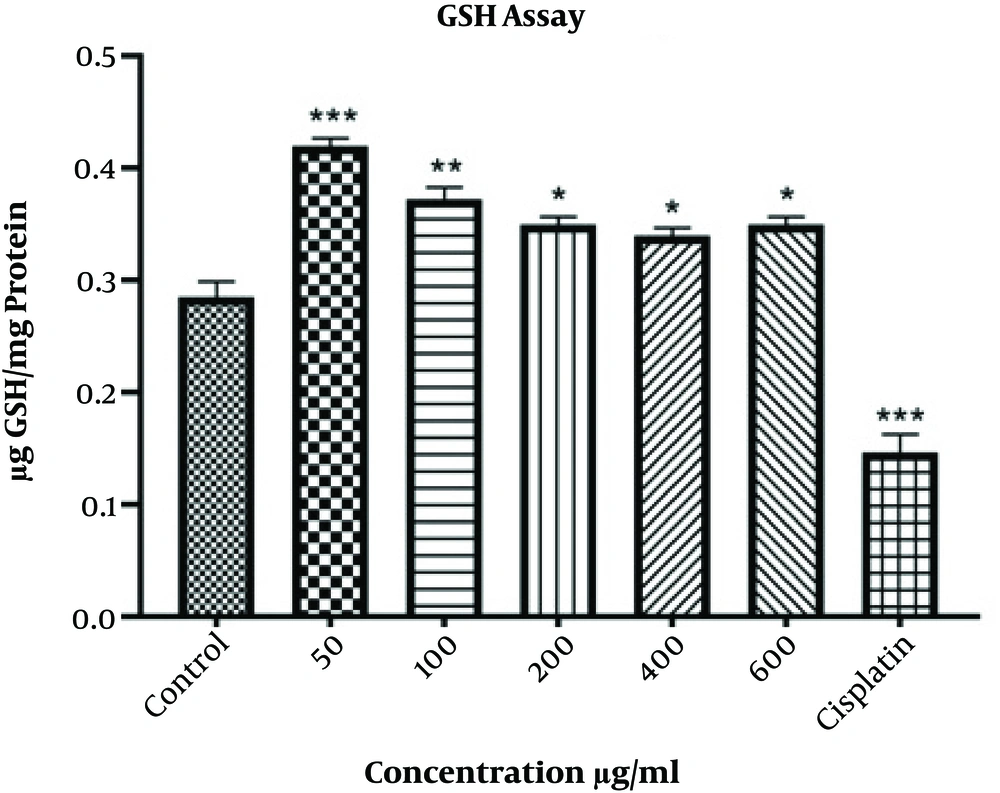
The amount of GSH was significantly increased in groups treated with various concentrations of Oleaster leaf extract (Figure 4). The maximum increase was observed at 50 μg/mL (P < 0.001) and 100 μg/mL (P < 0.01). Furthermore, GSH concentration was significantly decreased in HepG2 cells treated with cisplatin (P < 0.001).
4.6. Determination of bax and bcl-2 Expression
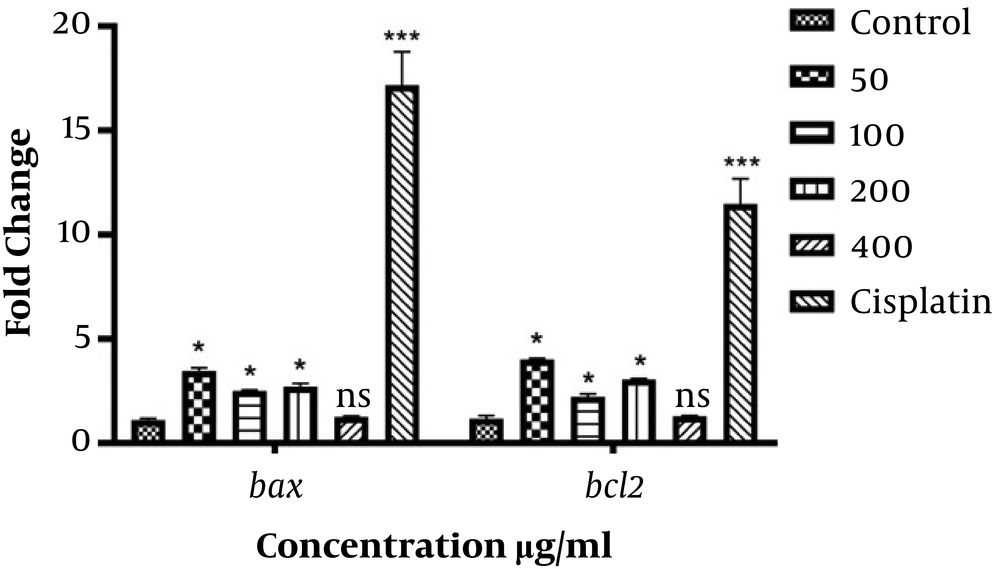
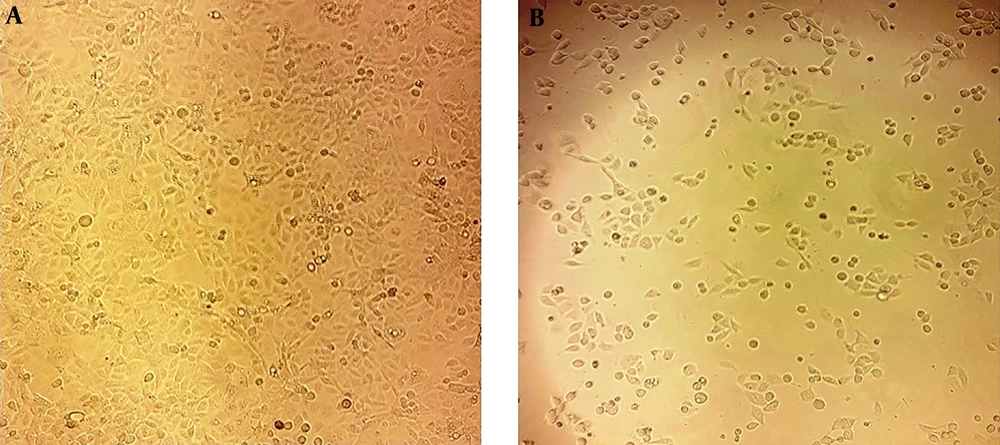
The expression of bax and bcl-2 genes was significantly increased at the concentrations of 50, 100, and 200 μg/mL as well as the cisplatin group. However, there was no significant difference concerning the bax and bcl-2 expression at the concentration of 400 μg/mL (Figure 5). Moreover, treated cells showed noticeable morphological changes, including cell shrinkage, nuclear fragmentation, and chromatin condensation, which further indicated the apoptosis process (Figure 6).
5. Discussion
Several studies have been focused on plant-derived agents for cancer treatment that cause lower side effects (5, 6, 17). In this line, the current study investigated the Elaeagnus angustifolia. The extracts and soaks of E. angustifolia fruits, flowers, leaves, and bark have been used traditionally to treat various diseases (11). Recently some studies have revealed the antioxidant, anti-inflammatory, anti-tumor, and antimicrobial properties of E. angustifolia (7, 11-13).
In the present study, the MTT results indicated the cytotoxicity effects of Oleaster leaves extract, and its ability to suppress the liver carcinoma cells.
According to the results, the highest cytotoxicity was obtained for the lowest concentration (50 μg/mL). Kampranis et al. found that a new plant-derived glutathione s-transferase/peroxidase could inhibit the lethality of Bax in yeast (18). Choi et al. showed that ascorbic acid, an abundant component of plants, could induce bone marrow-derived mesenchymal stem cell proliferation and differentiation (19). Based on the findings, the authors of the present study, suggest that the Oleaster leaves extract contains components that induce proliferation of cells, particularly at high concentrations. A study by Patel et al. evaluated the cytotoxic activity of Solanum Nigrum extract on HeLa and Vero cell lines via MTT assay (20).
The neutral red method provides a quantitative measurement estimate of the number of viable cells in cell culture. This method is cheaper, and in some cases, more sensitive than other cytotoxicity tests such as the MTT (21). Borenfreund et al. used the neutral red method to evaluate the cytotoxicity in vitro (22) and found that higher levels of NO in the cytosol could enhance the membrane permeability in mitochondria, which in turn led to more cytochrome C release from mitochondria and apoptosis in liver carcinoma cell lines (23).
Moreover, nitrite oxide is known for its activities to induce apoptosis in neuroblastoma cells and hippocampal neurons (24). In the present study, the alcoholic extract of Oleaster leaf could increase the amount of NO released from the cells. 50 µg/mL of the extract resulted in the maximum production of NO, which was correlated with the MTT and neutral red assay.
The flower and leaves extract of E. angustifolia contain flavonoid and phenolic components with antioxidant properties against oxidative damage, which reduce the occurrence of several degenerative diseases (9). According to the previous studies, the highest level of antioxidant compounds is in the leaves of E. angustifolia, probably due to the photosynthesis process. There are additionally more flavonoid biosynthesis precursors in the leaves (9). Various chemical components are identified in the leaves of E. angustifolia including flavonoids, amino acids, polysaccharides, phenolic compounds, and several other crucial factors. Polysaccharides are one of the most significant compounds of E. angustifolia that are known for their antioxidant, anti-radiation, and immune-regulating properties (9, 10). Amino acids can promote the growth of mammalian cells (25). It’s well-proved that the epigenetic changes, besides genetic alteration, are involved in cancer development. According to recent studies, flavonoid components such as kaempferol, quercetin, and catechin can modify the epigenetic alteration involved in the tumorogenesis process (26, 27).
The Bcl-2 family are the regulators of apoptosis, in which Bax and Bcl-2 act as pro-apoptotic and anti-apoptotic elements, respectively. While the intracellular Bcl-2 inhibits apoptosis, Bax could induce apoptosis by inhibiting the activity of Bcl-2. However, it was found that the Bax/Bcl-2 ratio is a significant parameter that heavily influences cell fate (28, 29). This study showed that the alcoholic extract of Oleaster leaves can significantly change the bax and bcl-2 expression as well as the ratio of bax/bcl2.
In conclusion, the alcoholic extract of Oleaster leaves, which showed cytotoxic effects on HepG2 cells, could be considered as an alternative or complementary therapeutic option to treat liver cancer.

