


1. Background
Ovarian cancer is the eighth most common cause of cancer death due to gynecologic malignancies. And is the second cause of death cancer due to cancer in Iranian women (1). Epithelial ovarian tumors are highly common in the sixth decade of a women’s life. Serous carcinoma is the most common epithelial ovarian tumor (2). Therefore, given the extensive prevalence of ovarian cancer, it is urgent to conduct further studies to detect novel anti-cancerous components with high therapeutic utility and minimum side effects.
Microscopic and macroscopic evaluations have confirmed the positive effect of ketoprofen on tumor weight loss and treatment of ovarian cancer in Wistar rats (3). Ketoprofen is a relatively novel nonsteroidal anti-inflammatory drugs (NSAIDs). It is mainly used for relieving pain and reducing fever and arthritis-related inflammation. Previous studies have shown that NSAIDs exhibit anti-tumoral effects by inhibiting cyclooxygenase (COX) and inducing cellular death through activating caspase and stopping the cellular cycle (4). Researchers have concluded that molecules with COX-inhibiting features are potential anti-cancer agents. NSAIDs are used to inhibit the growth of cancerous cells in glioma (5), melanoma (6), ovarian cancer (7), colorectal cancer (8), prostate cancer (9), and osteosarcoma (10). One of the potential effects of NSAIDs is inhibiting the expression of the Cyclin D1 enzyme, which is a regulator of the cellular cycle and activates TNF-induced NF-κB. Ketoprofen has been reported as a preferred inhibitor of COX-1, and the non-selective inhibition of COX-1 and COX-2 has been revealed using ketoprofen (11). COX-1 is increasingly expressed in cancerous cells of ovaries (12), colon, lung (13), prostate (14), cervix (15), and breast (16), while they are hardly detected in normal tissues. Ketoprofen may have a role in reducing angiogenesis and tumor progression by inhibiting the absorption of platelets, neutrophils, and lymphocytes, in addition to modulating the effects of COX and lipoxygenase (LOX) (17).
In previous studies, new biomarkers for early detection of ovarian cancer, including prostasin (PRSS8), kallikrein (KLK6/7), and miRNAs, have been investigated. HE4 is one of the most promising tumor markers for the progression of ovarian mucosal cancer, which its high sensitivity and specificity for HE4 and high expression in serum and tissue of patients with ovarian cancer were the reasons for choosing this tumor marker (18). HE4 is one of several WAP proteins on 20q12 - 13.1 that is expressed by WFDC2. Using molecular techniques to measure HE4 protein is a relatively new non-invasive diagnosis method to determine the severity of disease invasion, early diagnosis of cancer, and screening the ovarian epithelial cancer patients in terms of disease relapse and progression. Concurrent evaluation of HE4 and CA125 in patients’ serum, known as the Roma test, makes it possible to accurately detect women with ovarian cancer before menopause (19). Increased expression of HE4 in patients’ urine, serum, and ovarian neoplastic tissue has been reported. The HE4 gene is expressed in 100% of endometrioid carcinoma, 93% of serous adenocarcinoma, and 50% of transparent cell adenoma, which helps divide the different subgroups of tumors (20).
2. Objectives
Considering the importance of ovarian cancer, the present study was conducted to determine the anti-cancer effect of ketoprofen on the expression of the HE4 gene and the survival of ovarian cancer cells of A2780S.
3. Methods
3.1. Cell Culture
In this study, human ovarian cancer cell line A2780S obtained from the Pastor Institute of Iran was used. The cells were cultured in RPMI1640 medium (Inoclon; Iran), containing 10% FBS (German-made Biochrom GmbH) and 1% penicillin-streptomycin antibiotic (Inoclon Company; Iran) and incubated in optimum conditions. Adherent cultures should be passaged when they are in the log phase after cell density reached 80 - 70%.
3.2. Drug
Ketoprofen solution (Erfan Darou; Iran) was prepared as 100 mg/mL from the pharmacy. For serial dilutions 1, 5, and 10 λ, ketoprofen was dissolved in RPMI1640 medium.
3.3. Cellular Part
3.3.1. IC50 Assay & Calculation of Time
To obtain IC50 cultures, after reaching the desired cell density, the cells in the plate were separated from the flask floor. Then, the cells were implanted in a 12-well plate. They were then incubated in optimum conditions. After reaching the desired density, different doses of ketoprofen were added to each well. After trypsinization, the cells were separated. After centrifugation of cell suspension, cell counting was done using the Neubauer slide. Then, for calculation of time, the IC50 method was performed, except that the appropriate dose obtained by the IC50 method was added to the wells, and the cells were harvested at different times of 24, 48, and 72 h.
3.3.2. Cell Culture to Measure Gene Expression
The cells were implanted in 24-well plates and were incubated in optimum conditions. After reaching the desired density, a dose of 500 µM of ketoprofen was added to the wells, and cell harvesting was performed within 24 and 48 h. After centrifugation of the cell suspension, cell deposition quickly entered the nitrogen tank. In all experiments, a control group (without receiving ketoprofen) was considered.
3.4. Molecular Experiments
3.4.1. RNA Extraction
RNA extraction was performed using the High Pure RNA Isolation Kit (Roche Company made in Germany) according to its protocol. For qualitative evaluation of the extracted RNA, RNA electrophoresis was performed using an agarose gel. High purity RNA creates two clear bands on the gel. Also, for quantitative evaluation of the extracted RNA, a NanoDrop spectrophotometer was used, and optical absorption was measured at the wavelengths of 230, 260, and 280 nm.
3.4.2. cDNA Synthesis
cDNA synthesis was performed based on a thermo scientific kit made in Lithuania, which after mixing materials, was placed in a thermal cycler for 10 min at 25ºC, 60 min at 42ºC, and 10 min at 65ºC, then a NanoDrop spectrophotometer was used to measure the absorption of cDNA samples.
3.4.3. Primer Design
To design primers, the sequences of HE4 and GAPDH genes were obtained from NCBI databases and designed using specific primers and the Gene Runner software. After designing the sequences of the primer, the accuracy primers' coupling location was ensured using the NCBI Blast. The primers were delivered as lyophilized from Pishgam Biotech company (Table 1).
| Primer Name | Sequence (5´to 3´) | Tm | %GC | Product Size (bp) |
|---|---|---|---|---|
| HE4 | 164 | |||
| F | CGGCTTCACCCTAGTCTCAG | 59.54 | 60 | |
| R | CATTGGGCAGAGAGCAGAAG | 58.62 | 55 | |
| GAPDH | 102 | |||
| F | TCCTCCACCTTTGACGCTG | 59.63 | 57.89 | |
| R | CACCACCCTGTTGCTGTAGC | 61.24 | 60 |
Sequences of the Primers Used in This Research
3.4.4. Investigation of the Gene Expression Using SYBR Green in Real-time PCR
Real-time PCR reactions were performed (Applied Biosystems StepOneTM and StepOnePlus; USA) in a final 25 μL volume. At first, a mixture of RealQ plus 2x master mix (Ampliqon; Denmark) and water were prepared. The HE4 and GAPDH primers were added to their master mix solution, and then cDNA was added. Real-time PCR was conducted, and the temperature-time program was performed in three stages. The first stage, which leads to the denaturation of the pattern DNA and activation of the polymerase enzyme, continued at 95ºC for 15 minutes, and in the second stage, the DNA proliferation reaction consisted of 40 cycles at 95ºC for 20 seconds, 62ºC for 15 seconds, and 72ºC for 30 seconds. The final step was to check the specificity of the product to plot the melting curve at the temperature range of 73 - 95ºC, which was set for each degree for 5 seconds.
3.5. Statistical Analysis
All experiments reported in the present study were performed in triplicate. The data were analyzed by the one-way analysis of variance (ANOVA) using GraphPad PRISM (Version 8), and they were reported as mean ± standard deviation (SD). A P < 0.05 was considered statistically significant.
4. Results
4.1. IC50 Assay
The results obtained after a 24-hour incubation showed a decrease in the survival rate after treatment with ketoprofen in a dose-dependent manner (Figure 1) so that the percentage of living cells compared with the control decreased significantly from 82.21 ± 2.5 (at a concentration of 100 μM) to 43.43 ± 5.15 (at a concentration of 1000 μM). According to Figure 1, the IC50 for ketoprofen was 583.7μM, which was followed by treatment using a concentration of 500 μM. According to the Tukey test results, there was no significant difference between the two doses of 500 µM and 1000 µM; however, there was a significant difference between these treatments and the control group at P < 0.05 (Table 2).

Comparison of viability between different concentrations of ketoprofen. The diagram is drawn based on the percentage of living cells compared with the control group. * P < 0.05, **P < 0.01, and P < 0.001.
| Tukey Test | Mean Diff. | 95.00% CI of Diff. | P-Value |
|---|---|---|---|
| 100 µM vs. control | - 17.79 | - 40.61 to 5.029 | 0.1064 |
| 500 µM vs. control | - 52.15 | - 74.97 to -29.34 | 0.0026 |
| 1000 µM vs. control | - 56.57 | - 79.39 to -33.76 | 0.0019 |
| 500 µM vs. 100 µM | - 34.36 | - 57.18 to -11.55 | 0.0123 |
| 1000µM vs. 100µM | - 38.78 | - 61.60 to -15.97 | 0.0079 |
| 1000 µM vs. 500 µM | - 4.420 | - 27.24 to 18.40 | 0.8567 |
Comparison of the Mean Viability at Different Ketoprofen Doses Using Tukey Test
4.2. Calculation of Time
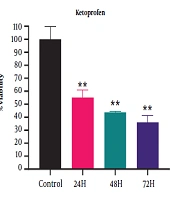
According to the results displayed in Figure 2, significant differences were observed at different times (P < 0.05) and the survival rate decreased over time; however, the highest lethality of ketoprofen was found 24 hours after treatment (55.14 ± 5.78). According to the Tukey test results, there was no significant relationship between the treatment groups; however, treatment with ketoprofen after 24, 48, and 72 hours showed significant compared with the control group at P < 0.05 (Table 3).

Comparison of viability at different times of ketoprofen treatment. The diagram is drawn based on the percentage of living cells 24, 48, and 72 hours after ketoprofen treatment at a dose of 500 μM compared with the control group. * P < 0.05, **P < 0.01, and P < 0.001.
| Tukey Test | Mean Diff. | 95.00% CI of Diff | Adjusted P-Value |
|---|---|---|---|
| 24h vs. control | - 44.86 | - 70.03 to - 19.69 | 0.0066 |
| 48h vs. control | - 56.25 | - 81.41 to - 31.08 | 0.0028 |
| 72h vs. control | - 63.98 | - 89.14 to - 38.81 | 0.0017 |
| 48h vs. 24h | - 11.39 | - 36.55 to 13.78 | 0.3747 |
| 72h vs. 24h | - 19.12 | - 44.28 to 6.054 | 0.1145 |
| 72h vs. 48h | - 7.73 | - 32.90 to 17.44 | 0.6329 |
Comparison of the Mean Viability at Different Times of Treatment with Ketoprofen Using Tukey Test
4.3. HE4 Gene Expression
According to Figure 3, the HE4 gene expression in the A2780S cell line treated with ketoprofen decreased compared with the cells in the control group (Fold change < 1). The trend of expression reduction in cells that received ketoprofen for 48 hours (Fold change = 0.058234) was higher than those that received ketoprofen for 24 hours (Fold change = 0.06778), but based on the Tukey test results, the relationship between the two groups was not significant (Table 4).

Comparison of the HE4 gene expression using real-time PCR after treatment with ketoprofen for 24 and 48 hours in A2780S ovarian cancer cell line. The control group was used as the reference group to calculate fold change. * P < 0.05, **P < 0.01, and P < 0.001.
| Tukey Test | Mean Diff. | Adjusted P-Value | Fold Change | Interpret |
|---|---|---|---|---|
| 24h vs. control | -3.883 | < 0.0001 | 0.06778 | down: 14.754 fold |
| 48h vs. control | 4.102 | < 0.0001 | 0.058234 | down: 17.172 fold |
| 48h vs. 24h | - 0.2186 | 0.7809 | 0.859399 | down: 1.164 fold |
Comparison of the Effect of Treatment with Ketoprofen Using Tukey Test
5. Discussion
Ovarian cancer is the most important etiology of death due to gynecologic malignancies. It is curable in the initial stages but rarely in advanced stages. Using particular tumor markers with diagnostic potential is a beneficial measure in improving treatment outcomes. If ovarian cancer is not invaded out of the ovaries, it can be diagnosed and treated, and the 5-year survival reaches 95%; however, only 25% of ovarian cancers are diagnosed in the early stages (2). A2780S cell line includes adherent and epithelial-like cells. This cell line has been selected due to its optimum proliferation rate. The cells of the A2780S cell line are cisplatin-resistant, and most ovarian cancer cells show resistance against cisplatin; thus, studies on these cells can provide information regarding cancer (21). In the present study, the effects of ketoprofen were assessed on the viability of the A2780s human ovarian cancer line.
In this study, ketoprofen was injected into the cell line at 24, 48, and 72 hours. The survival rate decreased with time, but the highest mortalities occurred after 24 hours (55/14 ± 5/78) (Figure 2). One of the reasons for this observation may be the presence of enough space for affecting the cells because the cell layers are increased with time and cell proliferation and decrease the effect of the drug. Another reason can be the initial shock of the drug on cells, which will cause the highest mortality. The results of the study showed a decrease in the expression of the HE4 gene and this reduction increased with time and indicated significant differences between the studied groups (P < 0.0001) (Figure 3). This finding could be explained by the fact that ketoprofen is a non-steroid component and a non-selective inhibitor of cyclooxygenase, and considering the role of cyclooxygenase in reducing the tumor cells' angiogenesis, inhibiting the aromatase enzymes, reducing cell proliferation, and increasing apoptosis, it could be said that by inhibiting cyclooxygenase, ketoprofen reduces the tumor growth and has anti-cancer and cytotoxic effects in ovarian cancer.
Bundred and Barnes indicated that non-steroid components non-selectively inhibit COX and reduce tumor cells' angiogenesis, resulting in diminished cancer tumor growth. Moreover, they showed that cyclooxygenase is associated with epithelial growth factor (EGF). EGF increases the growth of cancer cells and is considered an important factor in tumor progression (22). Hu indicated that COX-1 and COX-2 inhibitors, such as NSAIDs increase apoptosis in tumor cells (23). Lee et al. showed that COX-1 and COX-2 are associated with inflammation in ovarian cancer; thus, in patients with ovarian cancer, increased expression of COX-2 is associated with low survival (24). Damnjanovic et al., in their study, confirmed the effects of ketoprofen on cell toxicity and growth inhibition of malignant cells in the Caco-2 and HeLa cells, particularly at moderate concentrations. Ketoprofen exerted a cytostatic effect even regarding resistance to chemotherapy. One of the antiproliferative mechanisms of this drug is the transcription factor of NF-κB because NF-κB was evident at low doses of ketoprofen. Given that NF-κB is controlled by the modified expression of COX-2, the inhibition of this enzyme by ketoprofen is an important step in the treatment and prevention of colon and cervix cancer (25). Previous studies have accurately examined the effects of some NSAIDs in treating colon cancer, and their results indicated the importance of NSAIDs in the treatment and prevention of cancer (26). Da Silveira et al. concluded that ketoprofen-loaded nanocapsules (Keto-NCs) are an alternative for treating glioma because Keto-NC selectively reduces the survival of glioma cell line while causing no toxicity to astrocytes (27). Keramati et al. showed that ketoprofen reduced the tumor's weight and treated Wistar rats with ovarian cancer. Perhaps ketoprofen increases apoptosis, inhibits angiogenesis, reduces cell proliferation, and biologically modifies the tumor by inhibiting cyclooxygenase (3). All these results are in line with the results of our study. Ketoprofen could increase apoptosis in previous studies, confirming its cytotoxic and anti-cancer effects.
Although the use of ketoprofen in treating various cancers has not been studied enough, it is promising to add COX-1 and COX-2 inhibitors to the common chemotherapeutic medications as an effective therapeutic strategy in preventing malignant tumors and increasing survival rate.
5.1. Conclusion
The results of this study showed that ketoprofen reduces HE4 gene expression and viability of A2780S ovarian cancer cells and can affect ovarian cancer. However, the mechanism underlying these biological changes is unclear because various factors are involved in how cyclooxygenases affect living organisms. Therefore, more studies are needed to indicate the mechanism of action and how these enzymes affect living organisms in order to obtain a specific model for the treatment of patients with ovarian cancer. In the future, HE4 is expected to be an integral part of serum screening tests for ovarian epithelial cancer and to be used to classify patients.
