1. Background
The Myc protein is a transcription factor with essential roles in cell growth and proliferation. Numerous genomic variations in the 8q24 region, including amplifications, translocations, breakpoints, viral integrations, and single nucleotide variations (SNVs) occur in the neighborhood regions of the MYC locus. Therefore, it is likely that MYC is not the only target of these cancer-associated alterations, and many other non-coding genes surrounding MYC might contribute to carcinogenesis (1, 2). In hematopoietic stem cells (HSCs) or multipotent progenitors, deregulated gene expression, which arises from chromosomal aberrations or epigenetic alterations, can result in a variety of hematopoietic malignancies (3). Over the recent years, in vitro and in vivo data have indicated that c-Myc is one of the pivotal transcription factors that play critical roles in regulating hematopoiesis (4). MYC deregulation is recurrently found in many types of human lymphomas and leukemias. Although MYC deregulation happens through translocation in Burkitt lymphoma and less frequently in other types of lymphoma, the MYC is frequently over-expressed in acute lymphoblastic and myeloid leukemia via mechanisms unrelated to chromosomal translocation. This increased expression is often associated with disease progression (4, 5). Chronic myeloid leukemia (CML) is known to be driven by the BCR-ABL1 fusion gene. After oncogenic translocation, the BCR-ABL1 gene goes under the transcriptional control of the BCR promoter. However, the molecular mechanisms involved in the regulation of oncogene expression are mostly unknown. Myc is a well-recognized binding partner of BCR. BCR-ABL1 and BCR are transcriptionally controlled by Myc (6, 7). In addition, the Myc protein plays a major role in BCR-ABL1-mediated transformation, mainly by acting as a cooperative oncogene with the fusion protein (8, 9).
Our current understanding of the underlying genetic basis of leukemia hinges on decades of protein-centered research, and the contribution of non-coding regions to the initiation, maintenance, and evolution of this disease remains to be revealed (10). Coding sequences account for less than 2% of the genome, and it has become uncovered that aberrations within the non-coding genome drive important cancer phenotypes. The extensive transcription of RNA from non-protein-coding regions is one of the substantial findings of the transcriptomics world (11). Long non-coding RNAs (lncRNAs) have attracted much attention in recent years as a new layer of gene regulation. They perform a variety of functions by interaction with DNA, RNA, and protein molecules, including modulators of mRNA processing, transcription and translation, a source of microRNAs and competing for endogenous RNAs (ceRNAs), and regulators of nuclear architecture as well as chromatin structure. A large body of emerging evidence has revealed a vital contribution of lncRNAs to cancer development and progression (12, 13).
2. Objectives
Even neighboring genes can have mutual effects in bi-directional or one-directional manners. MYC has been shown to be surrounded by different lncRNAs that might play roles as transcriptional regulators of this proto-oncogene (14, 15). Some non-coding genes are found to be located within 8q24, including plasmacytoma variant translocation 1 (PVT1), colon cancer-associated transcript (CCAT) family, prostate cancer-associated transcript (PCAT) family, to mention a few. These non-coding sequences have been studied in different cancer types (14, 16). However, their role in CML is obscure and remains to be explored. Here, we evaluated the expression correlation of MYC and its two adjacent non-coding RNAs; PVT1 (located 51582 nucleotides downstream of MYC) in circular and linear forms and CASC11 (located 1467 nucleotides upstream of MYC) in CML patients.
3. Methods
3.1. Sample Collection
Untreated cases included a total of 19 CML positive (CML samples) and 23 CML negative cases (normal samples), referring to the Narges Genetics and PND Laboratory, Ahvaz, Iran, from 2019-2020, who were enrolled in the present study. CML positive patients were clinically diagnosed to have leukemia with an increased number of white blood cells (WBCs) and molecularly assessed using BCR-ABL fusion transcript analysis.
3.2. RNA Extraction and cDNA Synthesis
10 mL of peripheral blood samples were taken from all cases and collected in the nuclease-free EDTA-containing tubes. The isolation of peripheral blood mononuclear cells (PBMCs) was conducted using Ficoll-Paque™ (Sigma-Aldrich, Germany), and total RNA was extracted using TRIzol® reagent (Thermo Fisher Scientific, USA). RNA concentration was measured by a NanoDrop™ 2000/c spectrophotometer (Thermo Fisher Scientific, USA) and stored at -80˚C. RNA integrity was assessed using electrophoresis on 1% agarose gel containing SafeStain (CinnaGen, Iran). RNA was treated with DNaseI (Takara Bio, Inc., Japan) and Primescript™ RT reagent kit (Takara Bio, Inc., Japan) and was used for reverse transcription of RNA to cDNA.
3.3. Quantitative BCR-ABL Testing
BCR-ABL fusion gene transcript is detectable in more than 95% of CML patients. Also, these transcripts are rarely present in acute lymphocytic leukemia (ALL) and acute myeloid leukemia (AML) patients (this translocation is found in 10 to 20% of adults and in 2 to 5% of children with ALL, and in 1% approximately of AML cases). The level of BCR-ABL/ABL is lower (about 10 - 15%) in ALL and AML patients, while in most cases of CML, the range of BCR-ABL/ABL is 30 - 300% with an average of 80 - 90% (17). Quantification of the BCR-ABL fusion transcripts in both PBMCs and bone marrow aspirates of patients with CML using reverse transcription-polymerase chain reaction (RT-PCR) has been shown to be suitable for disease diagnosis and monitoring (18). Briefly, after cDNA synthesis, the number of fused transcripts produced from the Philadelphia chromosome was assessed using MBCR 210 RQ Kit (NovinGene, Iran) by quantitative RT-PCR. This kit is used for quantitative detection of BCR-ABL p210 translocation. Each sample was evaluated for the mRNA levels of the two transcripts; (p210) ABL-BCR and ABL. According to the five standards with definite copy numbers of ABL-BCR and ABL, the exact levels of these mRNAs were determined in the samples.
3.4. Gene Expression Analysis
The evaluation of gene expression was conducted on linear PVT1, circular PVT1 (CircPVT1), CASC11, and MYC as target genes, and ACTB as an endogenous control gene. Primers were designed using AlleleID6.0 software. The list of primers for all targeted genes is indicated in Table 1. Real-time PCR was performed using the SYBR® Premix Ex-Taq TMII (Takara Bio Inc., Shiga, Japan). Relative gene expression was calculated using the 2−ΔΔCt method.
| Gene | Ref Seq (Assembly: GRCh38.p13) | Sequence |
|---|---|---|
| ACTB | NM_001101.5 | |
| F | ATTGGCAATGAGCGGTTC | |
| R | TGAAGGTAGTTTCGTGGATG | |
| MYC | NM_002467.6; NM_001354870.1 | |
| F | GCGACTCTGAGGAGGAAC | |
| R | CTGCGTAGTTGTGCTGATG | |
| PVT1 | NR_003367.3 | |
| F | CTTGGAGGCTGAGGAGTTCA | |
| R | CTTCAGGCCTCTTTGACAGC | |
| Circ-PVT1 | ||
| F | CGACTCTTCCTGGTGAAGCATCTGAT | |
| R | TACTTGAACGAAGCTCCATGCAGC | |
| CASC11 | NR_117102.1; NR_117101.1 | |
| F | GCAGAAGGTCCGAAGAAAGAG | |
| R | TGTTCATTAGCAGTGGTGATAGG |
Abbreviations: F, forward; R, reverse.
3.5. Statistical Analysis
The analysis of gene expression data was performed using a t-test by GraphPad Prism version 8 (GraphPad Software, Inc., USA). Spearman's rank correlation coefficient was used for correlation analysis of relative gene expression.
3.6. In silico Analysis
In silico analyses consist of two parts, including the assessment of gene expression correlation analysis and lncRNA/miR/mRNA network analysis.
Gene Expression Profiling Interactive Analaysis (GEPIA) (http://gepia.cancer-pku.cn/detail.php?gene=&clicktag=survival) and GENT2 databases (http://gent2.appex.kr/gent2/) were used for gene expression correlation analysis.
The LncRNASNP tool (available via http://bioinfo.life.hust.edu.cn/lncRNASNP) was used to investigate the miRNA-trapping potential of lncRNAs. This bioinformatics tool enables us to search for miRNA binding sites on lncRNAs based on using different sources of data, including miRanda, TargetScan, and Pita. In the next step, miRTarBase, which includes all published miRNA target interaction data (http://mirtarbase.mbc.nctu.edu.tw/php/index.php), was used to predict the mRNA targets of previously found miRNAs. Then, SPEED (http://speed.sys-bio.net/) was applied to analyze signaling pathways in which these mRNAs are involved.
4. Results
4.1. BCR-ABL Translocation Analysis
BCR-ABL fused transcript is the diagnostic hallmark of CML. Accordingly, BCR-ABL transcript level was quantified in samples using the normalized copy number (NCN) method (19, 20). The ratio of ABL-BCR expression was normalized to ABL expression, and the percentage was calculated. According to the results, the samples were categorized as CML positive and negative (normal) (Table 2).
| Characteristics | Mean (Min-Max) |
|---|---|
| Age (y) | 44.6 ± 13.9 (28-76) |
| Gender (M/F) | 10/9 |
| White blood cell count (109/ L) | 330 ± 235 (88 - 714) |
| (BCR-ABL)/ABL% | 77.53 ± 0.83 (13.95 - 206.13) |
4.2. Gene Expression Analysis
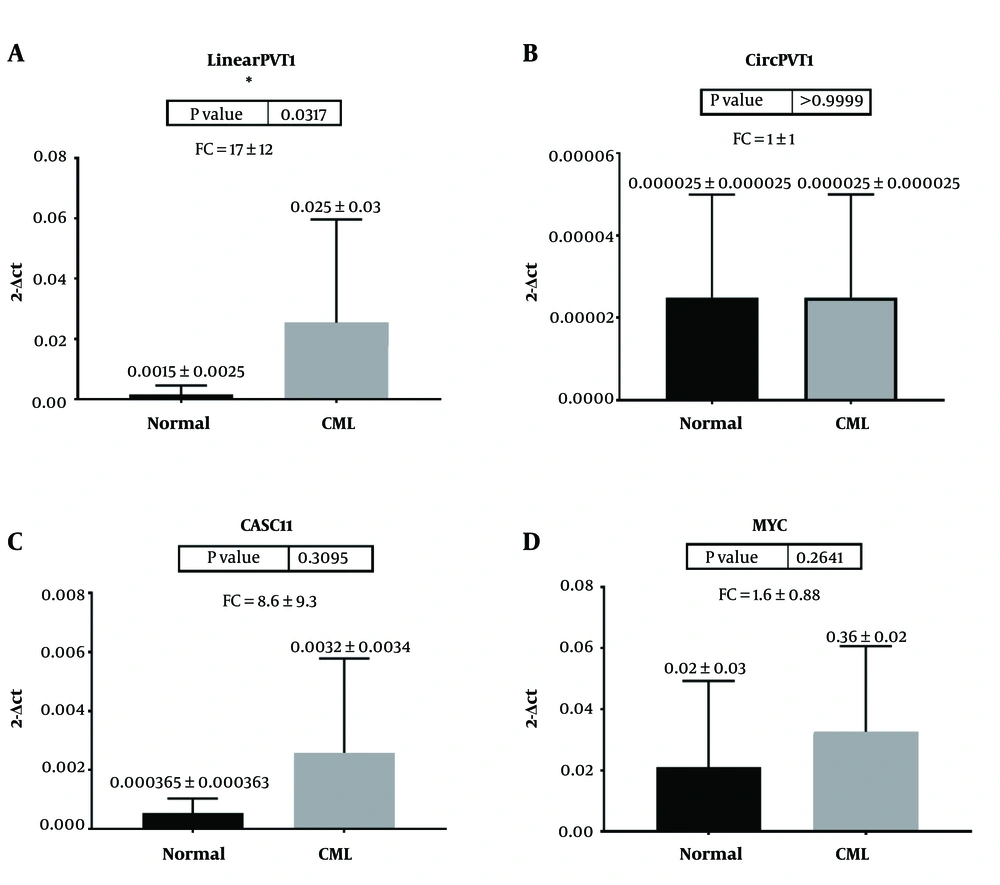
The expression of MYC, linear PVT1, CircPVT1, and CASC11, which are located downstream and upstream of MYC, was evaluated in CML and normal groups. Gene expression analysis showed a significantly higher expression of linear PVT1 (P = 0.03) in CML patients compared with normal samples. Our results indicated that the expression of the linear form of PVT1, but not a circular one, is remarkably enhanced in CML samples. CASC11 and MYC also exhibited a trend of overexpression; however, it was not statistically significant (Figure 1).
Gene expression analysis in chronic myeloid leukemia (CML) and normal samples. a) Linear PVT1, b) Circular PVT1, c) CASC11, and d) MYC. Data indicate a significant overexpression of Linear PVT1 in CML compared with the normal group. (P-values below 0.05 were considered statistically significant, fold change (FC) = 2-ΔΔCt)
4.3. Gene Expression Correlation Analysis
The correlation of gene expression in both CML positive and negative samples was assessed using Spearman's correlation coefficient (R) (Table 3). We did not find any statistically significant data for the correlation analyses (P > 0.05). However, it should be noticed that most of the correlations decreased in CML compared with the normal group. Because of our limited experimental samples, we also analyzed the in silico gene expression correlations data of MYC and its surrounding non-coding RNA genes, including PVT1, and CASC11 to make more clear data. According to GEPIA and GENT2 analyses (Table 4), all gene expression (normalized to ACTB) correlations in the whole blood (TGEX) were moderately positive (R > 0.5, P < 0.05), whereas correlations were weak (R < 0.3, P < 0.05) in CML cell lines (TGEX) and CML samples (GENT2).
| Genes (normalized to ACTB) | Normal | CML | ||
|---|---|---|---|---|
| R | P-Value | R | P-Value | |
| MYC- Linear PVT1 | - 0.30 | 0.68 | - 0.60 | 0.35 |
| MYC-CASC11 | 0.20 | 0.91 | 0.20 | 0.08 |
| Linear PVT1-CASC11 | 0.90 | 0.08 | -0.80 | 0.78 |
| CircPVT1- MYC | -0.50 | 0.91 | -1 | 0.08 |
| CircPVT1- Linear PVT1 | -0.80 | 0.08 | 0.20 | 0.91 |
| CircPVT1- CASC11 | -0.80 | 0.33 | -0.40 | 0.75 |
| Genes (Normalized to ACTB) | Whole Blood (GTEX) | CML Cell Line (GTEX) | CML Samples (GENT2) | |||
|---|---|---|---|---|---|---|
| R | P-Value | R | P-value | R | P-Value | |
| MYC-PVT1 | 0.64 | 0 | 0.17 | 0.17 | 0.49 | 1.58e-006 |
| MYC-CASC11 | 0.56 | 0 | 0.54 | 2.2e-06 | - 0.03 | 0.74 |
| PVT1-CASC11 | 0.61 | 0 | 0.11 | 0.36 | - 0.15 | 0.16 |
4.4. PVT1 and CASC11 / miRNA/ mRNA Potential Interaction
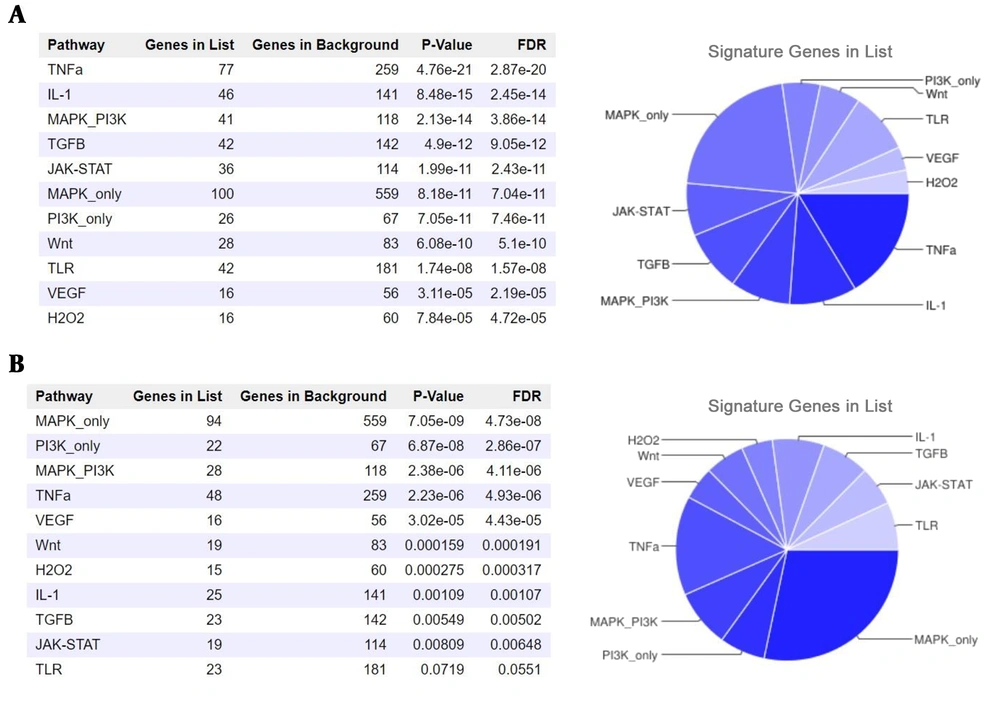
Our analyses suggested a collection of 94 miRs targeting PVT1. This collection of miRs targets 6750 coding genes. Protein-coding genes most significantly targeted by PVT1-trapped miRNAs are members of the TNFα signaling pathway (Figure 2). Also, our findings from lncRNASNP2 suggested that CASC11 transcript harbors 87 miR binding sites. This bunch of miRs can target 5175 mRNAs of coding genes, most of which belong to the MAPK signaling pathway.
5. Discussion
The human chromosomal region 8q24, which is frequently disrupted in a variety of cancers, is the site for several lncRNAs in the neighborhood of MYC (21, 22). The aberrant expression of lncRNAs has been found to be associated with various human malignancies. However, limited data is available about the functional involvement of lncRNAs in CML tumorigenesis. In the present study, we performed a gene expression assessment for MYC and its two surrounding lncRNAs CASC11 and PVT1 (circular and linear forms), which are located within the 8q24 region. Our results highlighted that PVT1 linear RNA has a significantly higher expression (P = 0.0317) in CML patients compared with the normal group. PVT1 has been shown to be dysregulated in several cancers. Also, recently, the elevation of this lncRNA has been reported in some kinds of leukemia, including APL and AML (23, 24). Here, we revealed that this lncRNA is upregulated in CML. It seems that PVT1 linear RNA represents the potential to be used as a marker for CML detection. CASC11 has been studied recently and identified as an oncogenic lncRNA (25-27). CASC11 locus and transcript encompass the rs16902359 SNP, which showed an association with lymphoma (28). However, there is no report about this lncRNA in leukemia and the present study is the first report regarding the CASC11 assessment in leukemia. Although we did not observe significant changes in CASC11 expression, the average increase in the expression of this gene can indicate that there might be a significant increase merely in a subgroup of CML samples. Further studies with more samples and sub classified of the disease can provide more accurate information.
MYC also showed a trend of overexpression, but it was not statistically significant. Some reports showed significant overexpression of MYC in advanced phases of CML (29, 30). We did not categorize CML subtypes; thus, the lack of significant overexpression of MYC could be because of the presence of different types of CML in our study.
Neighboring genes can affect each other in bi-directional or one-directional manners. This effect is highly pronounced in the immediate vicinity ( < 100 kb), but it can extend much further (31). Cis-acting lncRNAs have been demonstrated to activate, repress, or otherwise modulate the expression of target genes through various mechanisms (13). PVT1 is a cis-regulatory lncRNA that harbors numerous enhancer elements (21, 32). To find a possible relationship between MYC, PVT1, and CASC11, we analyzed the correlation between the expression of genes. According to the experimental and in silico results, it seems that the target gene expression correlations mostly decreased in CML compared with the normal group. In cancer cells, distributions of chromatin folding and gene regulation occur in various tumor types, and certain regions are affected in a cancer-specific manner (33). It seems the moderate positive correlations between target genes in normal samples impair in CML, which is likely due to the epigenetics alteration changes in chromatin folding, and accessibility of enhancers in genomic regions in cancerous compared with the normal status.
We also assessed the miR-sponging potency of target genes and the possible effect of these interactions on signaling pathways. Carcinogenesis-related signaling pathways could be regulated by PVT1 and CASC11 through the RNA network (Figure 2). TNFα is highly detected in CML patients and may serve as a new target therapy for the disease (34). PVT1 overexpression in CML samples with subsequently increased potential of miRNA trapping can be accompanied by the availability of the members of these pathways, in particular, TNFα and promotion of leukemogenesis. Therefore, we suggest PVT1 as a potential enhancer of the TNFα pathway via sponging miRs. Notably, Tang et al. recently reported regulation of TNFα by PVT1 in rheumatoid arthritis (35). Further experimental studies could shed more light on our hypothesis.
Altogether, our findings based on targeted coding and non-coding RNAs in 8q24 expression analysis highlight the significant over-expression of linear-PVT1 in CML samples compared with normal ones. Our results imply that MYC, PVT, and CASC11 correlations are decreased in CML cancerogenesis; however, increasing the experimental sample size could be an effective way to obtain more accurate results. These transcripts could potentially affect some critical CML-related signaling pathways through the lncRNA-miR-mRNA network. Using knockout or knockdown models of these transcripts, as well as the assessment of the activity and expression of members of introduced signaling pathways, our preliminary findings can be approved.


